Updated on April 4th, 2024 by Bob Ciura
Spreadsheet updated daily
The NASDAQ Dividend Achievers Index is made up of 402 stocks with 10+ consecutive years of dividend increases, that also meet certain minimum size and liquidity requirements.
It is one of the best sources to find high-quality dividend growth stocks.
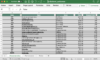
The downloadable Dividend Achievers Spreadsheet List below contains the following for each stock in the index:
- Sector
- Dividend yield
- Name and ticker
- Price-to-earnings ratio
You can download your free Excel list of all Dividend Achievers by clicking on the link below:
Note: The Dividend Achievers list is updated using the holdings from this Invesco ETF.
Use The Dividend Achievers List To Find Quality Dividend Growth Stocks
The list of all Dividend Achievers is valuable because it provides dividend growth investors with a long list of stocks that have increased their dividends for at least 10+ consecutive years.
These are companies with shareholder-friendly management teams committed to rewarding investors. They have an ability to do so because of sustained earnings growth.
Together, these two criteria form a powerful pair. They become even more powerful for the investor who buys high-quality dividend growth stocks when they are undervalued.
The spreadsheet above allows you to sort by price-to-earnings ratio (or dividend yield) so you can quickly find undervalued dividend paying businesses with 10+ years of consecutive dividend increases.
Here’s how to use the Dividend Achievers list to quickly find high quality dividend growth stocks potentially trading at a discount:
- Download the list
- Sort by P/E ratio, lowest to highest
- Filter out stocks yielding less than 3%
- Research the top stocks further to find the best ideas
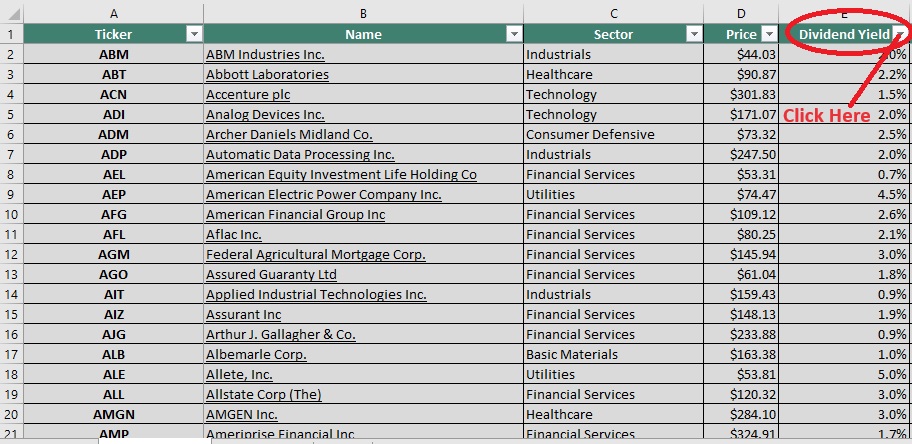
For those unfamiliar with Excel, here’s how to filter out stocks yielding less than 3%:
Step 1: Click on the dividend yield filter button:
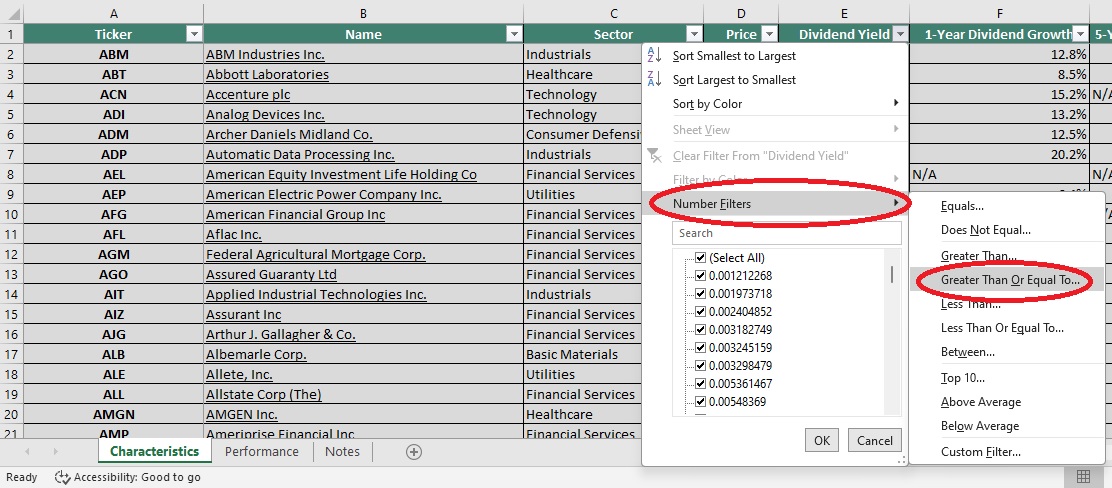
Step 2: Go to ‘Number Filters’, and then click on ‘Greater Than or Equal To’:
Step 3: Enter your desired yield amount (as a decimal), .03 in the example above. Then press ‘OK’.
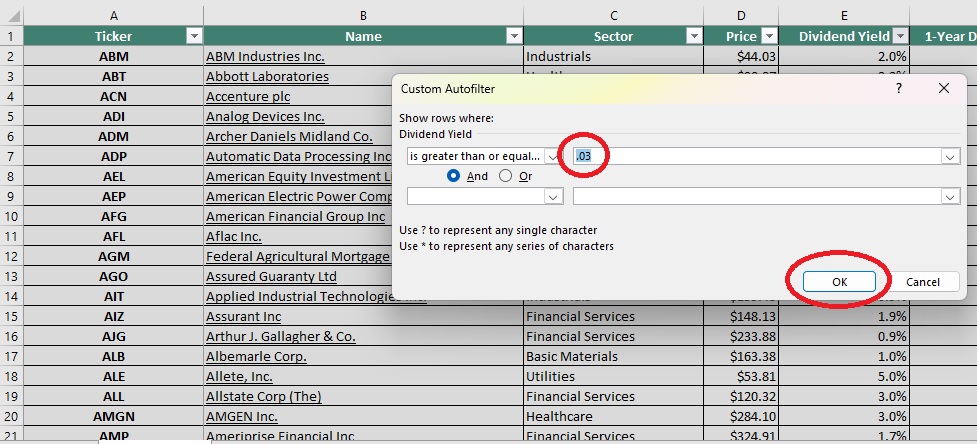
That’s it; the remaining stocks will all have dividend yields above 3%.
Other Dividend Lists
The Dividend Achievers list is not the only way to quickly screen for stocks with long histories of dividend growth.
The Dividend Aristocrats Index is comprised of 68 stocks with 25+ years of consecutive dividend increases. It is more exclusive than the Dividend Achievers Index.
There is a similar group known as the Dividend Champions, which also have raised their dividends for 25+ consecutive years. The Dividend Champions is a bigger list as it includes stocks that do not qualify as Dividend Aristocrats because of indexing or trading volume restrictions.
The Dividend Kings List is even more exclusive. It is comprised of 56 stocks with 50+ years of consecutive dividend increases.
The Blue Chip Stocks list has 350+ stocks that belong to either the Dividend Achievers, Dividend Aristocrats, or Dividend Kings list.
Performance of the Dividend Achievers Index
In the past five years, the major ETF that tracks the Dividend Achievers, the Invesco Dividend Achievers ETF (PFM), generated 10.93% annualized total returns. It has underperformed the comparable ETF that tracks the S&P 500 Index (SPY), in the same period.
SPY has generated annualized total returns of 14.48% in the past five years. There are a couple reasons for this.
First, the Dividend Aristocrats index is equally weighted, while the Dividend Achievers index is market cap weighted.
On the surface, this doesn’t sound like it matters much, but it has serious repercussions for returns.
This means that larger stocks with higher market caps make up a greater portion of the Dividend Achievers index. The top 5 Dividend Achievers by weight are listed below (along with their weight):
- Microsoft (MSFT): 4.01%
- Apple Inc. (AAPL): 3.67%
- Broadcom (AVGO): 2.97%
- JP Morgan Chase (JPM): 2.74%
- Walmart Inc. (WMT): 2.28%
I’m not saying these large holdings don’t make good dividend investments. Market cap has virtually no sway in determining the best Dividend Achievers. The problem with market cap weighting is that it is the opposite of value investing.
Imagine that a stocks’ price-to-earnings ratio rises from 10 to 20 while earnings do not change. The company’s market cap would double. In the real world, paying twice as much for the same thing is not a ‘good deal’. With market cap weighting, the Dividend Achievers index would hold double its investment in the business that saw its P/E ratio double.
Also, the Dividend Achievers index does not increase ownership in businesses that have seen their market caps decline. This means that if a different business saw its price-to-earnings ratio decline from 30 to 15 (and earnings were unchanged), the index would see its ownership of this business fall by 50%.
Market cap weighting buys high and sells low. Market cap weighting does not take advantage of valuation, while equal weighting does.
With equal weighting, if a company’s price-to-earnings ratio falls by 50%, the fund will have to buy more to keep weights equal. Similarly, an equal weighted fund will have to sell when the price-to-earnings ratio of a business rises to keep the fund equally weighted.
Another difference between the two groups is dividend history. While 10 years is a sizeable streak of consecutive dividend payments, it covers (at best) 1 economic cycle.
25 years of consecutive dividend increases covers multiple economic cycles. Dividend Achievers do not have the same level of consistency as Dividend Aristocrats. Dividend history matters.
Thoughts on Underperformance
SPY and PFM are both market cap weighted. PFM has a higher expense ratio, but before running historical performance numbers I would have expected PFM to outperform SPY.
Dividend stocks have historically outperformed non-dividend paying stocks. Stocks with long dividend histories (Dividend Aristocrats) have historically outperformed the market.
Why haven’t the Dividend Achievers outperformed? One reason could be that the valuation multiple of the broader SPY fund has expanded at a faster rate than for PFM.
The inability of the Dividend Achievers index to outperform the S&P 500 over a period of time that has been relatively favorable for dividend stocks (due to falling interest rates) is perplexing.
Regardless, there are better dividend ETFs for fund investors to choose from.
A Starting Point
The Dividend Achievers list is best used as a starting point for finding high-quality dividend growth stocks.
Being on the list in itself does not automatically guarantee an individual stock has a durable competitive advantage, or that it is a good investment.
Long-term investors should verify that an investment has a strong and durable competitive advantage, a shareholder friendly management, and trades at a reasonable (preferably low) valuation.
Combing the list for these type of businesses can greatly speed up the search for high quality shareholder friendly businesses trading at fair or better prices.
Other Dividend Lists & Final Thoughts
The Dividend Achievers list is not the only way to quickly screen for stocks that regularly pay rising dividends..
- The 10 Best Dividend Aristocrats
- The High Dividend Stocks List: stocks that appeal to investors interested in the highest yields of 5% or more.
- The Monthly Dividend Stocks List: stocks that pay dividends every month, for 12 dividend payments per year.