Updated on April 12th, 2024 by Bob Ciura
Spreadsheet data updated daily
Real estate investment trusts – or REITs, for short – can be fantastic securities for generating meaningful portfolio income. REITs widely offer higher dividend yields than the average stock.
While the S&P 500 Index on average yields less than 2% right now, it is relatively easy to find REITs with dividend yields of 5% or higher.
The following downloadable REIT list contains a comprehensive list of U.S. Real Estate Investment Trusts, along with metrics that matter including:
- Stock price
- Dividend yield
- Market capitalization
- 5-year beta
You can download your free 200+ REIT list (along with important financial metrics like dividend yields and payout ratios) by clicking on the link below:
In addition to the downloadable Excel sheet of all REITs, this article discusses why income investors should pay particularly close attention to this asset class. And, we also include our top 7 REITs today based on expected total returns.
Table Of Contents
In addition to the full downloadable Excel spreadsheet, this article covers our top 7 REITs today, as ranked using expected total returns from The Sure Analysis Research Database.
The table of contents below allows for easy navigation.
- How To Use The REIT List
- Why Invest In REITs?
- REIT Financial Metrics
- The Top 7 REITs Today
#7: Uniti Group (UNIT)
#6: Healthcare Realty Trust (HR)
#5: Global Net Lease (GNL)
#4: Medical Properties Trust (MPW)
#3: Brandywine Realty Trust (BDN)
#2: Clipper Realty (CLPR)
#1: Office Properties Income Trust (OPI)
How To Use The REIT List To Find Dividend Stock Ideas
REITs give investors the ability to experience the economic benefits associated with real estate ownership without the hassle of being a landlord in the traditional sense.
Because of the monthly rental cash flows generated by REITs, these securities are well-suited to investors that aim to generate income from their investment portfolios. Accordingly, dividend yield will be the primary metric of interest for many REIT investors.
For those unfamiliar with Microsoft Excel, the following images show how to filter for high dividend REITs with dividend yields between 5% and 7% using the ‘filter’ function of Excel.
Step 1: Download the Complete REIT Excel Spreadsheet List at the link above.
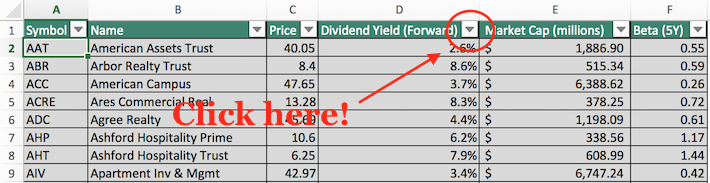
Step 2: Click on the filter icon at the top of the ‘Dividend Yield’ column in the Complete REIT Excel Spreadsheet List.
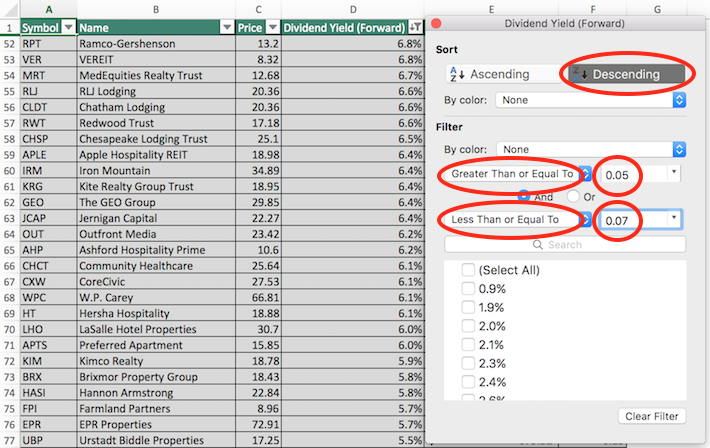
Step 3: Use the filter functions ‘Greater Than or Equal To’ and ‘Less Than or Equal To’ along with the numbers 0.05 ad 0.07 to display REITs with dividend yields between 5% and 7%.
This will help to eliminate any REITs with exceptionally high (and perhaps unsustainable) dividend yields.
Also, click on ‘Descending’ at the top of the filter window to list the REITs with the highest dividend yields at the top of the spreadsheet.
Now that you have the tools to identify high-quality REITs, the next section will show some of the benefits of owning this asset class in a diversified investment portfolio.
Why Invest in REITs?
REITs are, by design, a fantastic asset class for investors looking to generate income.
Thus, one of the primary benefits of investing in these securities is their high dividend yields.
The currently high dividend yields of REITs is not an isolated occurrence. In fact, this asset class has traded at a higher dividend yield than the S&P 500 for decades.
Related: Dividend investing versus real estate investing.
The high dividend yields of REITs are due to the regulatory implications of doing business as a real estate investment trust.
In exchange for listing as a REIT, these trusts must pay out at least 90% of their net income as dividend payments to their unitholders (REITs trade as units, not shares).
Sometimes you will see a payout ratio of less than 90% for a REIT, and that is likely because they are using funds from operations, not net income, in the denominator for REIT payout ratios (more on that later).
REIT Financial Metrics
REITs run unique business models. More than the vast majority of other business types, they are primarily involved in the ownership of long-lived assets.
From an accounting perspective, this means that REITs incur significant non-cash depreciation and amortization expenses.
How does this affect the bottom line of REITs?
Depreciation and amortization expenses reduce a company’s net income, which means that sometimes a REIT’s dividend will be higher than its net income, even though its dividends are safe based on cash flow.
Related: How To Value REITs
To give a better sense of financial performance and dividend safety, REITs eventually developed the financial metric funds from operations, or FFO.
Just like earnings, FFO can be reported on a per-unit basis, giving FFO/unit – the rough equivalent of earnings-per-share for a REIT.
FFO is determined by taking net income and adding back various non-cash charges that are seen to artificially impair a REIT’s perceived ability to pay its dividend.
For an example of how FFO is calculated, consider the following net income-to-FFO reconciliation from Realty Income (O), one of the largest and most popular REIT securities.
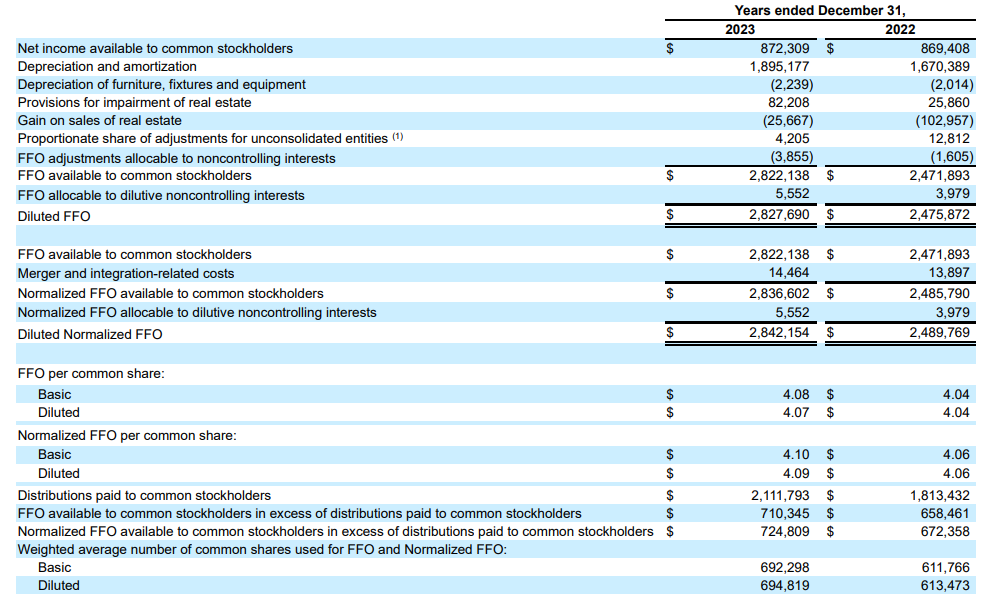
Source: Realty Income Annual Report
In 2023, net income was $872 million while FFO available to stockholders was above $2.8 billion, a sizable difference between the two metrics. This shows the profound effect that depreciation and amortization can have on the GAAP financial performance of real estate investment trusts.
The Top 7 REITs Today
Below we have ranked our top 7 REITs today based on expected total returns.
Expected total returns are in turn made up from dividend yield, expected growth on a per unit basis, and valuation multiple changes. Expected total return investing takes into account income (dividend yield), growth, and value.
Note: The REITs below have not been vetted for safety. These are high expected total return securities, but they may come with elevated risks.
We encourage investors to fully consider the risk/reward profile of these investments.
For the Top 10 REITs each month with 4%+ dividend yields, based on expected total returns and safety, see our Top 10 REITs service.
Top REIT #7: Uniti Group (UNIT)
- Expected Total Return: 17.5%
- Dividend Yield: 10.5%
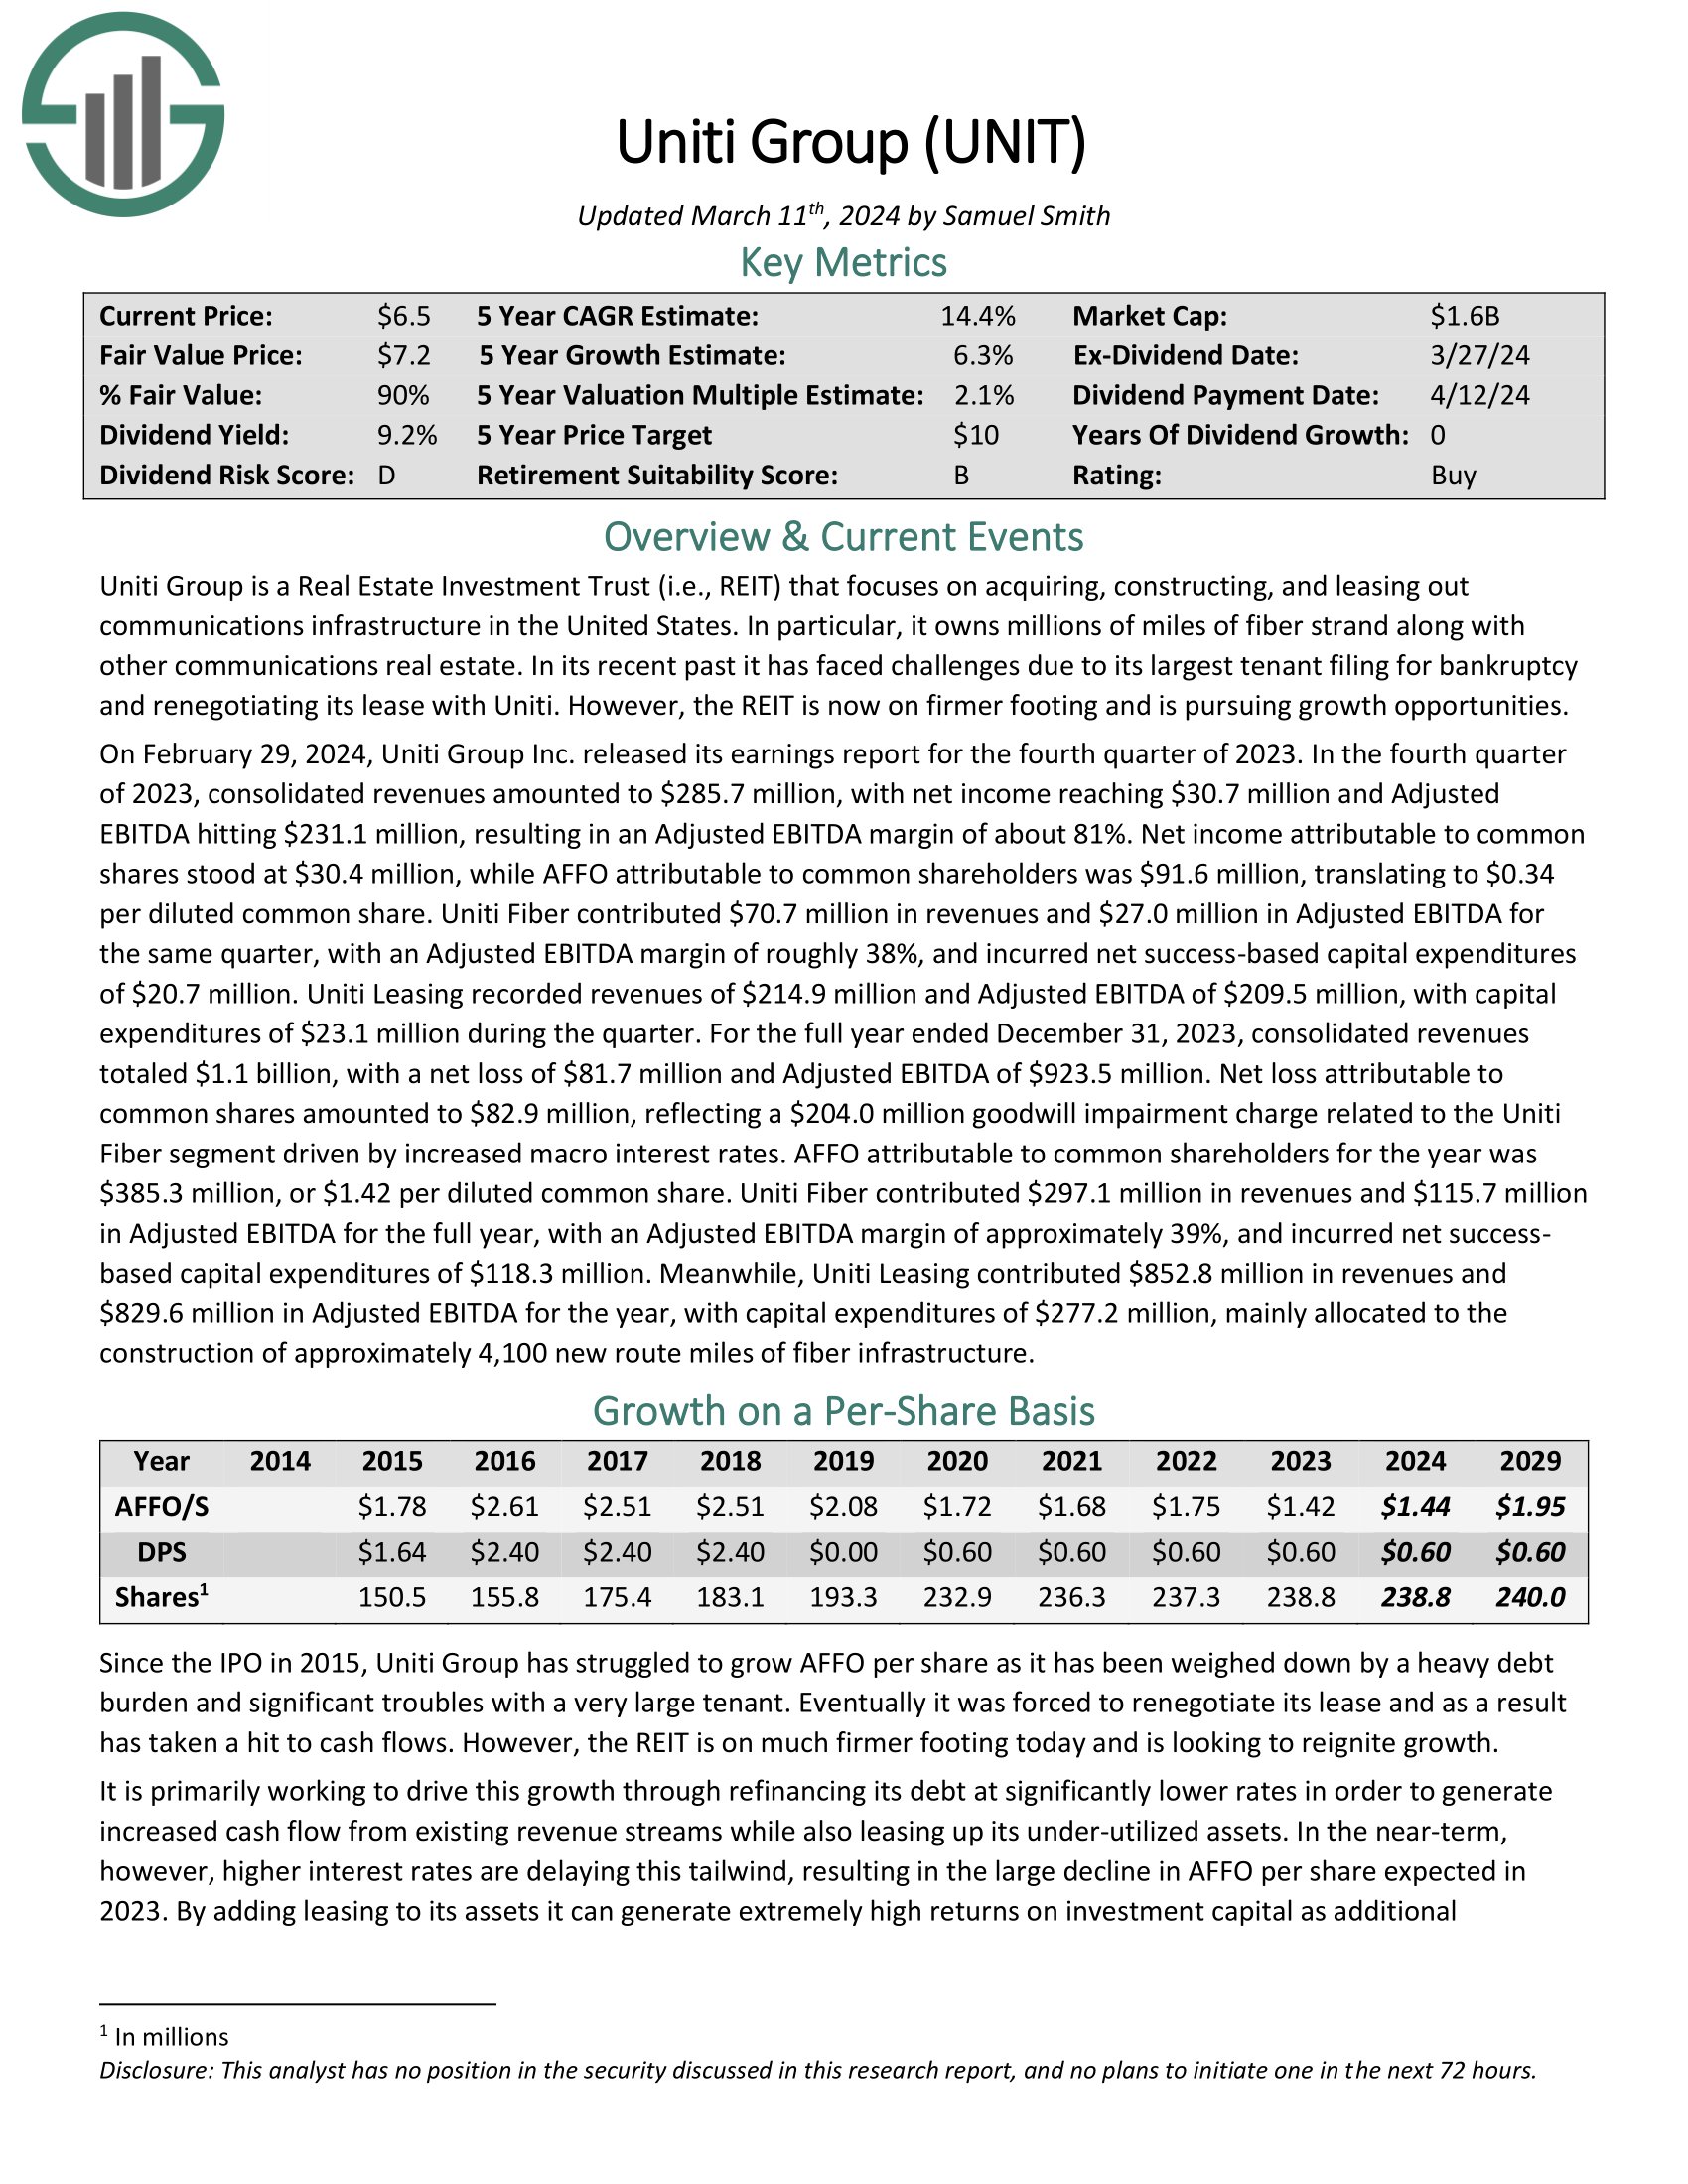
Uniti Group focuses on acquiring, constructing, and leasing out communications infrastructure in the United States. In particular, it owns millions of miles of fiber strand along with other communications real estate. In its recent past it has faced challenges due to its largest tenant filing for bankruptcy and renegotiating its lease with Uniti. However, the REIT is now on firmer footing and is pursuing growth opportunities.
On February 29, 2024, Uniti Group Inc. released its earnings report for the fourth quarter of 2023. In the fourth quarter of 2023, consolidated revenues amounted to $285.7 million, with net income reaching $30.7 million and Adjusted EBITDA hitting $231.1 million, resulting in an Adjusted EBITDA margin of about 81%.
Net income attributable to common shares stood at $30.4 million, while AFFO attributable to common shareholders was $91.6 million, translating to $0.34 per diluted common share. Uniti Fiber contributed $70.7 million in revenues and $27.0 million in Adjusted EBITDA for the same quarter, with an Adjusted EBITDA margin of roughly 38%.
Click here to download our most recent Sure Analysis report on UNIT (preview of page 1 of 3 shown below):
Top REIT #6: Health Care Realty Trust (HR)
- Expected Total Return: 17.6%
- Dividend Yield: 8.7%
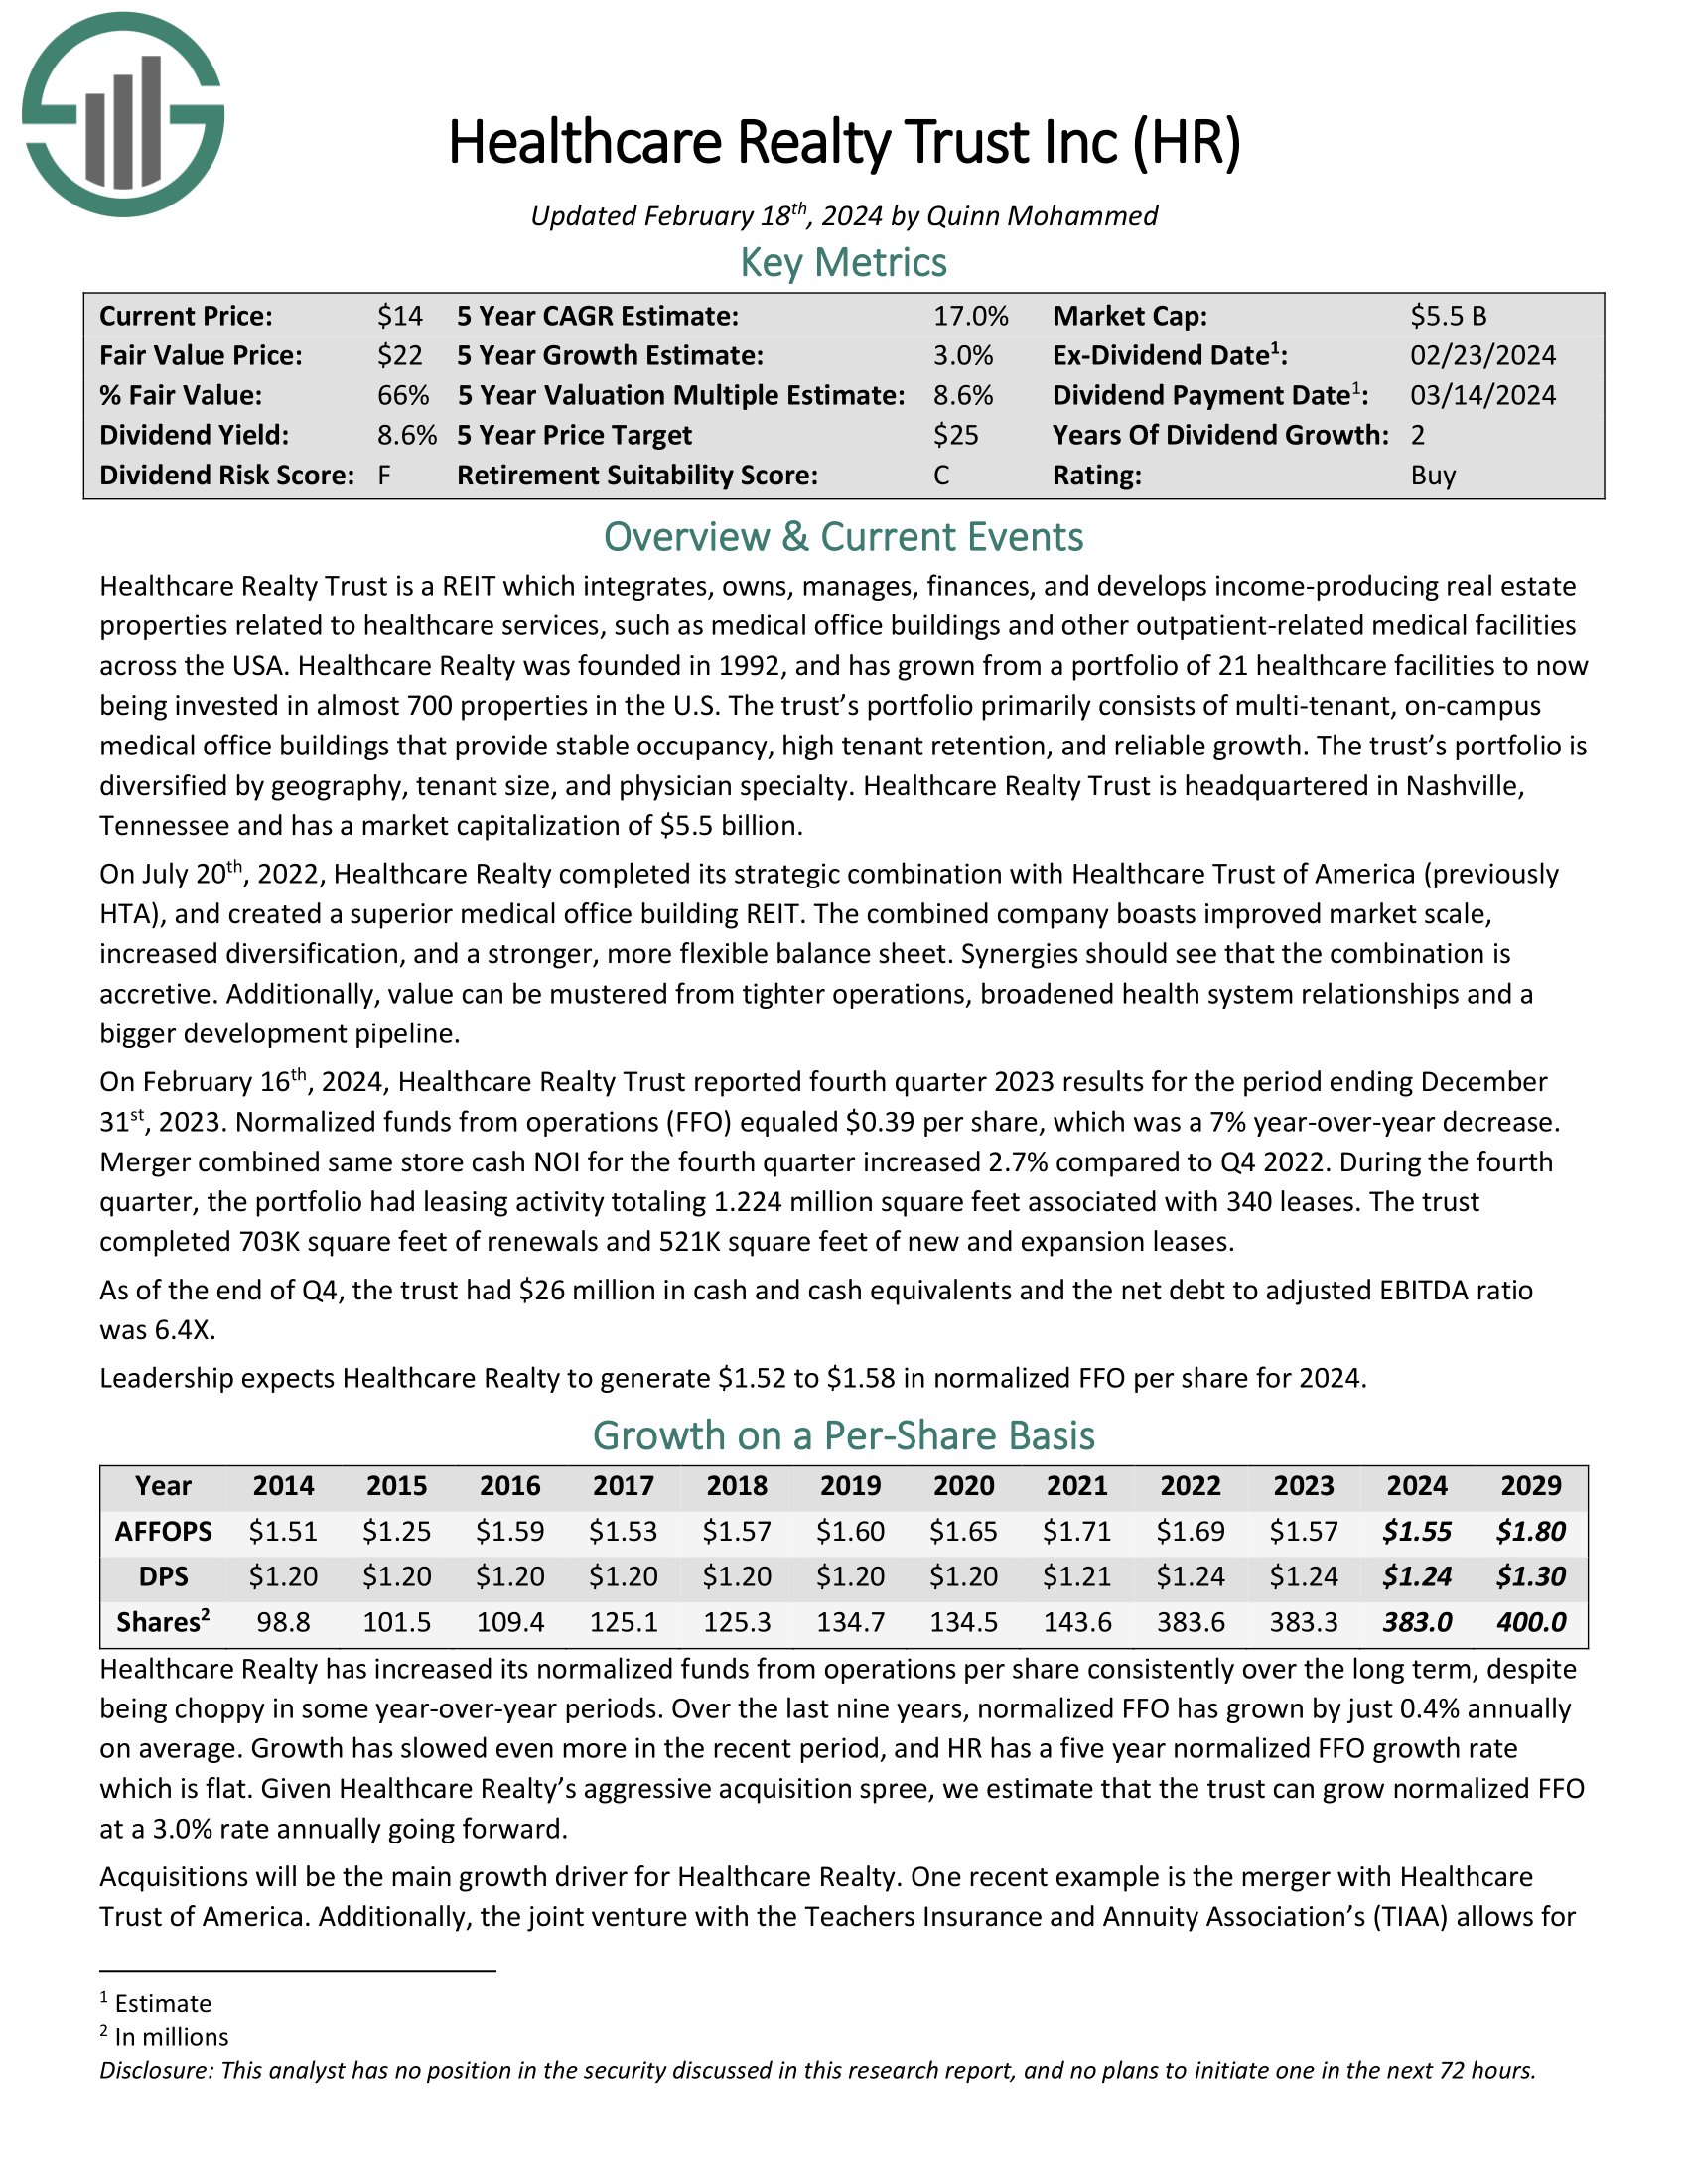
Healthcare Realty Trust is a REIT which integrates, owns, manages, finances, and develops income-producing real estate properties related to healthcare services, such as medical office buildings and other outpatient-related medical facilities across the USA. Healthcare Realty was founded in 1992, and has grown from a portfolio of 21 healthcare facilities to now being invested in almost 700 properties in the U.S.
The trust’s portfolio primarily consists of multi-tenant, on-campus medical office buildings that provide stable occupancy, high tenant retention, and reliable growth. The trust’s portfolio is diversified by geography, tenant size, and physician specialty.
On February 16th, 2024, Healthcare Realty Trust reported fourth quarter 2023 results for the period ending December 31st, 2023. Normalized funds from operations (FFO) equaled $0.39 per share, which was a 7% year-over-year decrease. Merger combined same store cash NOI for the fourth quarter increased 2.7% compared to Q4 2022.
Click here to download our most recent Sure Analysis report on HR (preview of page 1 of 3 shown below):
Top REIT #5: Global Net Lease (GNL)
- Expected Total Return: 20.4%
- Dividend Yield: 18.9%
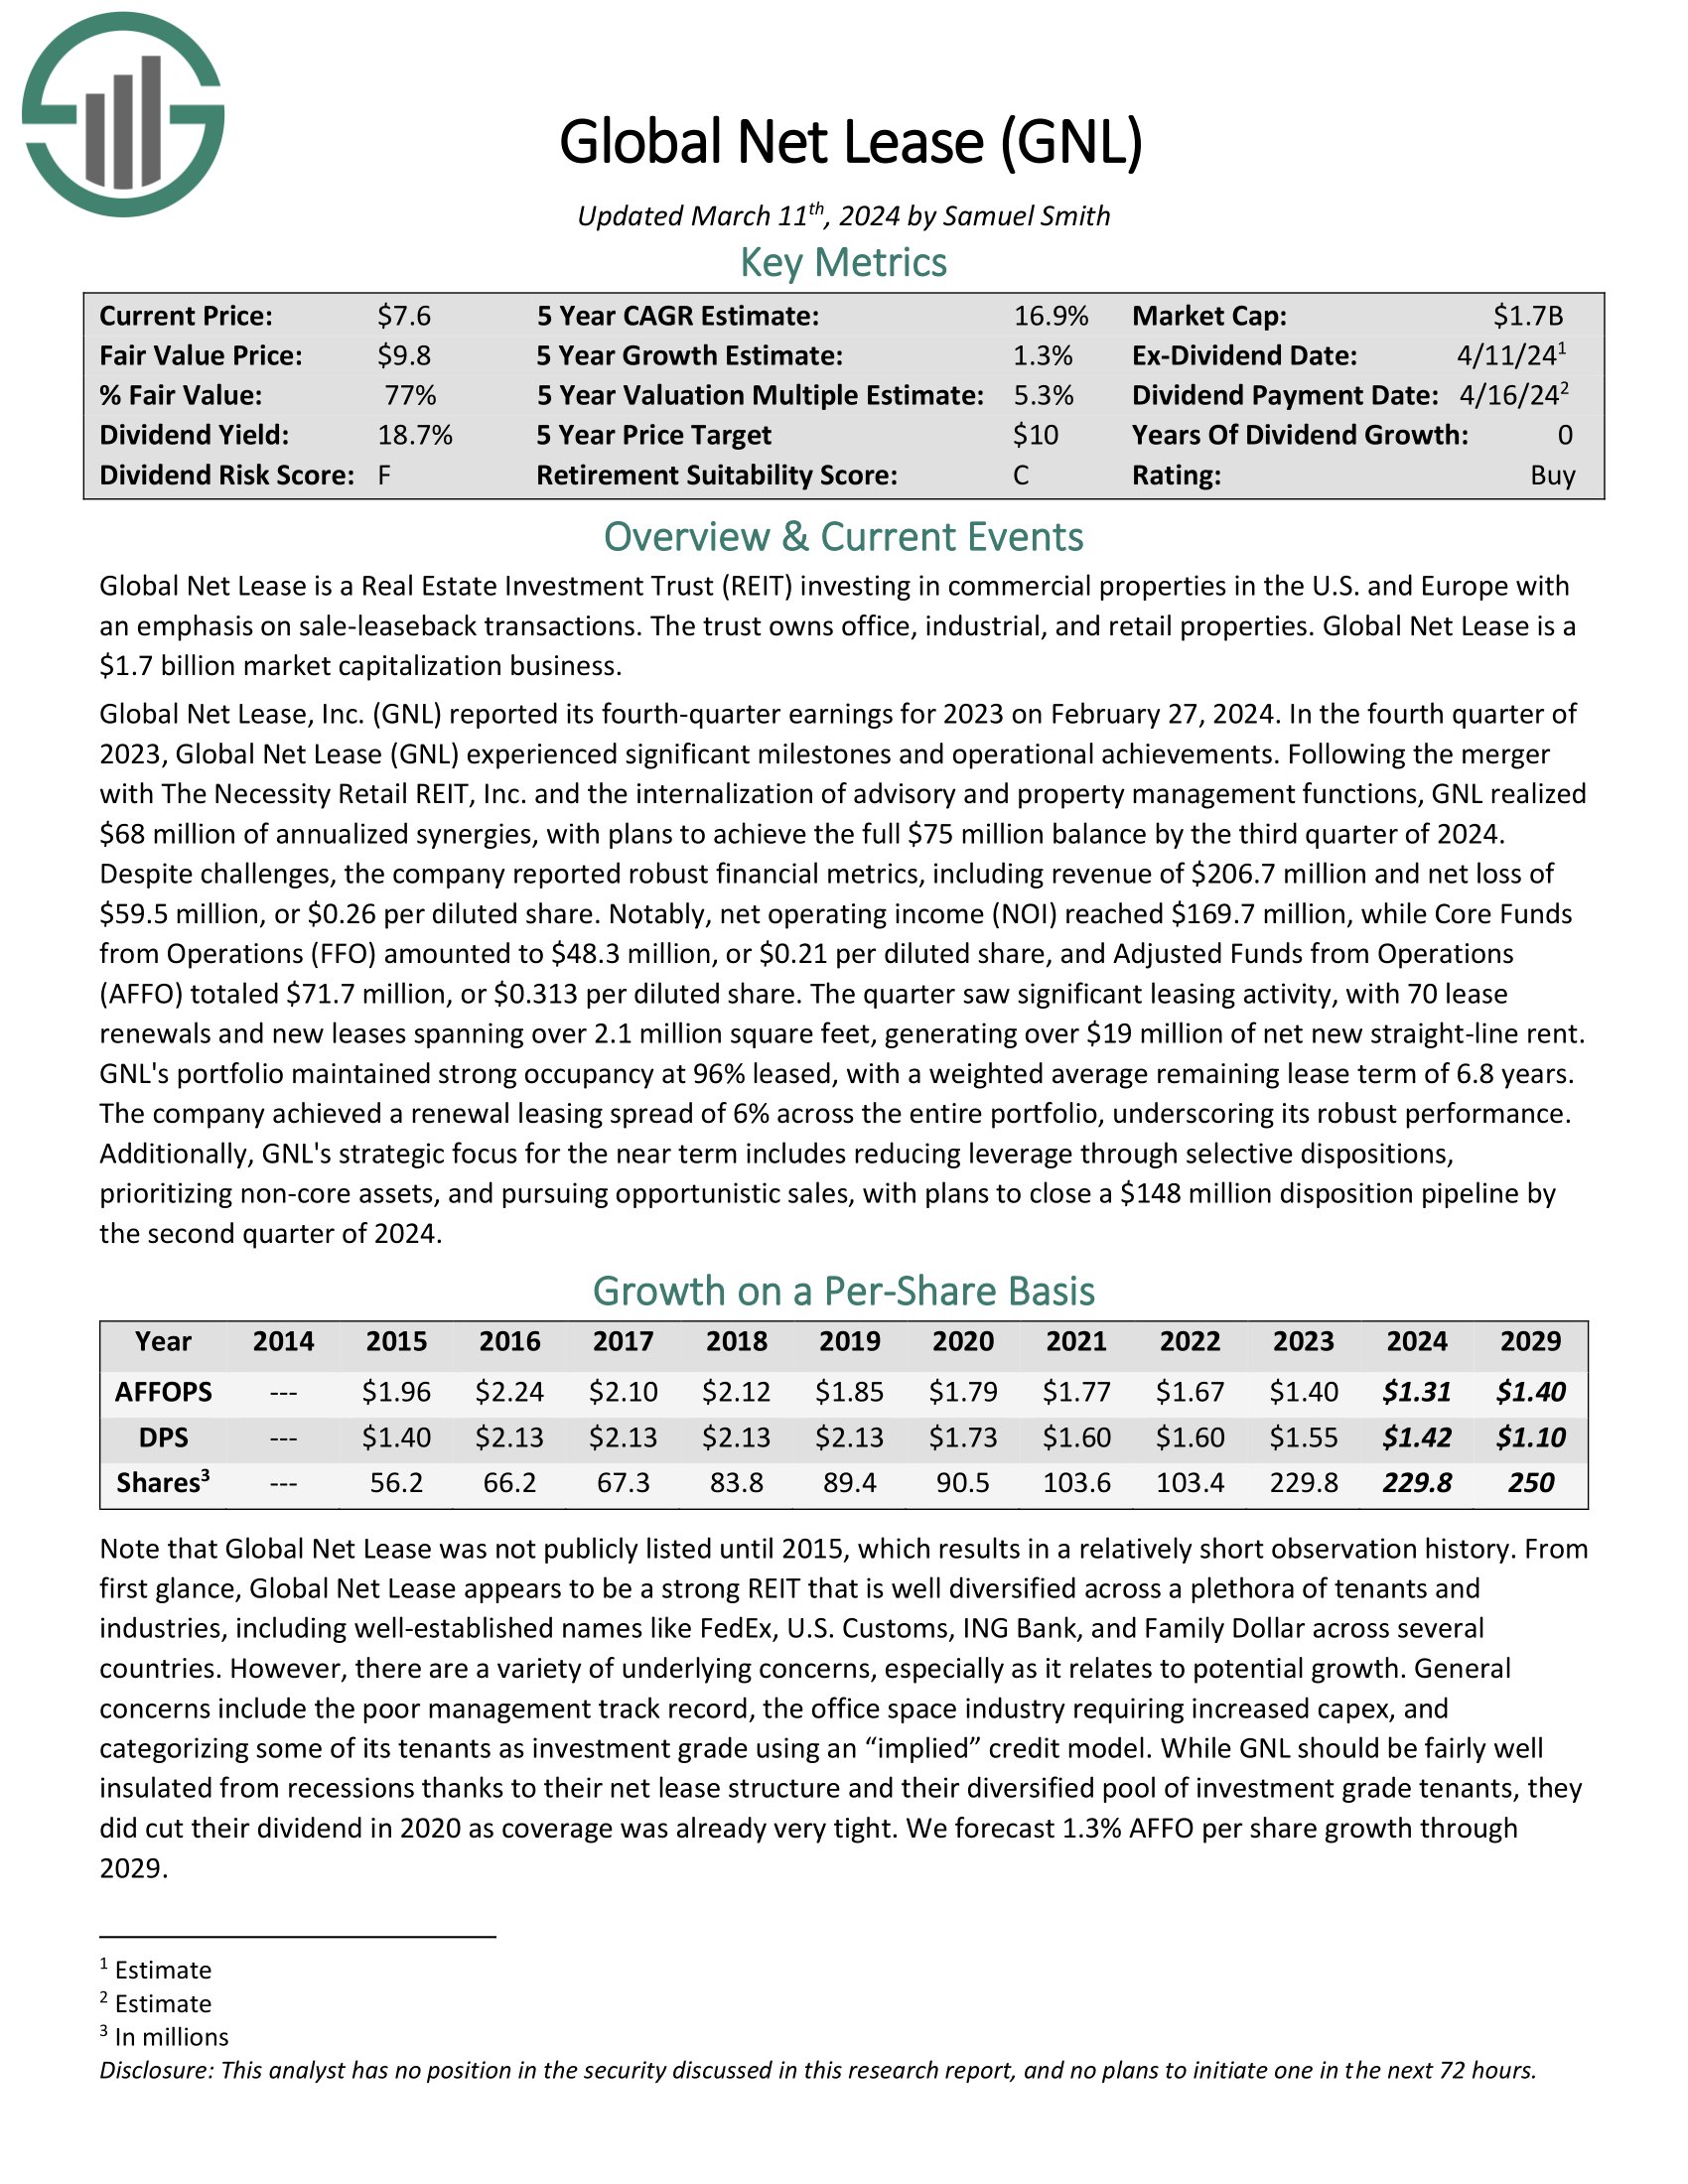
Global Net Lease invests in commercial properties in the U.S. and Europe with an emphasis on sale-leaseback transactions. GNL’s portfolio includes over 1300 properties, spanning nearly 67 million square feet with a gross asset value of $9.2 billion.
The portfolio is over 96% leased with a weighted-average remaining lease term of 6.9 years. Geographically, 81% of the straight-line rent is from North America, and 19% from Europe. The portfolio features an average annual rental increase of 1.3%, with 58% of tenants having an investment grade or implied investment grade credit rating.
Global Net Lease reported its fourth-quarter earnings for 2023 on February 27, 2024. In the fourth quarter of 2023, Global Net Lease experienced significant milestones and operational achievements. Despite challenges, the company reported robust financial metrics, including revenue of $206.7 million and net loss of $59.5 million, or $0.26 per diluted share.
Notably, net operating income (NOI) reached $169.7 million, while Core Funds from Operations (FFO) amounted to $48.3 million, or $0.21 per diluted share, and Adjusted Funds from Operations (AFFO) totaled $71.7 million, or $0.313 per diluted share.
Click here to download our most recent Sure Analysis report on Global Net Lease (GNL) (preview of page 1 of 3 shown below):
Top REIT #4: Medical Properties Trust (MPW)
- Expected Total Return: 20.0%
- Dividend Yield: 14.7%
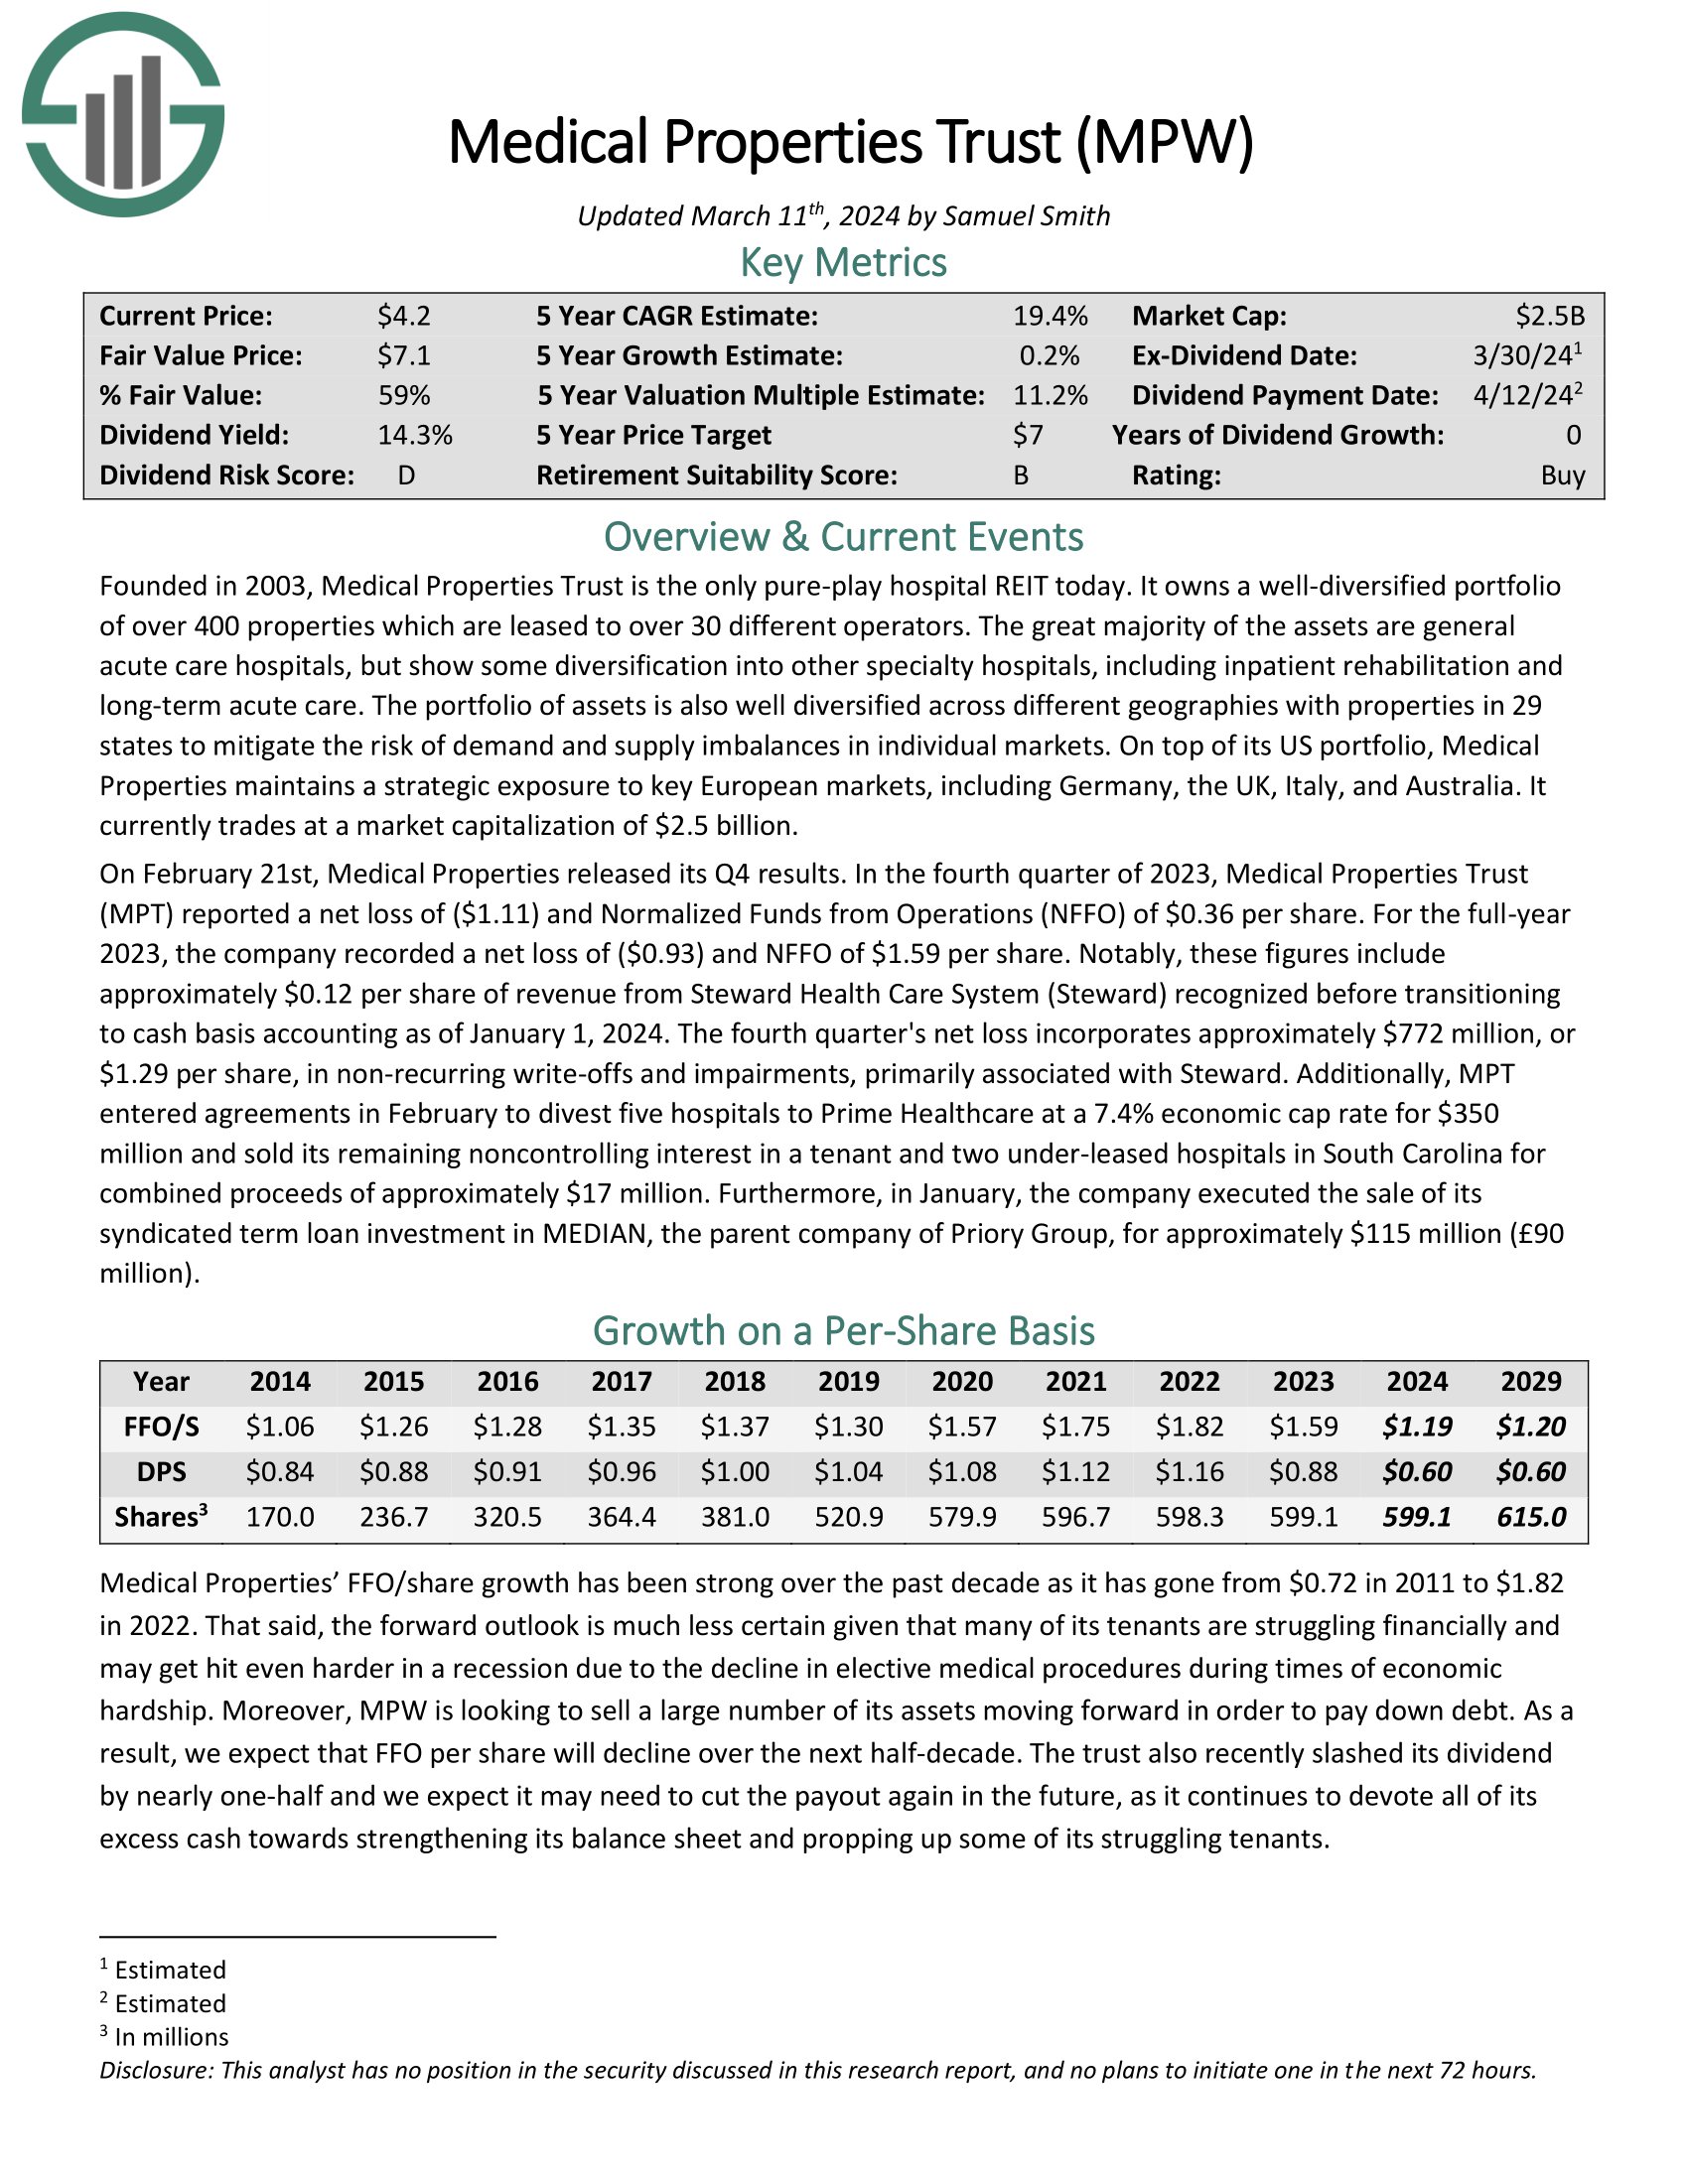
Medical Properties Trust is the only pure-play hospital REIT today. It owns a portfolio of over 400 properties which are leased to over 30 different operators. The great majority of the assets are general acute care hospitals, but show some diversification into other specialty hospitals, including inpatient rehabilitation and long-term acute care.
The portfolio of assets is also well diversified across different geographies with properties in 29 states to mitigate the risk of demand and supply imbalances in individual markets.
On February 21st, Medical Properties released its Q4 results. In the fourth quarter of 2023, Medical Properties Trust reported a net loss of ($1.11) and Normalized Funds from Operations (NFFO) of $0.36 per share. For the full-year 2023, the company recorded a net loss of ($0.93) and NFFO of $1.59 per share.
Notably, these figures include approximately $0.12 per share of revenue from Steward Health Care System (Steward) recognized before transitioning to cash basis accounting as of January 1, 2024.
Click here to download our most recent Sure Analysis report on MPW (preview of page 1 of 3 shown below):
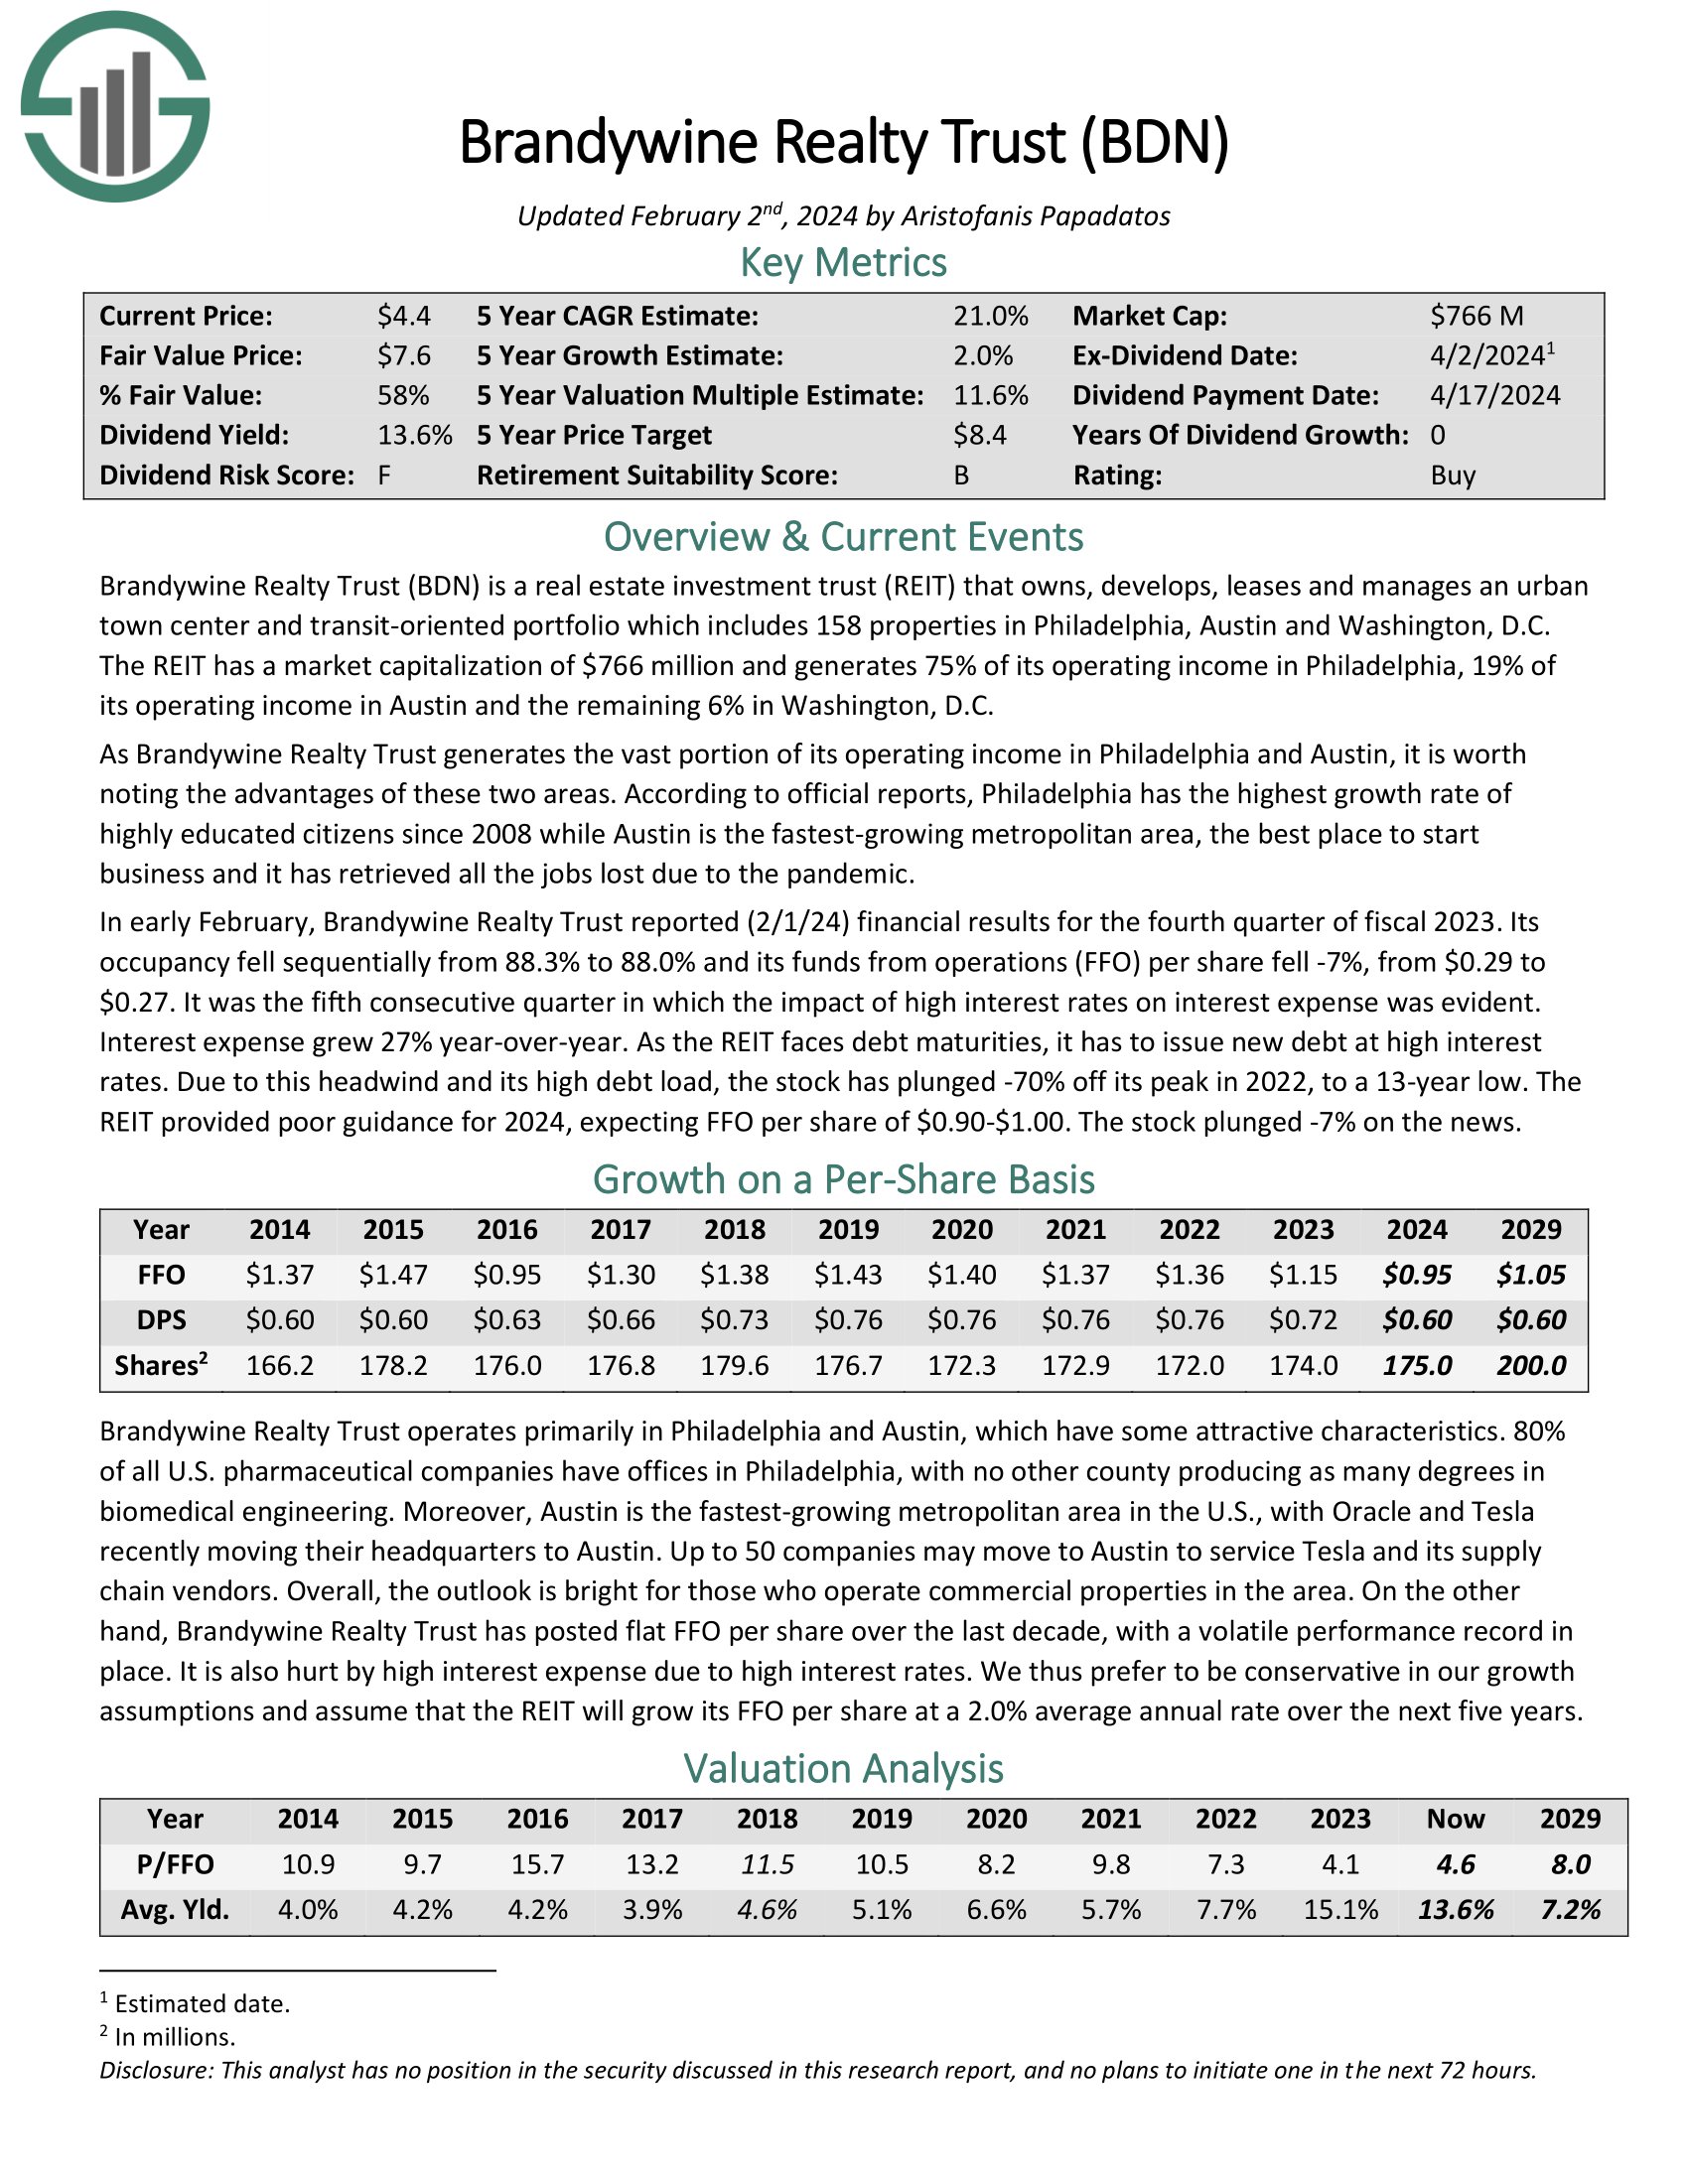
Top REIT #3: Brandywine Realty Trust (BDN)
- Expected Total Return: 20.5%
- Dividend Yield: 13.4%
Brandywine Realty owns, develops, leases and manages an urban town center and transit-oriented portfolio which includes 163 properties in Philadelphia, Austin and Washington, D.C. The REIT has a market capitalization of $1.1 billion and generates 74% of its operating income in Philadelphia, 22% of its operating income in Austin and the remaining 4% in Washington, D.C.
In early February, Brandywine Realty Trust reported (2/1/24) financial results for the fourth quarter of fiscal 2023. Its occupancy fell sequentially from 88.3% to 88.0% and its funds from operations (FFO) per share fell -7%, from $0.29 to $0.27. It was the fifth consecutive quarter in which the impact of high interest rates on interest expense was evident. Interest expense grew 27% year-over-year.
Click here to download our most recent Sure Analysis report on BDN (preview of page 1 of 3 shown below):
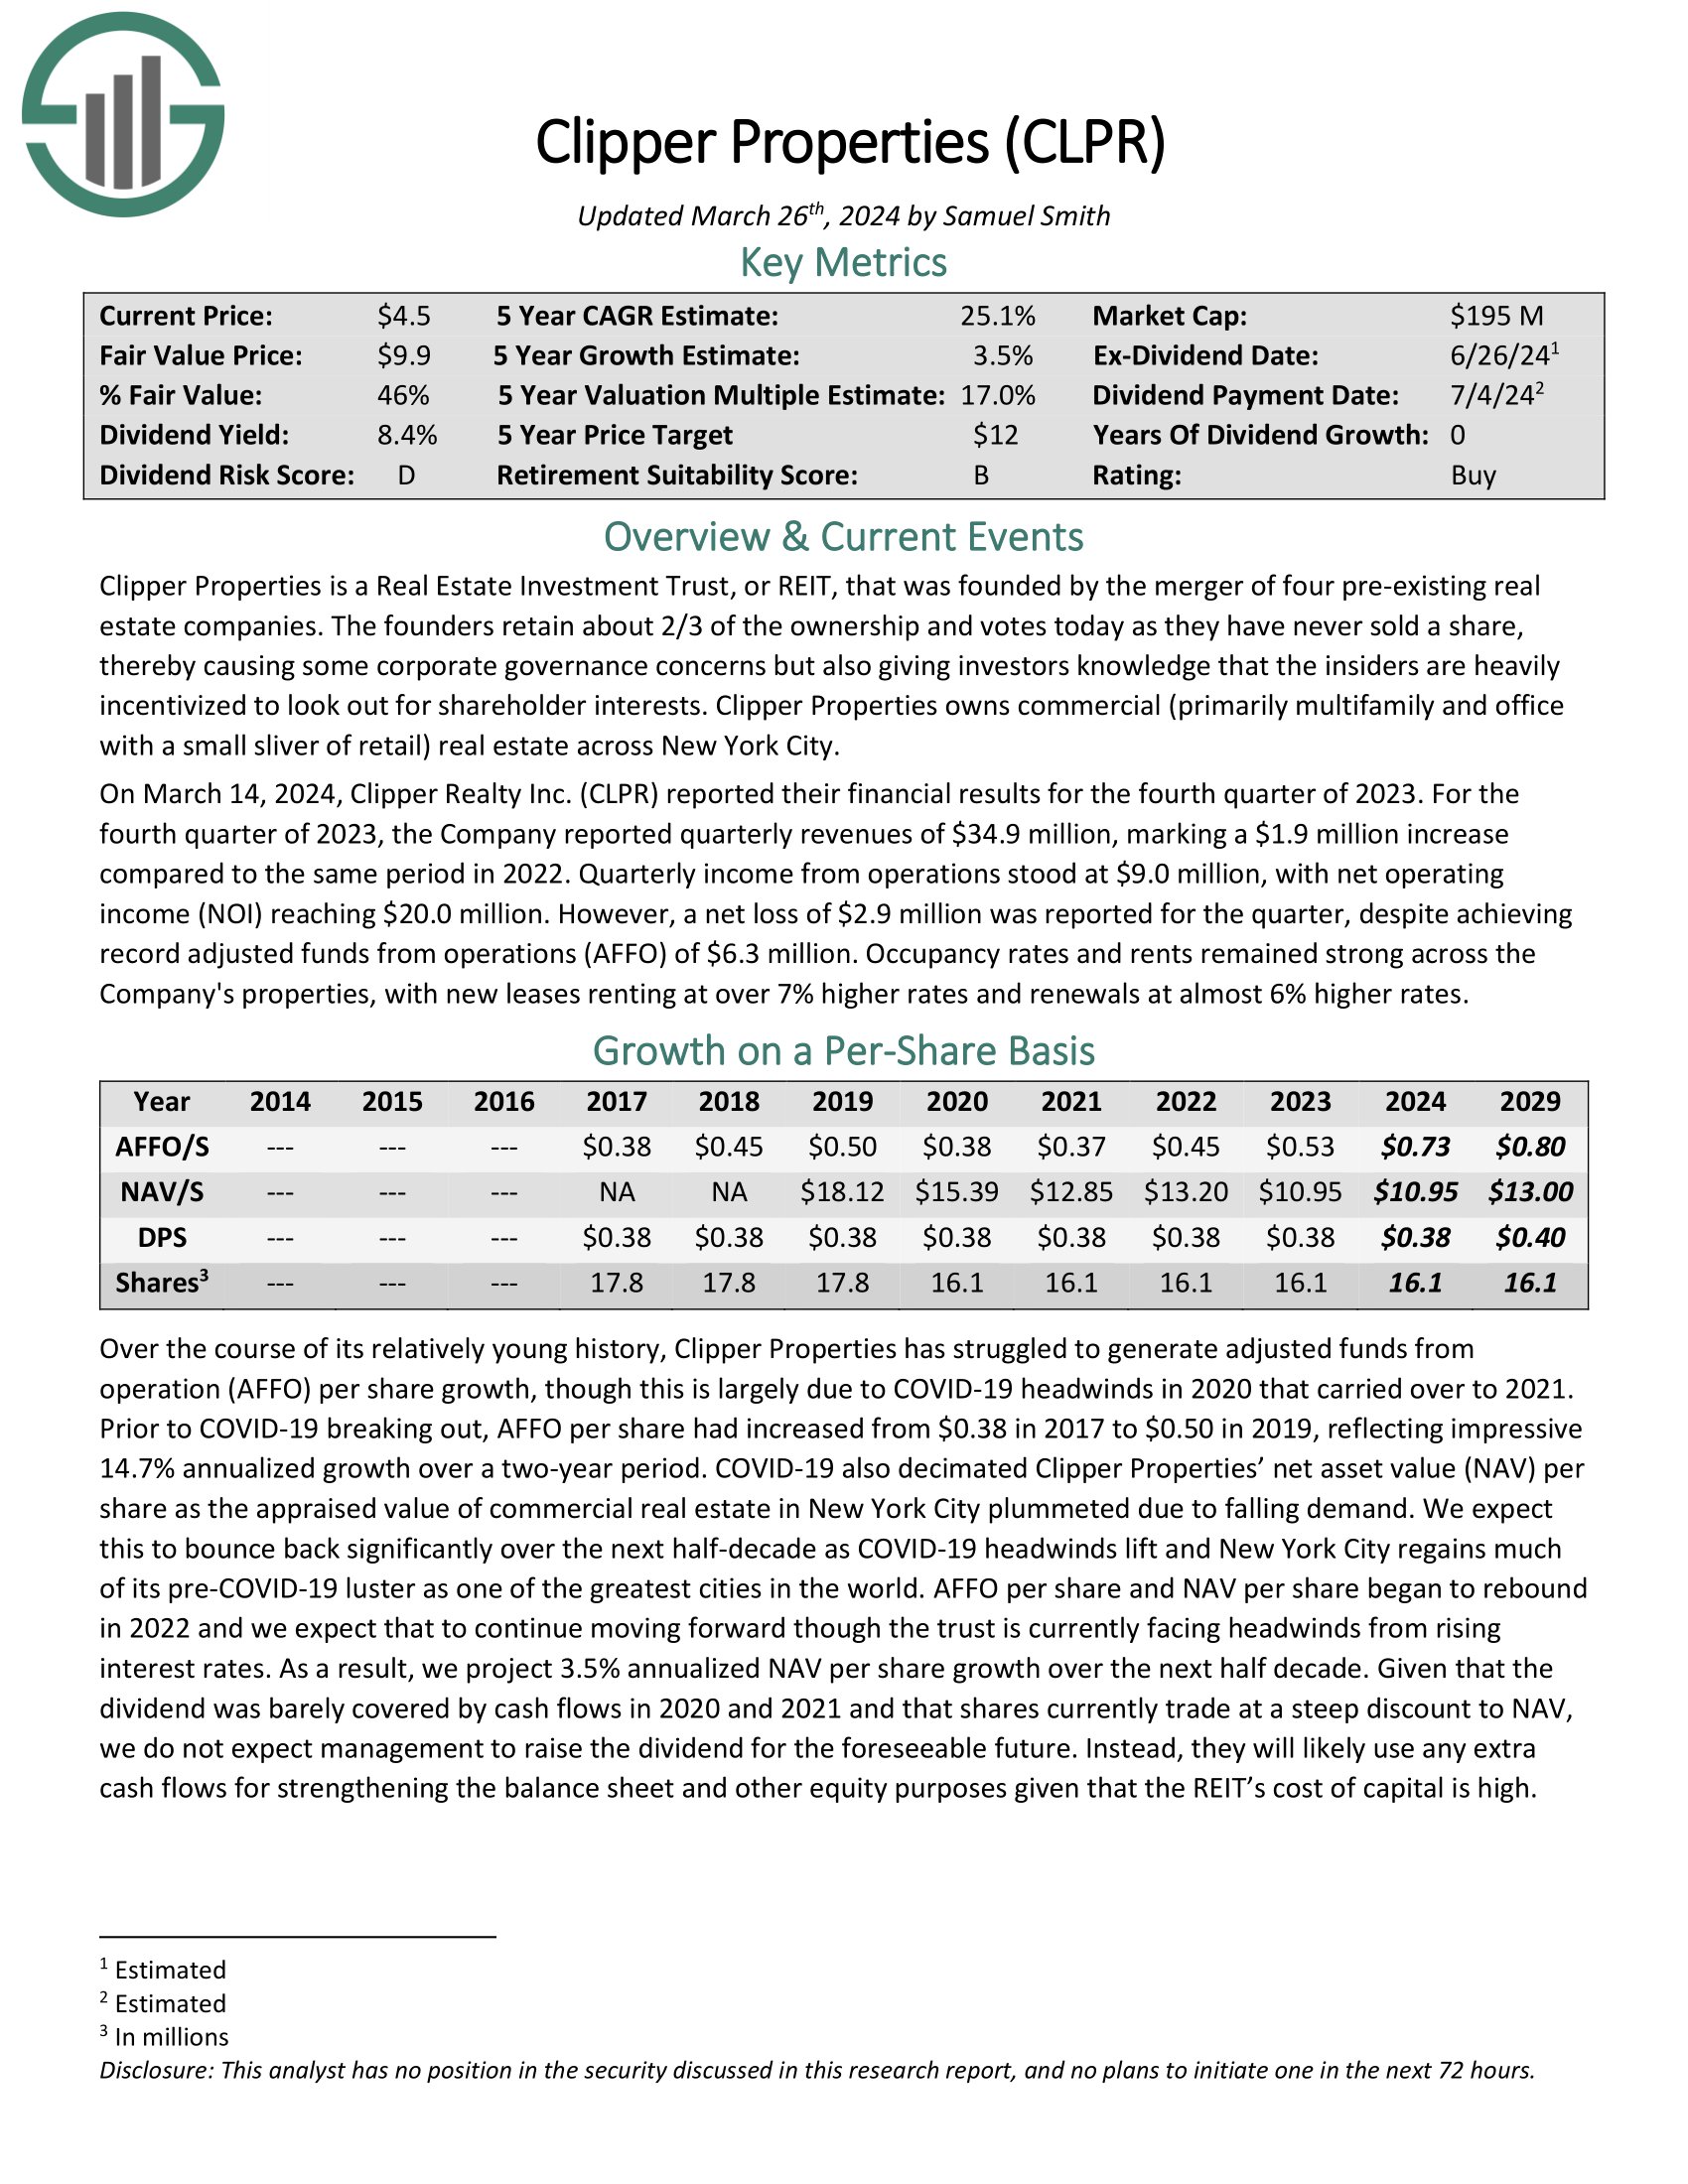
Top REIT #2: Clipper Properties (CLPR)
- Expected Total Return: 25.5%
- Dividend Yield: 8.6%
Clipper Properties owns commercial (primarily multifamily and office with a small sliver of retail) real estate across New York City.
On March 14, 2024, Clipper Realty reported their financial results for the fourth quarter of 2023. For the fourth quarter of 2023, the company reported quarterly revenues of $34.9 million, marking a $1.9 million increase compared to the same period in 2022.
Quarterly income from operations stood at $9.0 million, with net operating income (NOI) reaching $20.0 million. However, a net loss of $2.9 million was reported for the quarter, despite achieving record adjusted funds from operations (AFFO) of $6.3 million.
Click here to download our most recent Sure Analysis report on CLPR (preview of page 1 of 3 shown below):
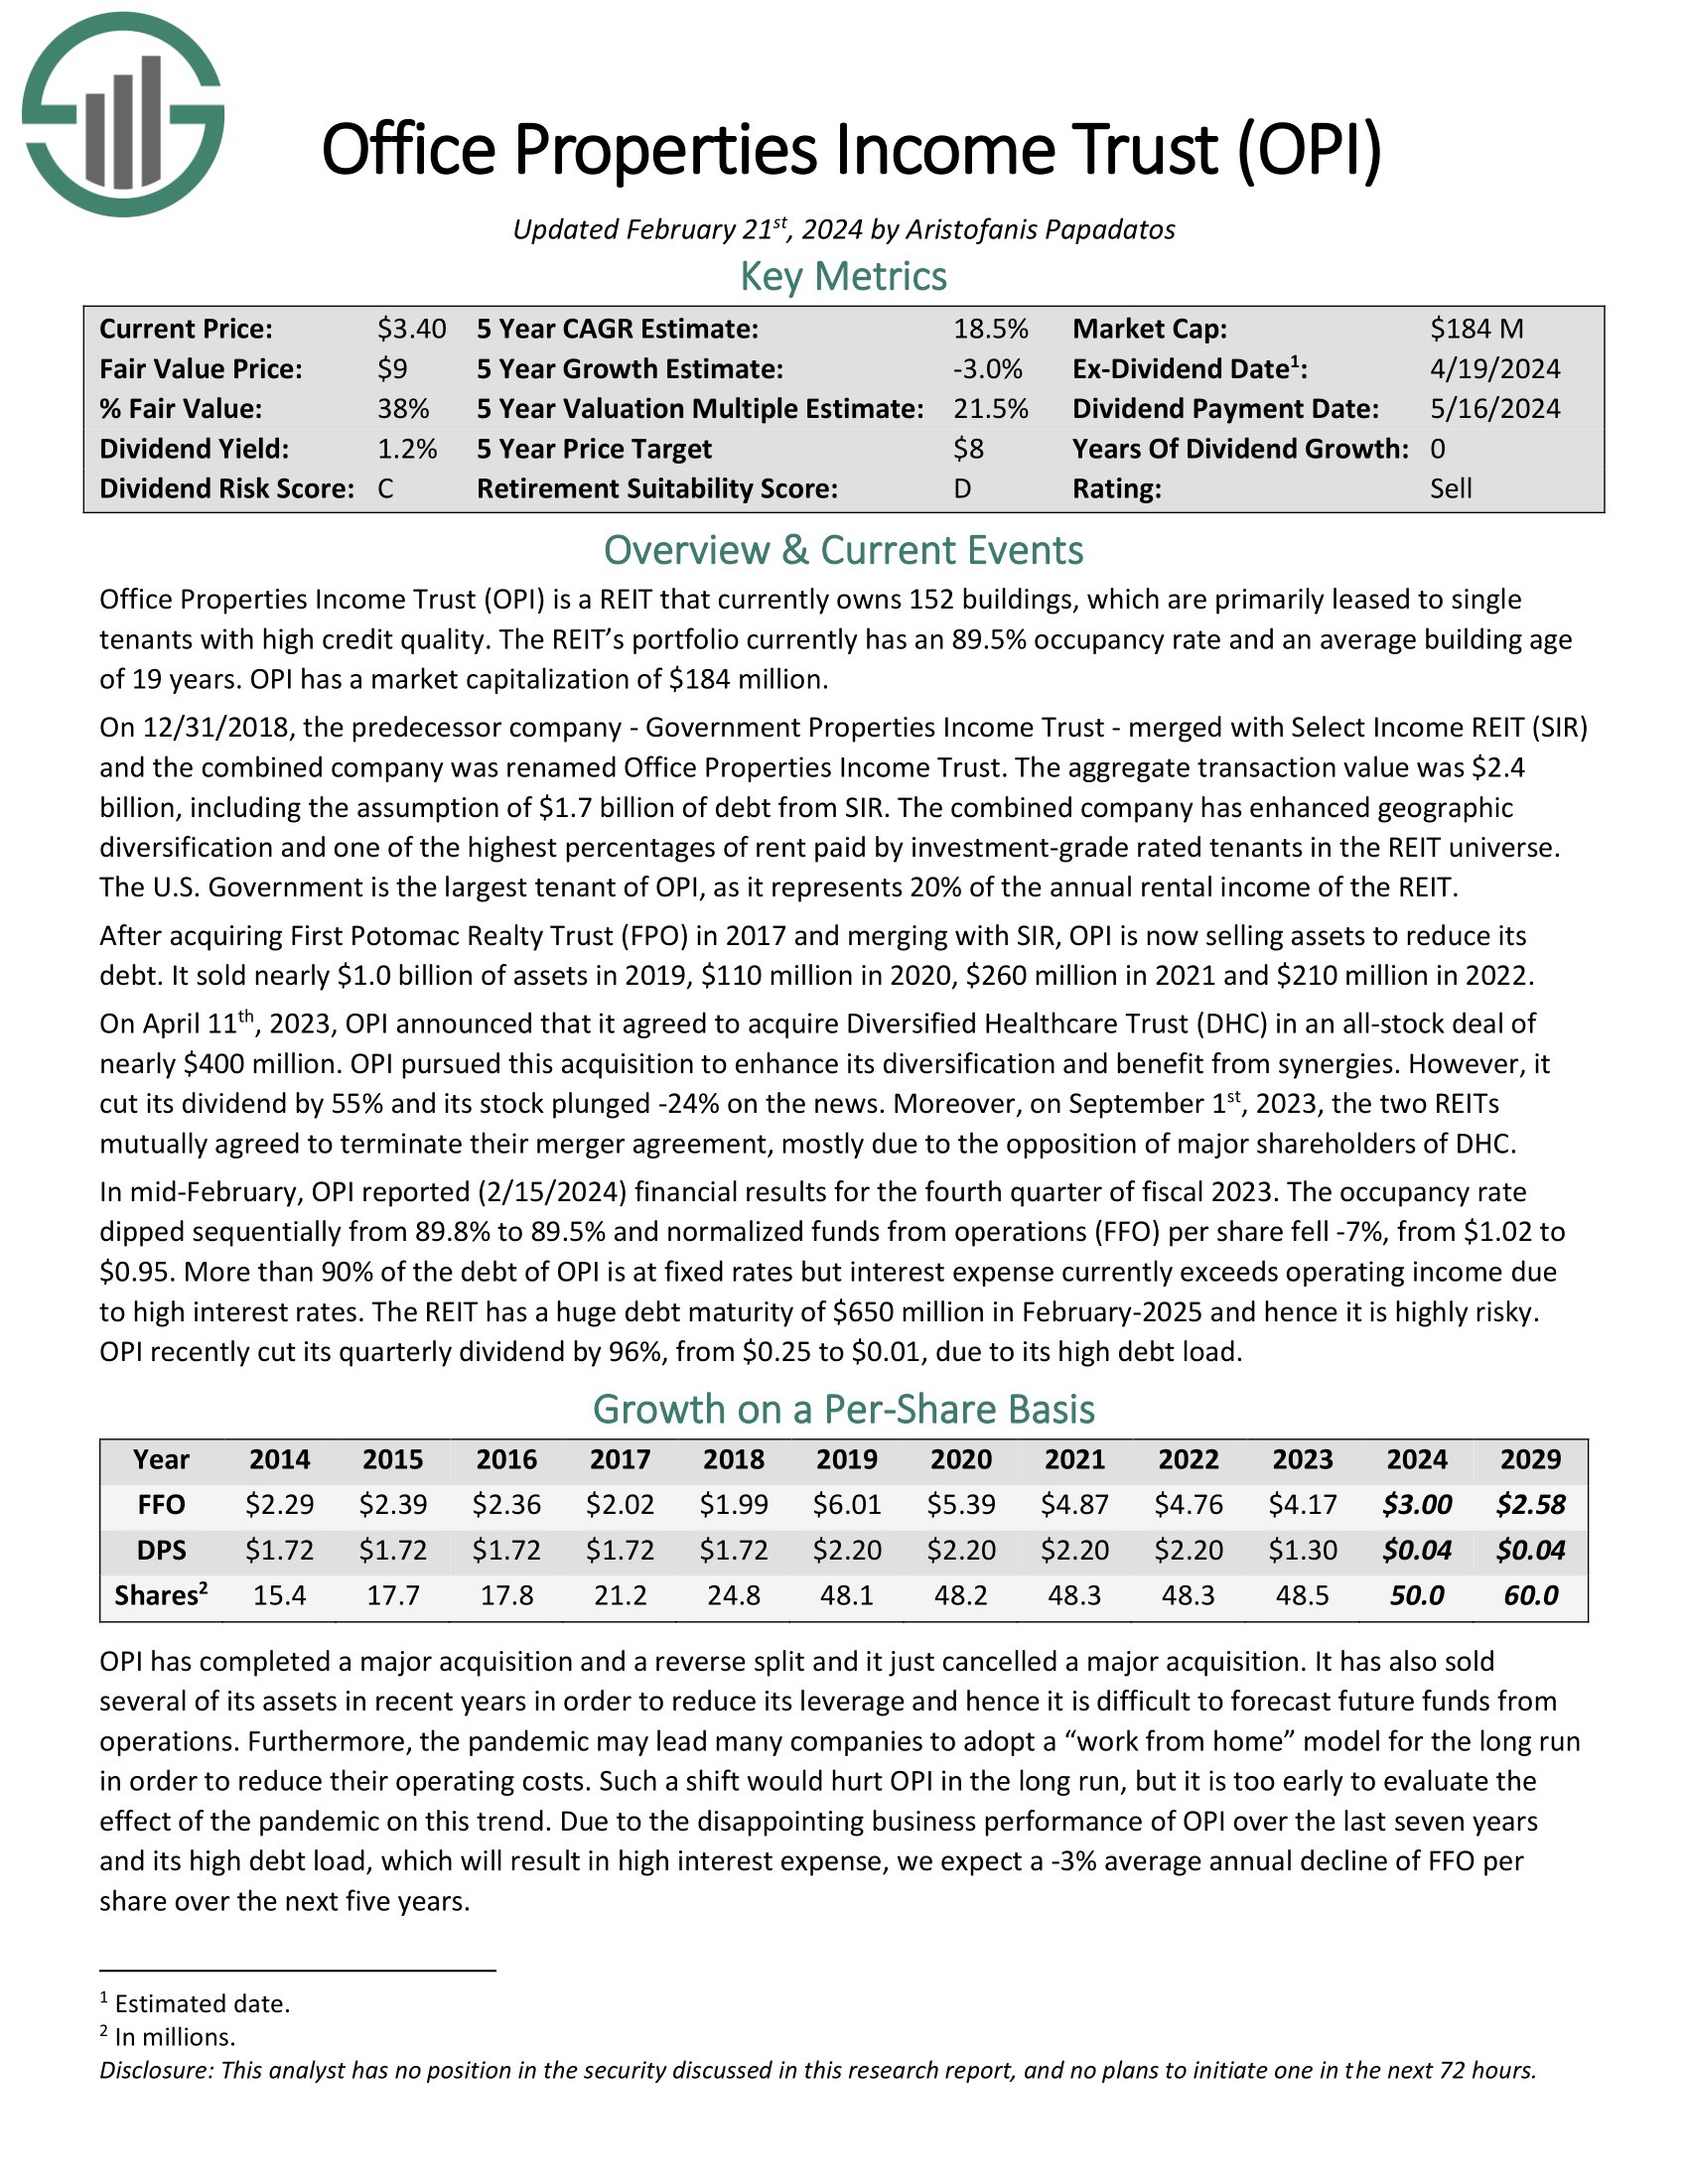
Top REIT #1: Office Properties Income Trust (OPI)
- Expected Total Return: 29.6%
- Dividend Yield: 1.8%
Office Properties Income Trust is a REIT that currently owns 157 buildings, which are primarily leased to single tenants with high credit quality. The REIT’s portfolio currently has a 90.5% occupancy rate.
In mid-February, OPI reported (2/15/2024) financial results for the fourth quarter of fiscal 2023. The occupancy rate dipped sequentially from 89.8% to 89.5% and normalized funds from operations (FFO) per share fell -7%, from $1.02 to $0.95.
More than 90% of the debt of OPI is at fixed rates but interest expense currently exceeds operating income due to high interest rates. The REIT has a huge debt maturity of $650 million in February-2025 and hence it is highly risky.
Click here to download our most recent Sure Analysis report on OPI (preview of page 1 of 3 shown below):
Final Thoughts
The REIT Spreadsheet list in this article contains a list of publicly-traded Real Estate Investment Trusts.
However, this database is certainly not the only place to find high-quality dividend stocks trading at fair or better prices.
In fact, one of the best methods to find high-quality dividend stocks is looking for stocks with long histories of steadily rising dividend payments. Companies that have increased their payouts through many market cycles are highly likely to continue doing so for a long time to come.
You can see more high-quality dividend stocks in the following Sure Dividend databases, each based on long streaks of steadily rising dividend payments:
- Dividend Kings List: Dividend Stocks With 50+ Years of Rising Dividends
- Dividend Aristocrats List: 25+ Years of Rising Dividends
- Blue Chip Stocks List: Stocks that qualify as either Dividend Achievers, Dividend Aristocrats, or Dividend Kings.
You might also be looking to create a highly customized dividend income stream to pay for life’s expenses.
The following lists provide useful information on high dividend stocks and stocks that pay monthly dividends: