Updated on December 13th, 2023 by Bob Ciura
Real estate investment trusts – or REITs, for short – give investors the opportunity to experience the economic benefits of owning real estate without any of the day-to-day hassles associated with being a traditional landlord.
For these reasons, REITs can make appealing investments for long-term investors looking to benefit from the income and appreciation of real assets.
The sheer number of REITs means that investors can also benefit from the implementation of a fundamental, bottom-up security analysis process.
With this in mind, we created a full list of over 200 REITs.
You can download your free 200+ REIT list (along with important financial metrics like dividend yields and payout ratios) by clicking on the link below:

Because there are so many REITs that currently trade on the public markets, investors have the opportunity to scan the industry and invest in only the best-of-the-best.
To do this, an investor must understand how to analyze REITs. This is not as easy as it sounds; REITs have some different accounting nuances that make them distinctly different from common stocks when it comes to assessing their investment prospects (particularly with regards to valuation).
With that in mind, this article will discuss how to assess the valuation of real estate investment trusts, including two step-by-step examples using a real, publicly-traded REIT.
What is a REIT?
Before explaining how to analyze a real estate investment trust, it is useful to understand what these investment vehicles truly are.
A REIT is not a corporation that is focused on the ownership of real estate. While real estate corporations certainly exist (the Howard Hughes Corporation (HHC) comes to mind), they are not the same as a real estate investment trust.
The difference lies in the way that these legal entities are created. REITs are trusts, not corporations. Accordingly, they are taxed differently – in a way that is more tax efficient for the REIT’s investors.
How is this so?
In exchange for meeting certain requirements that are necessary to continue doing business as a ‘REIT’, real estate investment trusts pay no tax at the organizational level. One of the most important requirements to maintain REIT status is the payment of 90%+ of its net income as distributions to its owners.
There are also other significant differences between common stocks and REITs. REITs are organized as trusts. As a result, the fractional ownership of REITs that trade on the stock exchange are not ‘stocks’ – they are ‘units’ instead. Accordingly, ‘shareholders’ are actually unit holders.
Unit holders receive distributions, not dividends. The reason why REIT distributions are not called dividends is that their tax treatments are different. REIT distributions fall into 3 categories:
- Ordinary income
- Return of capital
- Capital gains
The ‘ordinary income’ portion of a REIT distribution is the most straightforward when it comes to taxation. Ordinary income is taxed at your ordinary income tax rate; up to 37%.
The ‘return of capital’ portion of a REIT distribution can be thought of as a ‘deferred tax’. This is because a return of capital reduces your cost basis. This means that you only pay tax on the ‘return of capital’ portion of a REIT distribution when you sell the security.
The last component – capital gains – is just as it sounds. Capital gains are taxed at either short-term or long-term capital gains rate.
The percentage of distributions from these 3 sources varies by REIT. In general, ordinary income tends to be the majority of the distribution. Expect around 70% of distributions as ordinary income, 15% as a return of capital, and 15% as capital gains (although, again, this will vary depending on the REIT).
REITs are best suited for retirement accounts because the majority of their payments are taxed as ordinary income. Retirement accounts remove this negative and make REITs very tax advantageous.
This doesn’t mean you should never own a REIT in a taxable account. A good investment is a good investment, regardless of tax issues. But if you have the choice, REITs should definitely be placed in a retirement account.
So what are the impacts of the tax treatments of a REIT compared to other types of investment vehicles? In other words, how much does a REIT’s tax efficiency boost its investors’ after-tax income?
Imagine a company makes $10, pre-tax, and distributes 100% to investors. The image below shows how much of the $10 would go to investors if the company was set up in each of the three major corporate entity types (corporations, real estate investment trusts, and master limited partnerships):
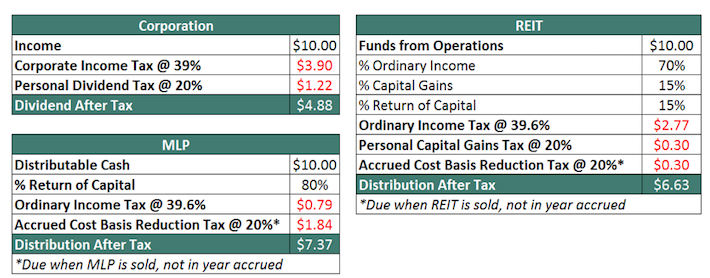
REITs are significantly more tax-efficient than corporations, primarily because they prevent double-taxation by avoiding tax at the organizational level. With that said, REITs are not quite as tax-efficient as Master Limited Partnerships.
Related: The Complete MLP List: High-Yield, Tax-Advantaged Securities
The tax-efficiency of REITs makes them appealing compared to corporations. The remainder of this article will discuss how to find the most attractive REITs based on valuation.
Non-GAAP Financial Metrics and the Two REIT Valuation Strategies
The last section of this article described what a REIT is, and why the tax efficiency of this investment vehicle make them appealing for investors. This section will describe why REITs cannot be analyzed using traditional valuation metrics, and the alternative techniques that investors can use to assess their pricing.
REITs are owners and operators of long-lived assets: investment properties.
Accordingly, depreciation is a significant expense on the income statements of these investment vehicles. While depreciation is a real expense, it is not a cash expense.
Depreciation is important because, over time, it accounts for the up-front capital expenditures needed to create value in a real asset; however, it is not an expense that should be considered for the purpose of calculating dividend safety or the probability that a REIT defaults on its debt.
Also, depreciation can vary over time. In a conventional straight-line depreciation scheme, more depreciation is recorded (on an absolute dollar basis) at the beginning of an asset’s useful life. The fluctuations in depreciation expense over time means that assessing the valuation of a REIT using net income (as the traditional price-to-earnings ratio does) is not a meaningful strategy.
So how should an intelligent security analyst account for the real economic earnings of a REIT?
There are two main alternatives to traditional valuation techniques. One assesses REIT valuation based on economic earnings power, and the other assesses REIT valuation based on income generation capabilities. Each will be discussed in detail below.
Instead of using the traditional ratio of price and value (the price-to-earnings ratio), REIT analysts often use a slightly different variation: the price-to-FFO ratio (or P/FFO ratio).
The ‘FFO’ in the price-to-FFO ratios stands for funds from operations, which is a non-GAAP financial metric that backs out the REIT’s non-cash depreciation and amortization charges to give a better sense of the REIT’s cash earnings.
FFO has a widely-accepted definition that is set by the National Association of Real Estate Investment Trusts (NAREIT), which is listed below:
“Funds From Operations: Net income before gains or losses from the sale or disposal of real estate, real estate related impairment charges, real estate related depreciation, amortization and accretion and dividends on preferred stock, and including adjustments for (i) unconsolidated affiliates and (ii) noncontrolling interests.”
The calculation for the price-to-FFO ratio is very similar to the calculation of the price-to-earnings ratio. Instead of dividing stock price by earnings-per-share, we dividend REIT unit price by FFO-per-share. For more details, see the example in the next section.
The other method for assessing the valuation of a REIT does not use a Non-GAAP financial metric. Instead, this second strategy compares a REIT’s current dividend yield to its long-term average dividend yield.
If a REIT’s dividend yield is above its long-term average, then the trust is undervalued; conversely, if a REIT’s dividend yield is below its long-term average, the trust is overvalued. For more details on this second valuation technique, see the second example later in this article.
Now that we have a high-level explanation of the two valuation techniques available to REIT investors, the next two sections will provide detailed examples on how to calculate valuation metrics relative to these unique legal entities.
Example #1: Realty Income P/FFO Valuation Analysis
This section will serve as a step-by-step guide for assessing the valuation of REITs using the price-to-FFO ratio. For the purpose of this example, we will use real-world publicly-traded REIT to make the example as useful as possible.
More specifically, Realty Income (O) is the security that will be used in this example. It is one of the largest and most well-known REITs among the dividend growth investor community, which is due in part to its payment of monthly dividends.
Monthly dividends are superior to quarterly dividends for investors that rely on their dividend income to pay for life’s expenses. However, monthly dividends are quite rare.
For this reason, we created a list of 80 monthly dividend stocks. You can see our monthly dividend stocks list here.
Just as with stocks, REIT investors have to choose whether they’d like to use forward (forecasted) funds from operations or historical (last fiscal year’s) funds from operations when calculating the P/FFO ratio.
To find the funds from operations reported in the last fiscal year, investors need to identify the company’s press release announcing the publication of this financial data.
Note: Adjusted FFO is superior to ‘regular’ FFO because it ignores one-time accounting charges (usually from acquisitions, asset sales, or other non-repeated activities) that will artificially inflate or reduce a company’s observed financial performance.
Alternatively, an investor could also use forward-looking expected adjusted funds from operations for the upcoming year. For example, we expect Realty Income to generate adjusted FFO-per-share of $4.00 in 2023. The stock currently trades for a share price of $55, which equals a P/FFO ratio of 13.7.
So how do investors determine whether Realty Income is an attractive buy today after calculating its price-to-FFO ratio?
There are two comparisons that investors should make.
First, investors should compare Realty Income’s current P/FFO ratio to its long-term historical average. If the current P/FFO ratio is elevated, the trust is likely overvalued; conversely, if the current P/FFO ratio is lower than normal, the trust is an attractive buy.
In the past 10 years, Realty Income stock traded for an average P/FFO ratio of approximately 19, indicating that shares appear somewhat undervalued today.
The second comparison that investors should make is relative to Realty Income’s peer group. This is important: if Realty Income’s valuation is attractive relative to its long-term historical average, but the stock is still trading at a significant premium to other, similar REITs, then the security is probably not a timely investment.
One of the difficult parts of a peer-to-peer valuation comparison is identifying a reasonable peer group.
Fortunately, large publicly-traded companies must self-identify a peer group in their annual proxy filing with the U.S. Securities & Exchange Commission. This filing, which shows as a DEF 14A on the SEC’s EDGAR search database, contains a table similar to the one below:
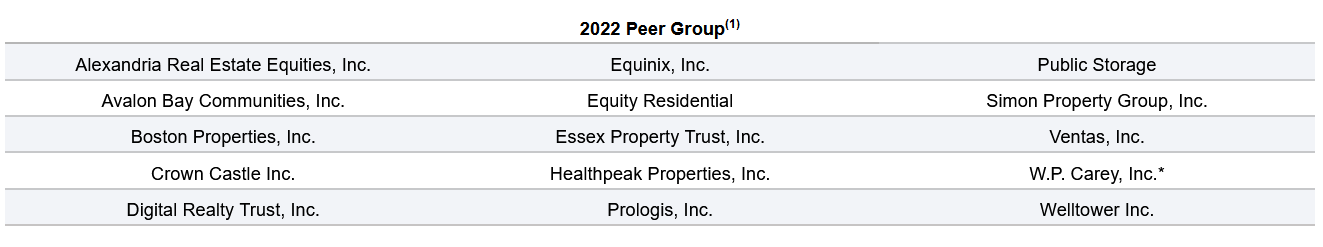
Source: Realty Income 2023 Definitive Proxy Statement
Every publicly-traded company must disclose a similar peer group in this proxy filing, which is tremendously helpful when an investor wants to compare a business’ valuation to that of its peers.
Example #2: Realty Income Dividend Yield Valuation Analysis
As discussed previously, the other method for determining whether a REIT is trading at an attractive valuation is using its dividend yield. This section will provide a step-by-step guide for using this technique to assess the valuation of REITs.
At the time of this writing, Realty Income pays an annual dividend income of $3.07 per unit. The company’s current unit price of $55 means the stock has a dividend yield of 5.6%.
Realty Income’s 10-year average dividend yield is 4.4%. Again, Realty Income’s higher-than-average dividend yield indicates shares are undervalued right now.
Since the trust’s dividend yield is higher than its long-term average, it appears that today’s price is an attractive opportunity to add to or initiate a stake in this REIT. A peer group analysis would likely yield a similar result, as most REITs in its peer group have yields exceeding 4%. Instructions for identifying a reasonable peer group for any public company can be found in the previous section of this article.
The dividend yield valuation technique for real estate investment trusts may not be as robust as a bottom-up analysis using funds from operations.
However, this technique has two main advantages:
- It is quicker. Dividend yields are available on most Internet stock screeners, while some lack the capability to filter for stocks trading at low multiples of funds from operations.
- It can be generalized to other asset classes. While REITs (and some MLPs) are the only security types that report FFO, it is clear that every dividend-paying investment has a dividend yield. This makes the dividend yield valuation technique an appropriate method for valuing REITs, MLPs, BDCs, and even corporations (although the P/E ratio is still the best method for corporations).
Final Thoughts
Without a doubt, there are certainly advantages to investing in real estate investment trusts.
These securities allow investors to benefit from the economic upside of owning real estate while also enjoying a completely passive investment opportunity. Moreover, REITs are very tax-advantageous and usually offer higher dividend yields than the average dividend yield of S&P 500 securities.
REITs also have analytical nuances that make them more difficult to analyze than corporations. This is particularly true when it comes to assessing their valuations.
This article provided two analytical techniques that can be applied to REIT valuation:
- The P/FFO ratio
- The dividend yield valuation technique
Each has its benefits and should be included in the toolkit of any dividend growth investor whose investment universe includes real estate trusts.
You can see more high-quality dividend stocks in the following Sure Dividend databases, each based on long streaks of steadily rising dividend payments:
- Dividend Kings List: Dividend Stocks With 50+ Years of Rising Dividends
- The Highest Yielding Dividend Kings List: The 20 Dividend Kings with the highest current yields.
- Dividend Aristocrats List: S&P 500 Index stocks with 25+ years of rising dividends
- Blue Chip Stocks List: Stocks that qualify as either Dividend Achievers, Dividend Aristocrats, or Dividend Kings.
- Dividend Champions List: 25+ years of rising dividends, that do not qualify as Dividend Aristocrats
- The 20 Highest Yielding Monthly Dividend Stocks
- The Dividend Champions List: stocks that have increased their dividends for 25+ consecutive years.
Note: Not all Dividend Champions are Dividend Aristocrats because Dividend Aristocrats have additional requirements like being in The S&P 500. - The Best DRIP Stocks: The top 15 Dividend Aristocrats with no-fee dividend reinvestment plans.
The major domestic stock market indices are another solid resource for finding investment ideas. Sure Dividend compiles the following stock market databases and updates them monthly: