Updated on March 29th, 2024 by Bob Ciura
Long histories of dividend growth are not typical in the energy sector. The oil and gas industry is highly cyclical, preventing the vast majority of companies from raising their dividends yearly without interruption.
When oil and gas prices are high, energy companies enjoy a windfall that flows through to investors. But when commodity prices decline, profits evaporate, and in some cases, dividends as well.
As a result, there are just two oil stocks on the list of Dividend Aristocrats. One of them, Exxon Mobil (XOM), is the largest oil company in the U.S.
You can download the full list of all 68 Dividend Aristocrats, with important metrics like dividend yield and price-to-earnings ratios, by clicking on the link below:
Disclaimer: Sure Dividend is not affiliated with S&P Global in any way. S&P Global owns and maintains The Dividend Aristocrats Index. The information in this article and downloadable spreadsheet is based on Sure Dividend’s own review, summary, and analysis of the S&P 500 Dividend Aristocrats ETF (NOBL) and other sources, and is meant to help individual investors better understand this ETF and the index upon which it is based. None of the information in this article or spreadsheet is official data from S&P Global. Consult S&P Global for official information.
Oil and gas can be a “boom-and-bust” industry. Profits are highly dependent upon commodity prices, which can fluctuate wildly in any given year depending upon supply and demand forces.
But Exxon Mobil is different. It traces its roots to Standard Oil, which was founded by John D. Rockefeller all the way back in 1870.
This article will provide an in-depth look at the founder of Big Oil and a Dividend Aristocrat, Exxon Mobil.
Business Overview
Standard Oil dominated the U.S. oil and gas industry in its early days. It did this with a laser-like focus on drilling innovation, production growth, and limiting costs to beat its competitors. Standard Oil was almost too successful—it grew rapidly that in 1911, it was dissolved by the U.S. Supreme Court on antitrust grounds.
Standard Oil was broken up into 33 smaller companies, many of which became giants on their own, such as Chevron (CVX).
Exxon Mobil operates in three business segments. The Upstream segment includes oil and gas exploration and production. Downstream activities include refining and marketing. Manufactured chemicals include olefins, aromatics, polyethylene, and polypropylene plastics.
Exxon Mobil is one of the largest energy stocks in the world. In early February, Exxon reported (2/2/24) financial results for the fourth quarter of fiscal 2023.
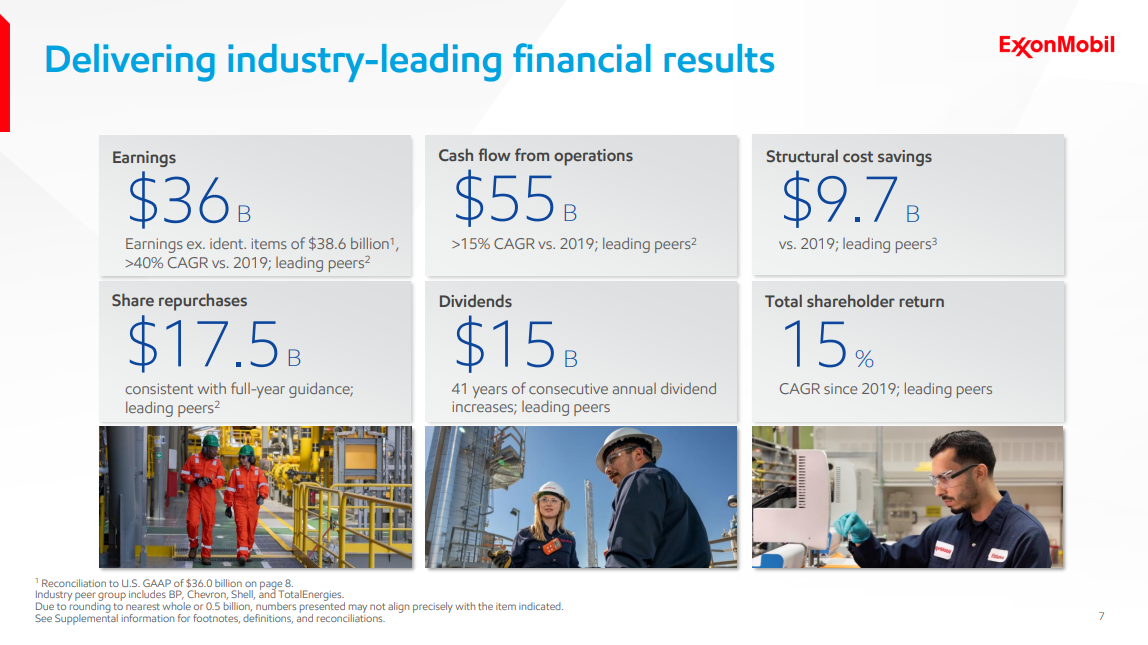
Source: Investor Presentation
Thanks to a slight improvement in oil prices, which resulted from production cuts of OPEC and Russia, Exxon grew its earnings-per-share sequentially 9%, from $2.27 to $2.48.
The prices of oil and gas have incurred a correction off their peak, but they remain elevated. As a result, Exxon Mobil could still achieve earnings per share of about $8.40 this year.
Growth Prospects
The climate for oil and gas majors remains challenged because oil prices are still down by nearly half from the peak levels of 2014. As a result, oil producers cannot rely on rising prices for revenue and earnings growth. Instead, rising production will be key. Thanks to its promising growth projects, Exxon expects to grow its production from about 4.0 to 5.0 million barrels per day by 2025.
The Permian will be a major growth driver. In 2023 Exxon agreed to acquire Pioneer Natural Resources (PXD) for $60 billion in an all-stock deal. As Pioneer is the largest oil producer in Permian, Exxon expects to more than double its Permian output, to 2.0 million barrels per day in 2027.
Exxon Mobil expects to achieve such a great performance primarily thanks to a steep reduction in its average cost of production, which will result from the addition of low-cost barrels in its asset portfolio. The other growth contributors will be a reduction in structural costs as well as meaningful production growth.
Guyana, one of the most exciting growth projects in the energy sector, will be a major growth driver of Exxon. During the last five years, Exxon Mobil has more than tripled its estimated reserves in the area, from 3.2 billion barrels to about 11.0 billion barrels.
Notably, about 90% of the investments of Exxon Mobil will be directed to reserves that are expected to yield an annual return in excess of 10% even at oil prices of around $35. This means that the oil giant will high-grade its asset portfolio drastically in the upcoming years.
The EPS growth plan of Exxon Mobil also includes a share repurchase program of up to $35 billion in 2023-2024. This amount is sufficient at the current stock price to reduce the share count by ~7%.
Nevertheless, given the high cyclicality of this business, it is reasonable to expect a -4% average annual decline of earnings per share over the next five years off the record-high comparison base.
Competitive Advantages & Recession Performance
Exxon Mobil enjoys several competitive advantages, primarily its tremendous scale, which provides the ability to cut costs when times are tough. The company is also the global leader in expertise in its business, as most oil companies follow the technical procedures that Exxon Mobil has written.
Exxon Mobil also has the financial strength to invest heavily in new growth opportunities. The company has allocated tens of billions of dollars in the past few years on capital expenditures to support future growth.
Another competitive advantage is Exxon Mobil’s industry-leading balance sheet. It has a credit rating of AA-, which helps it keep a low cost of capital.
Exxon Mobil’s integrated business model allows the company to remain profitable, even during recessions and periods of low commodity prices. The company saw volatility during the Great Recession but still remained profitable:
- 2007 earnings-per-share of $7.26
- 2008 earnings-per-share of $8.66 (19% increase)
- 2009 earnings-per-share of $3.98 (54% decline)
- 2010 earnings-per-share of $6.22 (56% increase)
Continuing to generate steady profits allowed Exxon Mobil to raise its dividend yearly. The oil major has raised its dividend for 41 consecutive years.
Valuation & Expected Returns
Exxon’s industry is highly cyclical. Commodity prices drive results, and hence they are highly volatile. We believe that the energy market is now near the peak of its cycle and expect oil and gas prices to deflate in the upcoming years, primarily due to the record number of clean energy projects that are under development right now.
We expect Exxon Mobil to earn about $8.40 per share in 2024 and incur a -4.0% average annual decline of earnings per share over the next five years.
The stock is currently trading at a price-to-earnings ratio of 13.8. This is slightly higher than our fair value estimate of 13 times earnings. A declining earnings multiple could reduce annual returns by 1.2% over the next five years.
Dividends will add to shareholder returns. Exxon Mobil has grown its dividend for 41 consecutive years and currently offers a 3.2% yield. Given all the above factors, Exxon Mobil stock can be reasonably expected to offer a -2% average annual total return over the next five years.
The poor expected return should be expected, given that we are near the peak of the cycle of this highly cyclical industry. We recommend selling Exxon at its current price. The dividend yield of the stock is also near a decade low, another possible signal that the stock is overvalued from a long-term perspective.
Final Thoughts
Exxon Mobil posted record earnings last year thanks to exceptionally favorable global oil and gas conditions. Even better, as these conditions are not likely to change significantly soon, the oil major is expected to continue thriving in the upcoming quarters.
Nevertheless, due to the high cyclicality of this industry and the elevated valuation, XOM stock is unattractive from a long-term perspective.
Further Reading: The Chowder Rule | How To Calculate The Chowder Number.
Additionally, the following Sure Dividend databases contain the most reliable dividend growers in our investment universe:
- The Dividend Contenders List: 10-24 consecutive years of dividend increases.
- The Dividend Challengers List: 5-9 consecutive years of dividend increases.
- The Dividend Champions: Dividend stocks with 25+ years of dividend increases, including those that may not qualify as Dividend Aristocrats.
- The Dividend Achievers: dividend stocks with 10+ years of consecutive dividend increases.
- The Dividend Kings: considered to be the ultimate dividend growth stocks, the Dividend Kings list is comprised of stocks with 50+ years of consecutive dividend increases
If you’re looking for stocks with unique dividend characteristics, consider the following Sure Dividend databases:
- The Complete List of Monthly Dividend Stocks: stocks that pay dividends each month, for 12 payments over the year.
- The Blue Chip Stocks List: this database contains stocks that qualify as either Dividend Achievers, Dividend Aristocrats, or Dividend Kings.
The major domestic stock market indices are another solid resource for finding investment ideas. Sure Dividend compiles the following stock market databases and updates them monthly: