Updated on September 3rd, 2024 by Bob Ciura
Spreadsheet data updated daily
The Dividend Kings are the best-of-the-best in dividend longevity.
What is a Dividend King? A stock with 50 or more consecutive years of dividend increases.
The downloadable Dividend Kings Spreadsheet List below contains the following for each stock in the index among other important investing metrics:
- Payout ratio
- Dividend yield
- Price-to-earnings ratio
You can see the full downloadable spreadsheet of all 53 Dividend Kings (along with important financial metrics such as dividend yields, payout ratios, and price-to-earnings ratios) by clicking on the link below:
The Dividend Kings list includes recent additions such as Consolidated Edison (ED), Kenvue (KVUE), and Fortis (FTS).
Each Dividend King satisfies the primary requirement to be a Dividend Aristocrat (25 years of consecutive dividend increases) twice over.
Not all Dividend Kings are Dividend Aristocrats.
This unexpected result is because the ‘only’ requirement to be a Dividend Kings is 50+ years of rising dividends.
On the other hand, Dividend Aristocrats must have 25+ years of rising dividends, be a member of the S&P 500 Index, and meet certain minimum size and liquidity requirements.
Table of Contents
- How To Use The Dividend Kings List To Find Dividend Stock Ideas
- The 5 Best Dividend Kings Today
#5: Target Corporation (TGT)
#4: Sysco Corporation (SYY)
#3: PPG Industries (PPG)
#2: SJW Group (SJW
#1: Farmers & Merchants Bancorp (FMCB) - Performance Of The Dividend Kings
- Sector & Market Capitalization Overview
- Final Thoughts
How To Use The Dividend Kings List to Find Dividend Stock Ideas
The Dividend Kings list is a great place to find dividend stock ideas. However, not all the stocks in the Dividend Kings list make a great investment at any given time.
Some stocks might be overvalued. Conversely, some might be undervalued – making great long-term holdings for dividend growth investors.
For those unfamiliar with Microsoft Excel, the following walk-through shows how to filter the Dividend Kings list for the stocks with the most attractive valuation based on the price-to-earnings ratio.
Step 1: Download the Dividend Kings Excel Spreadsheet.
Step 2: Follow the steps in the instructional video below. Note that we screen for price-to-earnings ratios of 15 or below in the video. You can choose any threshold that best defines ‘value’ for you.
Alternatively, following the instructions above and filtering for higher dividend yield Dividend Kings (yields of 2% or 3% or higher) will show stocks with 50+ years of rising dividends and above-average dividend yields.
Looking for businesses that have a long history of dividend increases isn’t a perfect way to identify stocks that will increase their dividends every year in the future, but there is considerable consistency in the Dividend Kings.
The 5 Best Dividend Kings Today
The following 5 stocks are our top-ranked Dividend Kings today, based on expected annual returns over the next 5 years. Stocks are ranked in order of lowest to highest expected annual returns.
Total returns include a combination of future earnings-per-share growth, dividends, and any changes in the P/E multiple.
Dividend King #5: Target Corporation (TGT)
- 5-Year Annual Expected Returns: 12.4%
Target was founded in 1902 and now operates about 1,850 big box stores, which offer general merchandise and food, as well as serving as distribution points for the company’s e-commerce business.
Target posted second quarter earnings on August 21st, 2024, and results were quite strong, sending the stock jumping after the report. Adjusted earnings-per-share came to $2.57, which was 39 cents ahead of estimates. Revenue was up 2.7% year-over-year to $25.45 billion, which beat by $240 million.
Comparable sales were up 2% year-over-year, making up most of the total sales gain. Consensus was for a gain of 1.1%. Traffic was up 3% year-over-year with all six core merchandising categories seeing positive growth. Digital comparable sales were up 8.7%, once again driving growth.
Target has grown its dividend for more than five decades, making it a Dividend King. The company is investing heavily in its business in order to navigate through the changing landscape in the retail sector. The payout is now 47% of earnings for this year,
Click here to download our most recent Sure Analysis report on TGT (preview of page 1 of 3 shown below):

Dividend King #4: Sysco Corporation (SYY)
- 5-Year Annual Expected Returns: 12.7%
Sysco Corporation is the largest wholesale food distributor in the United States. The company serves 600,000 locations with food delivery, including restaurants, hospitals, schools, hotels, and other facilities.
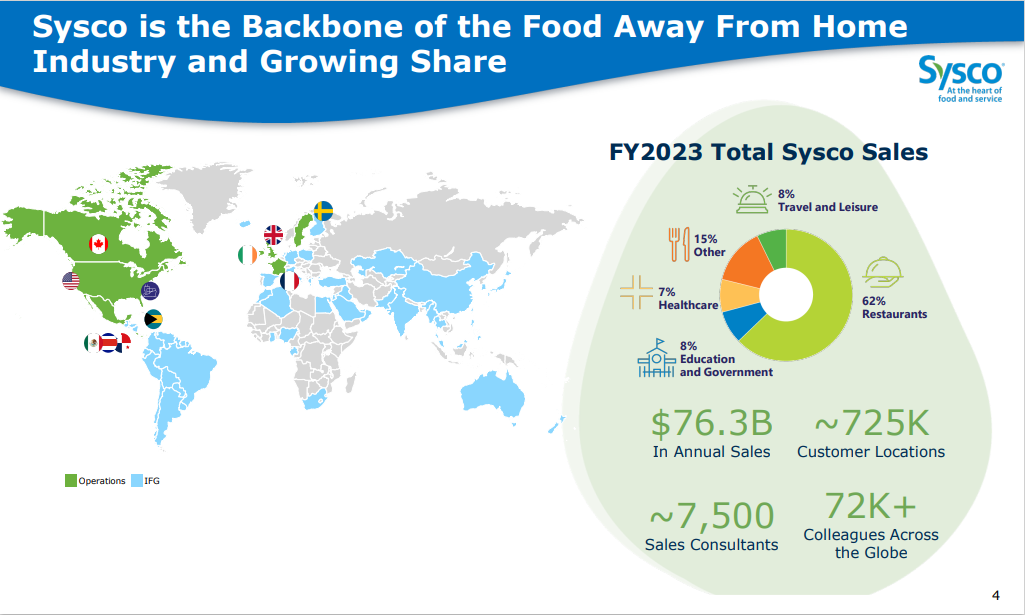
Source: Investor Presentation
On July 30th, 2024, Sysco reported fourth-quarter results for Fiscal Year (FY) 2024. For the fourth quarter, the company saw a 4.2% increase in sales and a 3.5% rise in U.S. Foodservice volume.
Gross profit grew by 4.2% to $3.8 billion, and operating income increased by 1.2% to $977 million, with adjusted operating income climbing 6.4% to $1.1 billion.
However, EBITDA decreased by 7.7% to $1.2 billion, while adjusted EBITDA went up by 5.4% to $1.3 billion. Earnings per share (EPS) fell by 14.6% to $1.23, whereas adjusted EPS rose by 3.7% to $1.39.
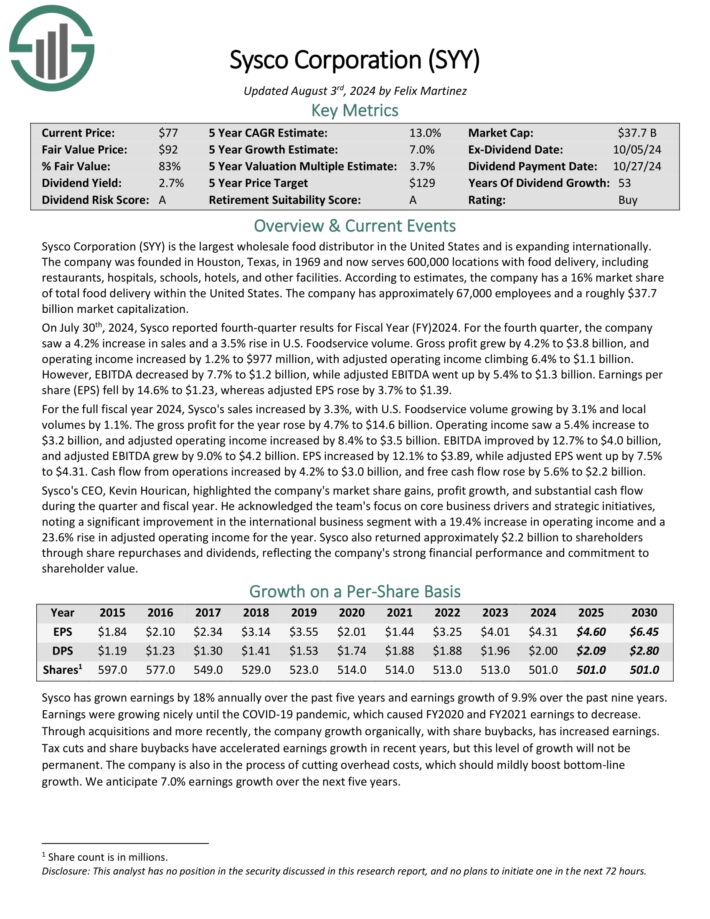
Click here to download our most recent Sure Analysis report on SYY (preview of page 1 of 3 shown below):
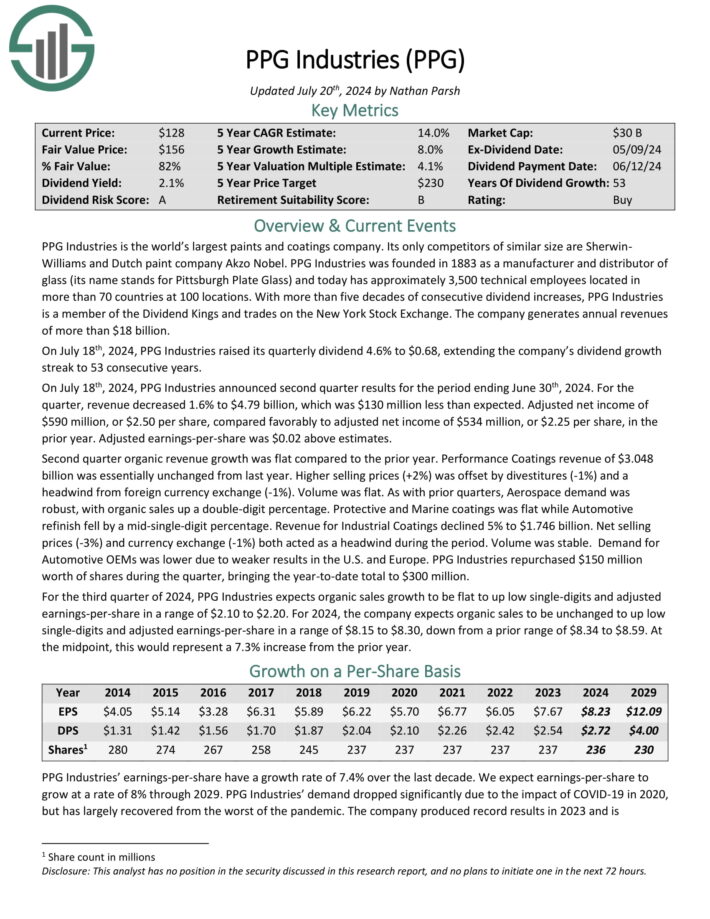
Dividend King #3: PPG Industries (PPG)
- 5-Year Annual Expected Returns: 13.7%
PPG Industries is the world’s largest paints and coatings company. Its only competitors of similar size are Sherwin-Williams and Dutch paint company Akzo Nobel.
PPG Industries was founded in 1883 as a manufacturer and distributor of glass (its name stands for Pittsburgh Plate Glass) and today has approximately 3,500 technical employees located in more than 70 countries at 100 locations.
On July 18th, 2024, PPG Industries announced second quarter results for the period ending June 30th, 2024. For the quarter, revenue decreased 1.6% to $4.79 billion, which was $130 million less than expected.

Source: Investor Presentation
Adjusted net income of $590 million, or $2.50 per share, compared favorably to adjusted net income of $534 million, or $2.25 per share, in the prior year. Adjusted earnings-per-share was $0.02 above estimates.
Second quarter organic revenue growth was flat compared to the prior year. Performance Coatings revenue of $3.048 billion was essentially unchanged from last year.
Click here to download our most recent Sure Analysis report on PPG (preview of page 1 of 3 shown below):
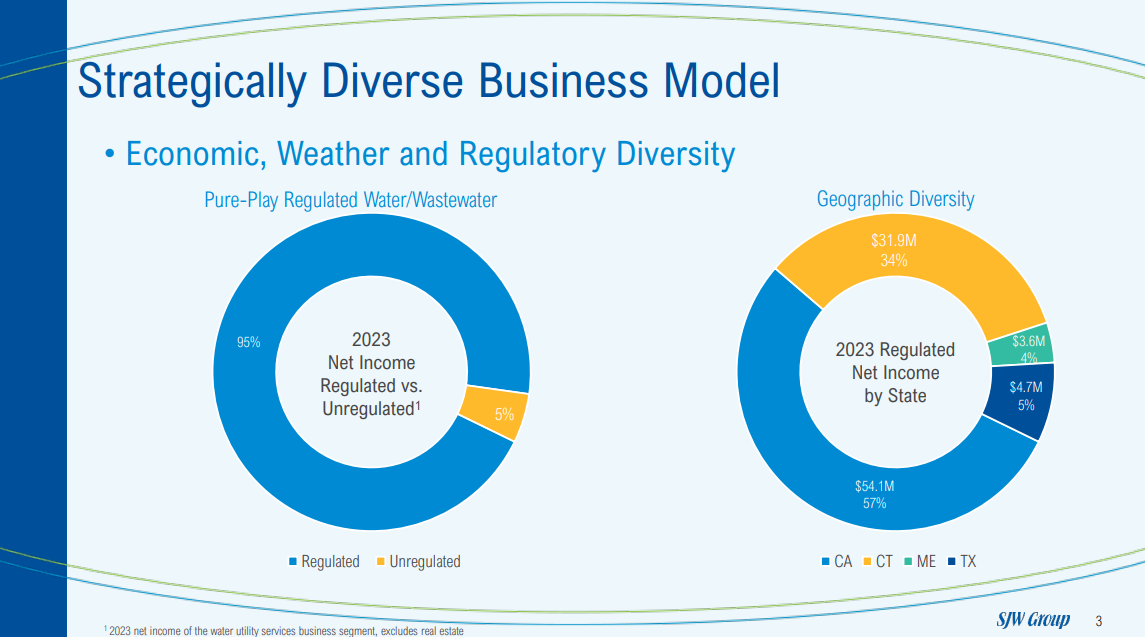
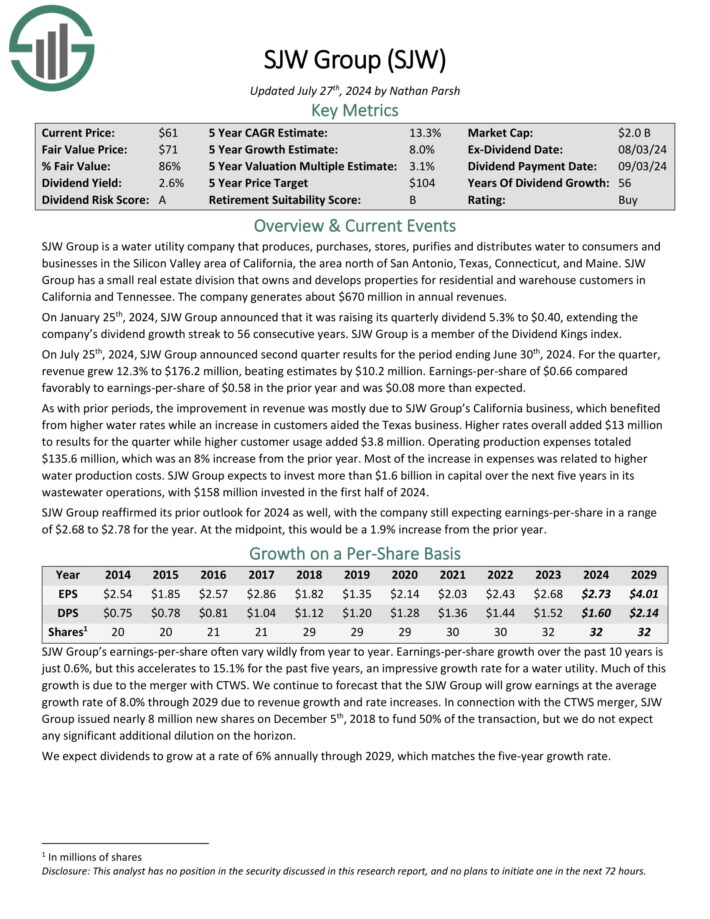
Dividend King #2: SJW Group (SJW)
- 5-Year Annual Expected Returns: 14.1%
SJW Group is a water utility company that produces, purchases, stores, purifies and distributes water to consumers and businesses in the Silicon Valley area of California, the area north of San Antonio, Texas, Connecticut, and Maine.
SJW Group has a small real estate division that owns and develops properties for residential and warehouse customers in California and Tennessee. The company generates about $670 million in annual revenues.
Source: Investor Presentation
On July 25th, 2024, SJW Group announced second quarter results for the period ending June 30th, 2024. For the quarter, revenue grew 12.3% to $176.2 million, beating estimates by $10.2 million. Earnings-per-share of $0.66 compared favorably to earnings-per-share of $0.58 in the prior year and was $0.08 more than expected.
As with prior periods, the improvement in revenue was mostly due to SJW Group’s California business, which benefited from higher water rates while an increase in customers aided the Texas business. Higher rates overall added $13 million to results for the quarter while higher customer usage added $3.8 million.
Click here to download our most recent Sure Analysis report on SJW (preview of page 1 of 3 shown below):
Dividend King #1: Farmers & Merchants Bancorp (FMCB)
- 5-Year Annual Expected Returns: 15.5%
Farmers & Merchants Bancorp is a locally owned and operated community bank with 32 locations in California. Due to its small market cap and its low liquidity, it passes under the radar of most investors. F&M Bank has paid uninterrupted dividends for 88 consecutive years and has raised its dividend for 58 consecutive years.
In mid-July, F&M Bank reported (7/17/24) financial results for the second quarter of fiscal 2024. The bank grew its adjusted earnings-per-share 5% over the prior year’s quarter, from $28.03 to $29.39. It posted 5% growth of loans and flat deposits.
Net interest income dipped -3% due to a contraction of net interest margin from 4.28% to 3.91% amid higher deposit costs. Management remains optimistic for the foreseeable future, as the bank enjoys one of the widest net interest margins in its sector.
Click here to download our most recent Sure Analysis report on FMCB (preview of page 1 of 3 shown below):

Performance Of The Dividend Kings
The Dividend Kings under-performed the S&P 500 ETF (SPY) in August 2024. Return data for the month is shown below:
- Dividend Kings August 2024 total return: 1.4%
- SPY August 2024 total return: 2.3%
Stable dividend growers like the Dividend Kings tend to underperform in bull markets and outperform on a relative basis during bear markets.
The Dividend Kings are not officially regulated and monitored by any one company. There’s no Dividend King ETF. This means that tracking the historical performance of the Dividend Kings can be difficult.
More specifically, performance tracking of the Dividend Kings often introduces significant survivorship bias.
Survivorship bias occurs when one looks at only the companies that ‘survived’ the time period in question. In the case of Dividend Kings, this means that the performance study does not include ex-Kings that reduced their dividend, were acquired, etc.
But with that said, there is something to be gained from investigating the historical performance of the Dividend Kings. Specifically, the performance of the Dividend Kings shows that ‘boring’ established blue-chip stocks that increase their dividend year-after-year can significantly outperform over long periods of time.
Notes: S&P 500 performance is measured using the S&P 500 ETF (SPY). The Dividend Kings performance is calculated using an equal weighted portfolio of today’s Dividend Kings, rebalanced annually. Due to insufficient data, Farmers & Merchants Bancorp (FMCB) returns are from 2000 onward. Performance excludes previous Dividend Kings that ended their streak of dividend increases which creates notable lookback/survivorship bias. The data for this study is from Ycharts.
In the next section of this article, we will provide an overview of the sector and market capitalization characteristics of the Dividend Kings.
Sector & Market Capitalization Overview
The sector and market capitalization characteristics of the Dividend Kings are very different from the characteristics of the broader stock market.
The following bullet points show the number of Dividend Kings in each sector of the stock market.
- Consumer Staples: 14
- Industrials: 11
- Utilities: 9
- Consumer Discretionary: 2
- Health Care: 5
- Financials: 5
- Materials: 5
- Real Estate: 1
- Energy: 1
- Communication Services: 0
The Dividend Kings are overweight in the Industrials, Consumer Staples, and Utilities sectors. Interestingly, The Dividend Kings have zero stocks from the Information Technology sector, which is the largest component of the S&P 500 index.
The Dividend Kings also have some interesting characteristics with respect to market capitalization. These trends are illustrated below.
- 6 Mega caps ($200 billion+ market cap; ABBV, JNJ, PEP, PG, KO, WMT)
- 25 Large caps ($10 billion to $200 billion market cap)
- 14 Mid caps ($2 billion to $10 billion)
- 8 Small caps ($300 million to $2 billion)
Interestingly, 23 out of the 53 Dividend Kings have market capitalizations below $10 billion. This shows that corporate longevity doesn’t have to be accompanied by massive size.
Final Thoughts
Screening to find the best Dividend Kings is not the only way to find high-quality dividend growth stock ideas.
Sure Dividend maintains similar databases on the following useful universes of stocks:
- The High Yield Dividend Kings List is comprised of the 20 Dividend Kings with the highest current yields.
- The Dividend Aristocrats: S&P 500 stocks with 25+ years of consecutive dividend increases.
- The Complete List of High Dividend Stocks: Stocks with 5%+ dividend yields.
- The Complete List of Monthly Dividend Stocks: our database currently contains roughly 80 stocks that pay dividends every month.
There is nothing magical about investing in the Dividend Kings. They are simply a group of high-quality businesses with shareholder-friendly management teams that have strong competitive advantages.
Purchasing businesses with these characteristics at fair or better prices and holding them for long periods of time will likely result in strong long-term investment performance.