Article updated on July 9th, 2026 by Bob Ciura
Spreadsheet data updated daily
High dividend stocks are stocks with a dividend yield well in excess of the market average dividend yield of ~1.2%.
The resources in this report focus on truly high yielding securities, often with dividend yields multiples higher than the market average.
Resource #1: The High Dividend Stocks List Spreadsheet
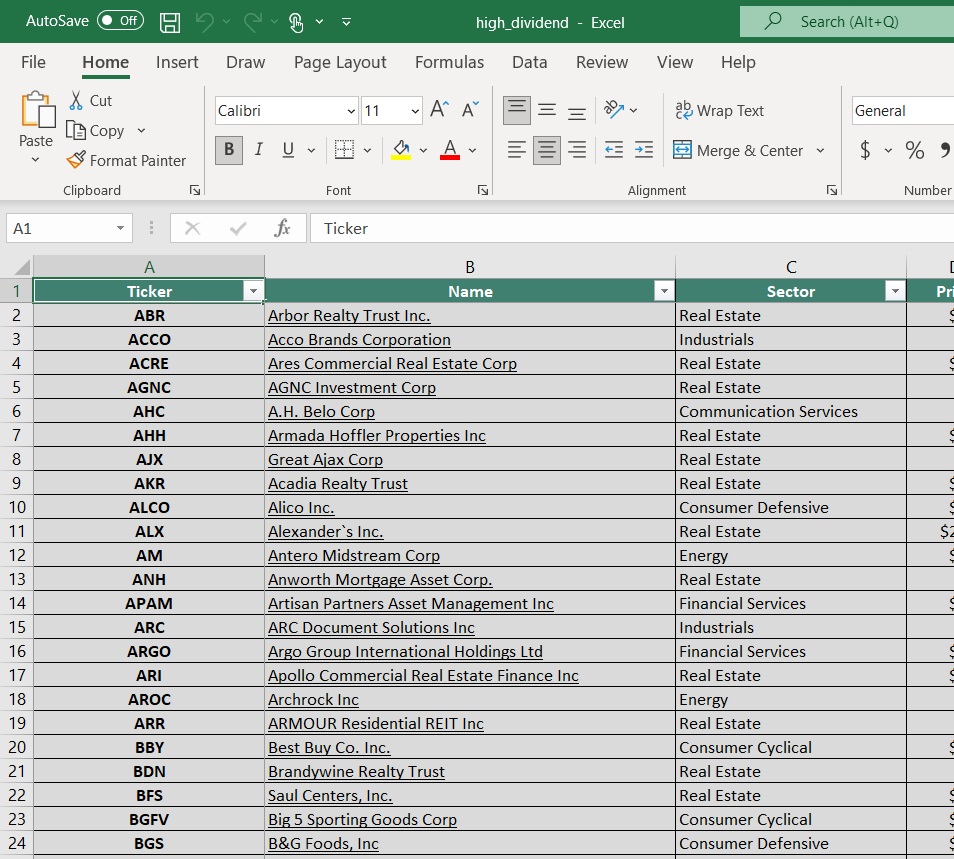
The free high dividend stocks list spreadsheet has our full list of ~200 individual securities (stocks, REITs, MLPs, etc.) with 4%+ dividend yields.
The high dividend stocks spreadsheet has important metrics to help you find compelling ultra high yield income investing ideas. These metrics include:
- Market cap
- Payout ratio
- Dividend yield
- Trailing P/E ratio
- Annualized 5-year dividend growth rate
Resource #2: The 7 Best High Yield Stocks Now
This resource analyzes the 7 best high-yield stocks in detail. The criteria we use to rank high dividend securities in this resource are:
- Is in the 900+ income security Sure Analysis Research Database
- Rank based on dividend yield, from highest to lowest
- Dividend Risk Scores of C or better
- Based in the U.S.
Additionally, a maximum of three stocks are allowed for any single sector to ensure diversification.
Resource #3: The High Dividend 50 Series
The High Dividend 50 Series is where we analyze the 50 highest-yielding securities in the Sure Analysis Research Database. The series consists of 50 stand-alone analysis reports on these securities.
Resource #4: More High-Yield Investing Research
– How to calculate your income per month based on dividend yield
– The risks of high-yield investing
– Other high dividend research
The 7 Best High Yield Stocks Now
This resource analyzes the 7 best high yielding securities in the Sure Analysis Research Database as ranked by the following criteria:
- Rank based on dividend yield, from lowest to highest
- Dividend Risk Scores of C or better
- Based in the U.S.
Note: Ranking data is from the current edition of the Sure Analysis spreadsheet.
Additionally, a maximum of three stocks are allowed for any single market sector to ensure diversification.
It’s difficult to define ‘best’. Here, we are using ‘best’ in terms of highest yields with reasonable and better dividend safety.
A tremendous amount of research goes into finding these 7 high yield securities.
We analyze more than 900 income securities every quarter in the Sure Analysis Research Database. This is real analysis done by our analyst team, not a quick computer screen.
“So I think it was just looking at different companies and I always thought if you looked at 10 companies, you’d find one that’s interesting, if you’d look at 20, you’d find two, or if you look at 100 you’ll find 10. The person that turns over the most rocks wins the game. I’ve also found this to be true in my personal investing.”
– Investing legend Peter Lynch
Click here to download a PDF report for just one of the 900+ income securities we cover in Sure Analysis to get an idea of the level of work that goes into finding compelling income investments for our audience.
The 7 best high yield securities are listed in order by dividend yield below, from lowest to highest.
- High Dividend Stock #7: Realty Income (O)
- High Dividend Stock #6: Clorox Co. (CLX)
- High Dividend Stock #5: Solvay Bank Corp. (SOBS)
- High Dividend Stock #4: Comcast Corp. (CMCSA)
- High Dividend Stock #3: Enterprise Products Partners LP (EPD)
- High Dividend Stock #2: Altria Group (MO)
- High Dividend Stock #1: Universal Corp. (UVV)
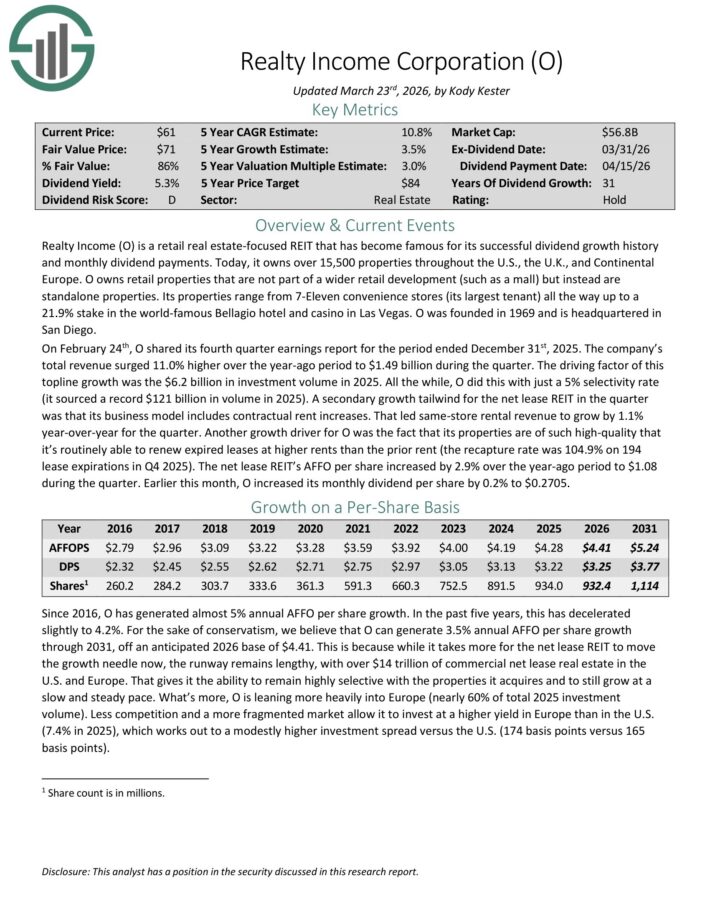
High Dividend Stock #7: Realty Income (O)
- Dividend Yield: 5.1%
- Dividend Risk Score: C
Realty Income is a retail real estate-focused REIT that has become famous for its successful dividend growth history and monthly dividend payments.
Today, it owns over 15,500 properties throughout the U.S., the U.K., and Continental Europe. It owns retail properties that are not part of a wider retail development (such as a mall) but instead are standalone properties.
Its properties range from 7-Eleven convenience stores (its largest tenant) all the way up to a 21.9% stake in the Bellagio hotel and casino in Las Vegas.
On February 24th, O shared its fourth quarter earnings report for the period ended December 31st, 2025. The company’s total revenue surged 11.0% higher over the year-ago period to $1.49 billion during the quarter.
The driving factor of this top-line growth was the $6.2 billion in investment volume in 2025. All the while, the company did this with just a 5% selectivity rate (it sourced a record $121 billion in volume in 2025).
A secondary growth tailwind for the net lease REIT in the quarter was that its business model includes contractual rent increases. That led same-store rental revenue to grow by 1.1% year-over-year for the quarter.
The net lease REIT’s AFFO per share increased by 2.9% over the year-ago period to $1.08 during the quarter.
Click here to download our most recent Sure Analysis report on O (preview of page 1 of 3 shown below):
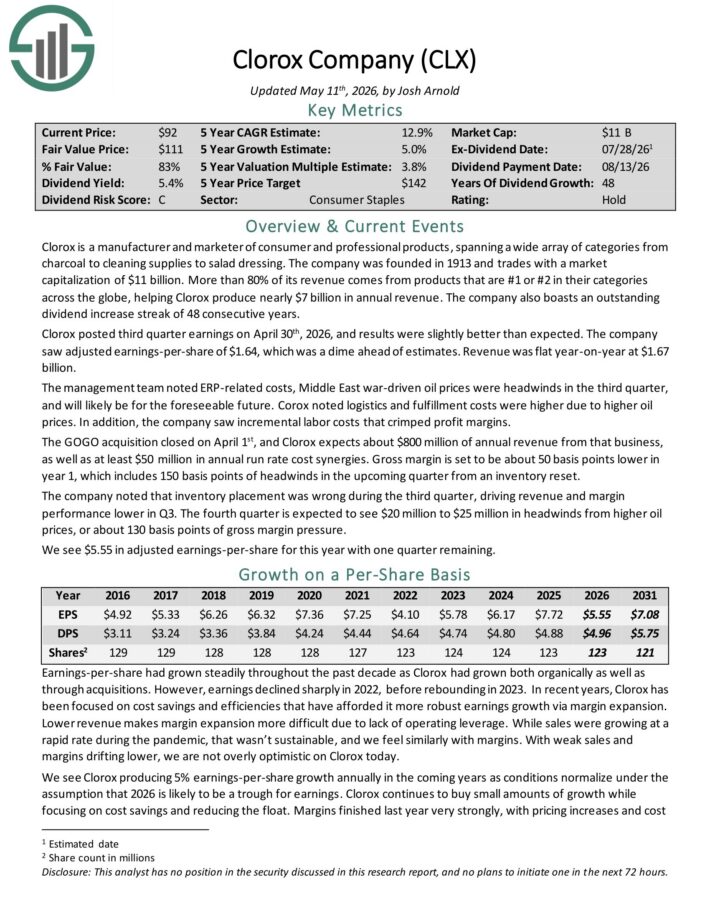
High Dividend Stock #6: Clorox Co. (CLX)
- Dividend Yield: 5.3%
- Dividend Risk Score: C
Clorox is a manufacturer and marketer of consumer and professional products, spanning a wide array of categories from charcoal to cleaning supplies to salad dressing.
More than 80% of its revenue comes from products that are #1 or #2 in their categories across the globe, helping Clorox produce more than $7 billion in annual revenue.
The company also boasts an outstanding dividend increase streak of 48 consecutive years.
Clorox posted third quarter earnings on April 30th, 2026, and results were slightly better than expected. The company saw adjusted earnings-per-share of $1.64, which was a dime ahead of estimates.
Revenue was flat year-on-year at $1.67 billion. The management team noted ERP-related costs, Middle East war-driven oil prices were headwinds in the third quarter, and will likely be for the foreseeable future.
Corox noted logistics and fulfillment costs were higher due to higher oil prices. In addition, the company saw incremental labor costs that crimped profit margins.
The GOGO acquisition closed on April 1st, and Clorox expects about $800 million of annual revenue from that business, as well as at least $50 million in annual run rate cost synergies.
Click here to download our most recent Sure Analysis report on CLX (preview of page 1 of 3 shown below):
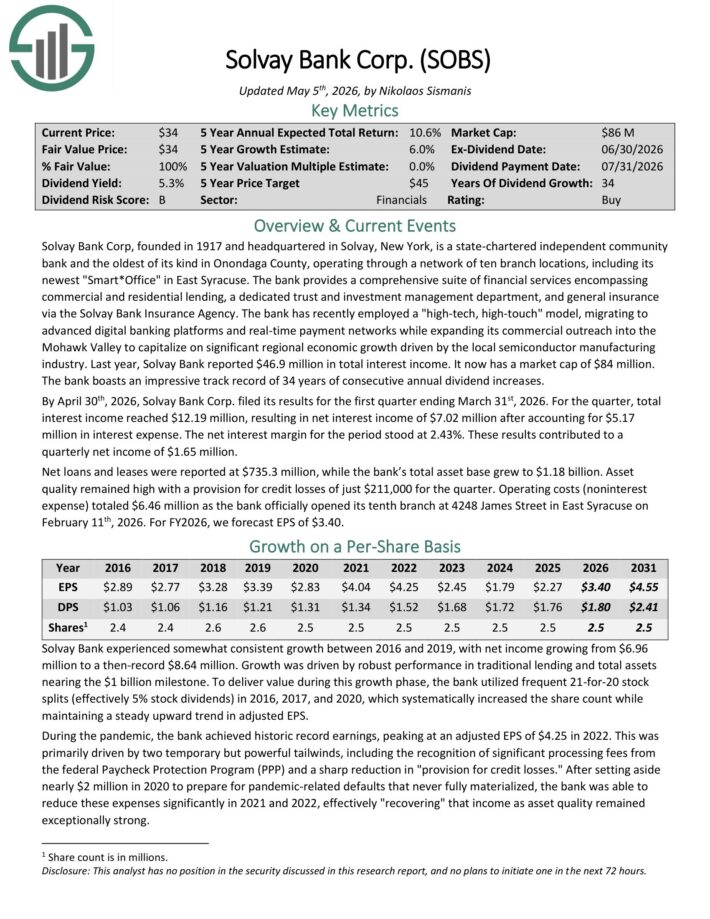
High Dividend Stock #5: Solvay Bank Corp. (SOBS)
- Dividend Yield: 5.4%
- Dividend Risk Score: B
Solvay Bank Corp is a state-chartered independent community bank and the oldest of its kind in Onondaga County, New York. It operates through a network of ten branch locations, including its newest “Smart*Office” in East Syracuse.
The bank provides a comprehensive suite of financial services encompassing commercial and residential lending, a dedicated trust and investment management department, and general insurance via the Solvay Bank Insurance Agency.
Last year, Solvay Bank reported $46.9 million in total interest income. The bank boasts an impressive track record of 34 years of consecutive annual dividend increases.
By April 30th, 2026, Solvay Bank Corp. filed its results for the first quarter ending March 31st, 2026. For the quarter, total interest income reached $12.19 million, resulting in net interest income of $7.02 million after accounting for $5.17 million in interest expense.
The net interest margin for the period stood at 2.43%. These results contributed to a quarterly net income of $1.65 million.
Click here to download our most recent Sure Analysis report on SOBS (preview of page 1 of 3 shown below):
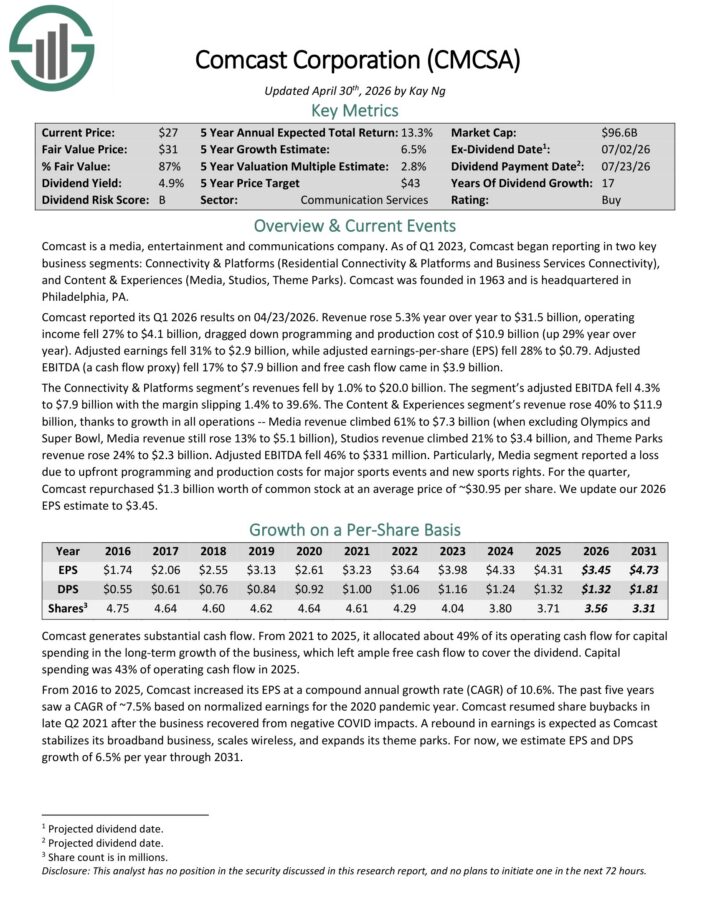
High Dividend Stock #4: Comcast Corp. (CMCSA)
- Dividend Yield: 5.7%
- Dividend Risk Score: B
Comcast is a media, entertainment and communications company. It reports two key business segments: Connectivity & Platforms (Residential Connectivity & Platforms and Business Services Connectivity), and Content & Experiences (Media, Studios, Theme Parks).
Comcast reported its Q1 2026 results on 04/23/2026. Revenue rose 5.3% year over year to $31.5 billion, operating income fell 27% to $4.1 billion, dragged down programming and production cost of $10.9 billion (up 29% year-over-year).
Adjusted earnings fell 31% to $2.9 billion, while adjusted earnings-per-share (EPS) fell 28% to $0.79. Adjusted EBITDA (a cash flow proxy) fell 17% to $7.9 billion and free cash flow came in $3.9 billion.
The Connectivity & Platforms segment’s revenues fell by 1.0% to $20.0 billion. The segment’s adjusted EBITDA fell 4.3% to $7.9 billion with the margin slipping 1.4% to 39.6%.
The Content & Experiences segment’s revenue rose 40% to $11.9 billion, thanks to growth in all operations — Media revenue climbed 61% to $7.3 billion (when excluding Olympics and Super Bowl, Media revenue still rose 13% to $5.1 billion), Studios revenue climbed 21% to $3.4 billion, and Theme Parks revenue rose 24% to $2.3 billion.
Adjusted EBITDA fell 46% to $331 million. Particularly, Media segment reported a loss due to upfront programming and production costs for major sports events and new sports rights.
For the quarter, Comcast repurchased $1.3 billion worth of common stock at an average price of ~$30.95 per share.
Click here to download our most recent Sure Analysis report on CMCSA (preview of page 1 of 3 shown below):
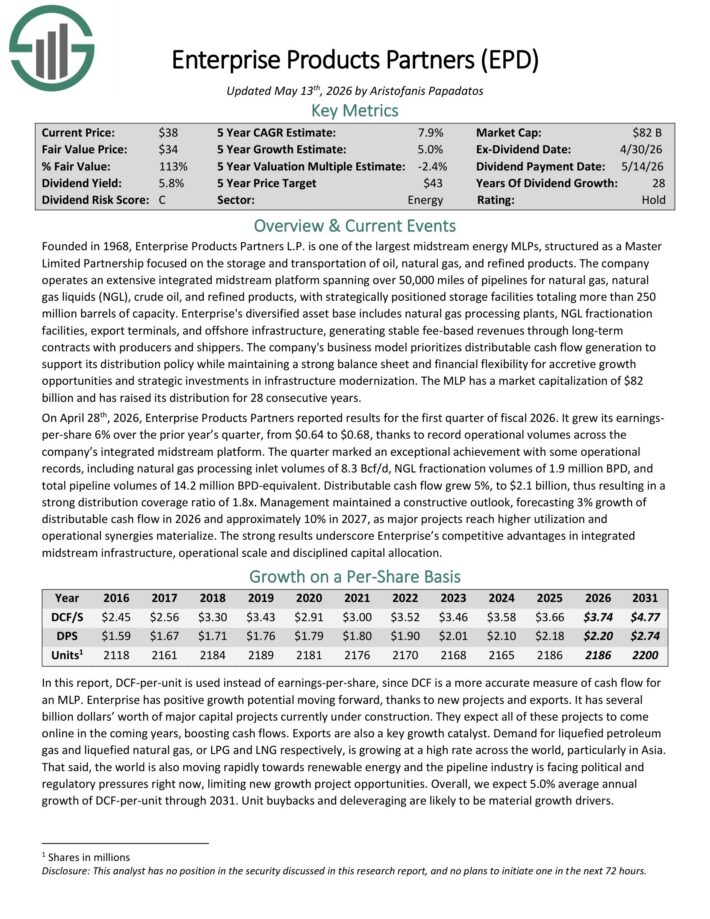
High Dividend Stock #3: Enterprise Products Partners LP (EPD)
- Dividend Yield: 5.8%
- Dividend Risk Score: C
Enterprise Products Partners was founded in 1968. It is structured as a Master Limited Partnership, or MLP, and operates as an oil and gas storage and transportation company.
Enterprise Products has a large asset base which consists of nearly 50,000 miles of natural gas, natural gas liquids, crude oil, and refined products pipelines.
It also has storage capacity of more than 250 million barrels. These assets collect fees based on volumes of materials transported and stored.
On April 28th, 2026, Enterprise Products Partners reported results for the first quarter of fiscal 2026. It grew its earnings-per-share 6% over the prior year’s quarter, from $0.64 to $0.68, thanks to record operational volumes across the company’s integrated midstream platform.
The quarter marked an exceptional achievement with some operational records, including natural gas processing inlet volumes of 8.3 Bcf/d, NGL fractionation volumes of 1.9 million BPD, and total pipeline volumes of 14.2 million BPD-equivalent.
Distributable cash flow grew 5%, to $2.1 billion, thus resulting in a strong distribution coverage ratio of 1.8x.
Click here to download our most recent Sure Analysis report on EPD (preview of page 1 of 3 shown below):
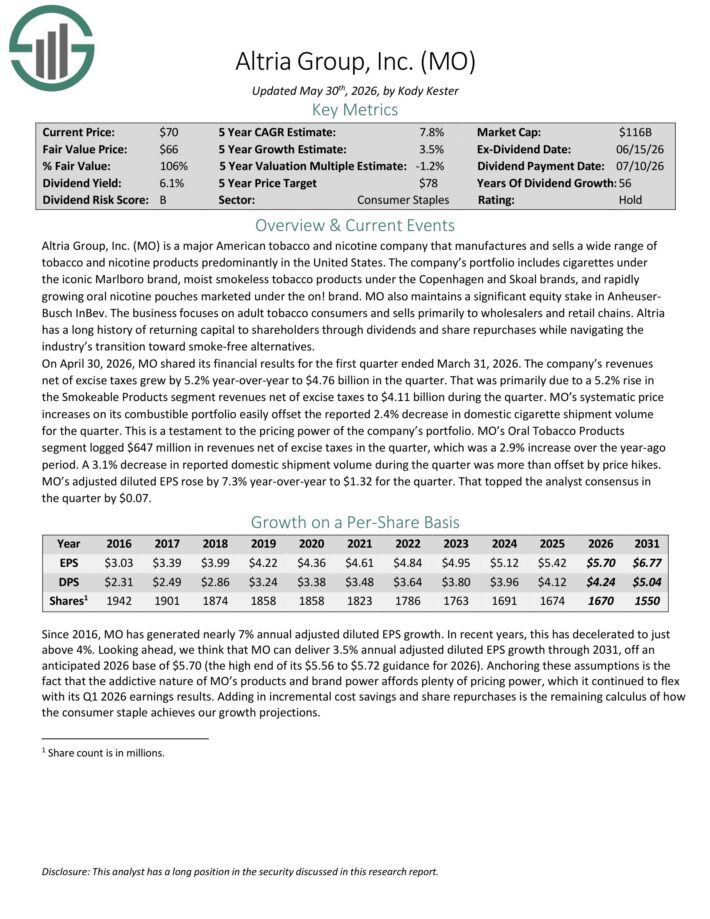
High Dividend Stock #2: Altria Group (MO)
- Dividend Yield: 6.1%
- Dividend Risk Score: B
Altria is a tobacco stock that sells cigarettes, chewing tobacco, cigars, e-cigarettes, and more under a variety of brands, including Marlboro, Skoal, and Copenhagen, among others.
This is a period of transition for Altria. The decline in the U.S. smoking rate continues. In response, Altria has invested heavily in new products that appeal to changing consumer preferences, as the smoke-free category continues to grow.
The company also has a 35% investment stake in e-cigarette maker JUUL, and a 45% stake in the Canadian cannabis producer Cronos Group (CRON).
On April 30, 2026, MO shared its financial results for the first quarter ended March 31, 2026. Revenue net of excise taxes grew by 5.2% year-over-year to $4.76 billion in the quarter.
That was primarily due to a 5.2% rise in the Smokeable Products segment revenues net of excise taxes to $4.11 billion during the quarter.
Price increases on its combustible portfolio easily offset the reported 2.4% decrease in domestic cigarette shipment volume for the quarter.
MO’s Oral Tobacco Products segment logged $647 million in revenues net of excise taxes in the quarter, which was a 2.9% increase over the year-ago period.
MO’s adjusted diluted EPS rose by 7.3% year-over-year to $1.32 for the quarter.
Click here to download our most recent Sure Analysis report on Altria (preview of page 1 of 3 shown below):
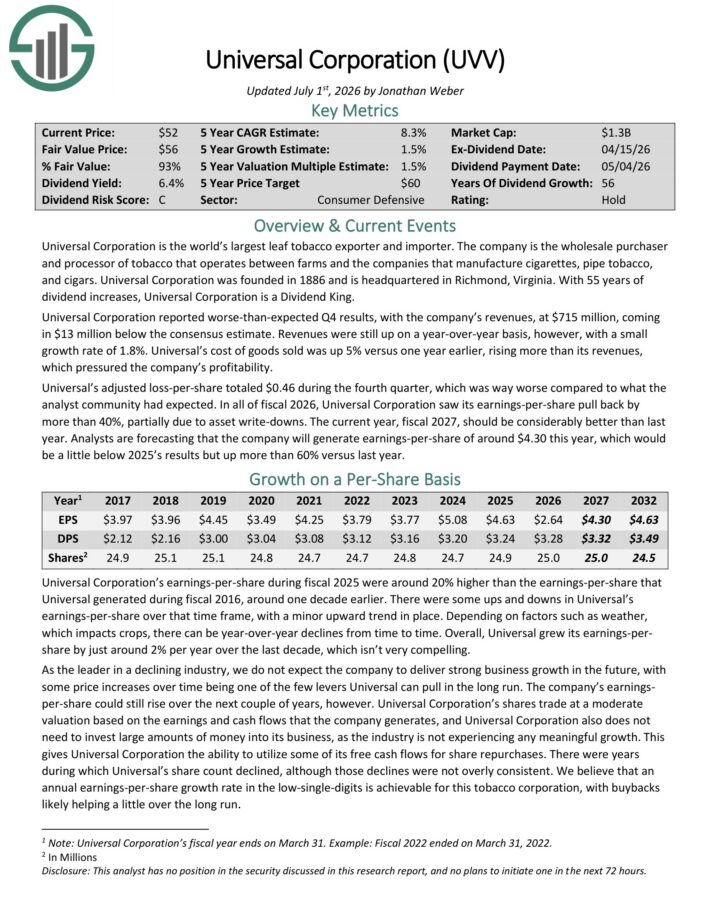
High Dividend Stock #1: Universal Corp. (UVV)
- Dividend Yield: 6.4%
- Dividend Risk Score: C
Universal Corporation is a market leader in supplying leaf tobacco and other plant-based inputs to consumer product manufacturers.
The Tobacco Operations segment buys and sells tobacco used to make cigarettes, cigars, pipe tobacco, and smokeless products. Universal buys tobacco from its suppliers, processes it, and sells it to large tobacco companies in the US and internationally.
The Ingredient Operations deal mainly with vegetables and fruits but is significantly smaller than the tobacco operations.
Universal Corporation reported worse-than-expected Q4 results, with the company’s revenues, at $715 million, coming in $13 million below the consensus estimate.
Revenues were still up on a year-over-year basis, however, with a small growth rate of 1.8%. Universal’s cost of goods sold was up 5% versus one year earlier, rising more than its revenues, which pressured the company’s profitability.
Universal’s adjusted loss-per-share totaled $0.46 during the fourth quarter, which was way worse compared to what the analyst community had expected.
In all of fiscal 2026, Universal Corporation saw its earnings-per-share pull back by more than 40%, partially due to asset write-downs.
Click here to download our most recent Sure Analysis report on UVV (preview of page 1 of 3 shown below):
The High Dividend 50 Series
The High Dividend 50 Series is a once-a-year individual analysis of the 50 highest-yielding Sure Analysis Research Database stocks, excluding royalty trusts, BDCs, REITs, and MLPs.
Click on a company’s name to view the high dividend 50 series article for that company. A link to the specific Sure Analysis Research Database report page for each security is included as well.
- AGNC Investment Corp. (AGNC)
- Atrium Mortgage Investment Corporation (AMIVF)
- Apple Hospitality REIT (APLE)
- ARMOUR Residential REIT (ARR)
- Barings BDC (BBDC)
- Diversified Royalty Corp. (BEVFF)
- Bridgemarq Real Estate Services (BREUF)
- Cogent Communications Holdings (CCOI)
- Community Healthcare Trust (CHCT)
- Chimera Investment Corp. (CIM)
- Cardinal Energy Ltd. (CRLFF)
- Cross Timbers Royalty Trust (CRT)
- Capital Southwest Corp. (CSWC)
- Delek Logistics Partners, LP (DKL)
- Dynex Capital, Inc. (DX)
- Ellington Credit Co. (EARN)
- Ellington Financial (EFC)
- Energy Transfer LP (ET)
- Fidus Investment Corp (FDUS)
- Freehold Royalties Ltd. (FRHLF)
- Firm Capital Property Trust (FRMUF)
- Golub Capital BDC (GBDC)
- Gladstone Capital (GLAD)
- Gladstone Commercial (GOOD)
- Geopark Limited (GPRK)
- Hess Midstream LP (HESM)
- Hooker Furnishings (HOFT)
- Horizon Technology Finance (HRZN)
- Huntsman Corp (HUN)
- Innovative Industrial Properties (IIPR)
- InPlay Oil Corp. (IPOOF)
- LyondellBasell Industries NV (LYB)
- Modiv Industrial (MDV)
- Midland States Bancorp (MSBI)
- Mesa Royalty Trust (MTR)
- Blue Owl Capital (OBDC)
- Orchid Island Capital (ORC)
- Oxford Square Capital Corp. (OXSQ)
- Plains All American Pipeline LP (PAA)
- Plains GP Holdings LP (PAGP)
- PennantPark Floating Rate Capital (PFLT)
- Alpine Income Property Trust (PINE)
- PermRock Royalty Trust (PRT)
- Prospect Capital (PSEC)
- Stellus Capital Investment (SCM)
- SIR Royalty Income (SIRZF)
- Slate Grocery REIT (SRRTF)
- Timbercreek Financial (TBCRF)
- Sixth Street Specialty Lending (TSLX)
- Universal Health Realty Income Trust (UHT)
More High-Yield Investing Resources
How To Calculate Your Monthly Income Based On Dividend Yield
A common question for income investors is “how much money can I expect to receive per month from my investment?”
To find your monthly income, follow these steps:
- Find your investment’s dividend yield
Note: Dividend yield can be calculated as dividends per share divided by share price - Multiply it by the current value of your holding
Note: If you haven’t yet invested, multiply dividend yield by the amount you plan to invest - Divide this number by 12 to find monthly income
To find the monthly income from your entire portfolio, repeat the above calculation for each of your holdings and add them together.
You can also use this formula backwards to find the dividend yield you need from your investments to make a certain amount of monthly dividend income.
The example below assumes you want to know what dividend yield you need on a $240,000 investment to generate $1,000/month in dividend income.
- Multiply $1,000 by 12 to find annual income target of $12,000
- Divide $12,000 by your investment amount of $240,000 to find your target yield of 5.0%
In practice most dividend stocks pay dividends quarterly, so you would actually receive 3x the monthly amount quarterly instead of receiving a payment every month. However, some stocks do actually pay monthly dividends.
You can see our monthly dividend stocks list here.
The Risks Of High-Yield Investing
Investing in high-yield stocks is a great way to generate income. But it is not without risks.
First, stock prices fluctuate. Investors need to understand their risk tolerance before investing in high dividend stocks. Share price fluctuations means that your investment can (and almost certainly will) decline in value, at least temporarily (and possibly permanently) do to market volatility.
Second, businesses grow and decline. Investing in a stock gives you fractional ownership in the underlying business. Some businesses grow over time. These businesses are likely to pay higher dividends over time.
The Dividend Champions are an excellent example of this; each has paid rising dividends for 25+ consecutive years.
What’s dangerous is when a business declines. Dividends are paid out of a company’s cash flows. If the business sees its cash flows decline, or worse is losing money, it may reduce or eliminate its dividend.
Business decline is a real risk with high yield investing. Business declines often coincide with and or accelerate during recessions.
A company’s payout ratio gives a good gauge of how much ‘room’ a company has to pay its dividend. The payout ratio is calculated as dividends divided by income.
The lower the payout ratio, the better, because dividends have more earnings coverage.
A company with a payout ratio over 100% is paying out more in dividends than it is making in profits, a long-term unsustainable situation.
For example, a company with a payout ratio of 50% is making double in income what it is paying out in dividends, so it has ‘room’ for earnings to decline significantly without reducing its dividend.
Third, management teams can change their dividend policies. Even if a company isn’t declining, the company’s management team may change priorities and reduce or eliminate its dividend.
In practice, this typically occurs if a company has a high level of debt and wants to focus on debt reduction. But it could in theory happen to any dividend paying stock.
The risks of high yield investing can be reduced (but not eliminated) by investing in higher quality businesses in a diversified portfolio of 20 or more stocks.
This reduces both business decline risk (by investing in high quality businesses) and the shock to your portfolio if any one stock does reduce or eliminate its dividend (through diversification).
Other High Dividend Research
The free spreadsheet of 4%+ dividend yield stocks in this article gives you more than 200 high yield income securities to review. You can download it below:
Investors should continue to monitor each stock to make sure their fundamentals and growth remain on track, particularly among stocks with extremely high dividend yields.
See the resources below to generate additional compelling investment ideas for dividend growth stocks and/or high-yield investment securities.
- Dividend Kings: 50+ years of rising dividends
- Dividend Aristocrats: 25+ years of rising dividends and in the S&P 500