Updated on March 19th, 2026 by Bob Ciura
DRIP stands for Dividend Reinvestment Plan. When an investor is enrolled in DRIP stocks, it means that incoming dividend payments are used to purchase more shares of the issuing company – automatically.
Many businesses offer DRIPs that require the investors to pay fees. Obviously, paying fees is a negative for investors. As a general rule, investors are better off avoiding DRIP stocks that charge fees.
Fortunately, many companies offer no-fee DRIP stocks. These allow investors to use their hard-earned dividends to build even larger positions in their favorite high-quality, dividend-paying companies – for free.
The Dividend Champions are a group of quality dividend stocks that have raised their dividends for at least 25 consecutive years.
You can download your free copy of the Dividend Champions list, along with relevant financial metrics like price-to-earnings ratios, dividend yields, and payout ratios, by clicking on the link below:
Think about the powerful combination of DRIPs and Dividend Champions…
You are reinvesting dividends into a company that pays higher dividends every year. This means that every year you get more shares – and each share is paying you more dividend income than the previous year.
This makes a powerful (and cost-effective) compounding machine.
This article takes a look at the top 15 Dividend Champions that are no-fee DRIP stocks, ranked in order of expected total returns from lowest to highest.
The updated list for 2026 includes our top 15 Dividend Champions, ranked by expected returns according to the Sure Analysis Research Database, that offer no-fee DRIPs to shareholders.
You can skip to analysis of any individual Dividend Champion below:
- #15: Universal Corp. (UVV)
- #14: National Fuel Gas (NFG)
- #13: Universal Health Realty Trust (UHT)
- #12: California Water Service (CWT)
- #11: United Bankshares (UBSI)
- #10: Emerson Electric (EMR)
- #9: Illinois Tool Works (ITW)
- #8: New Jersey Resources (NJR)
- #7: A.O. Smith (AOS)
- #6: Abbott Laboratories (ABT)
- #5: Nordson Corp. (NDSN)
- #4: Hormel Foods (HRL)
- #3: Arrow Financial (AROW)
- #2: Tompkins Financial (TMP)
- #1: S&P Global (SPGI)
Additionally, please see the video below for more coverage.
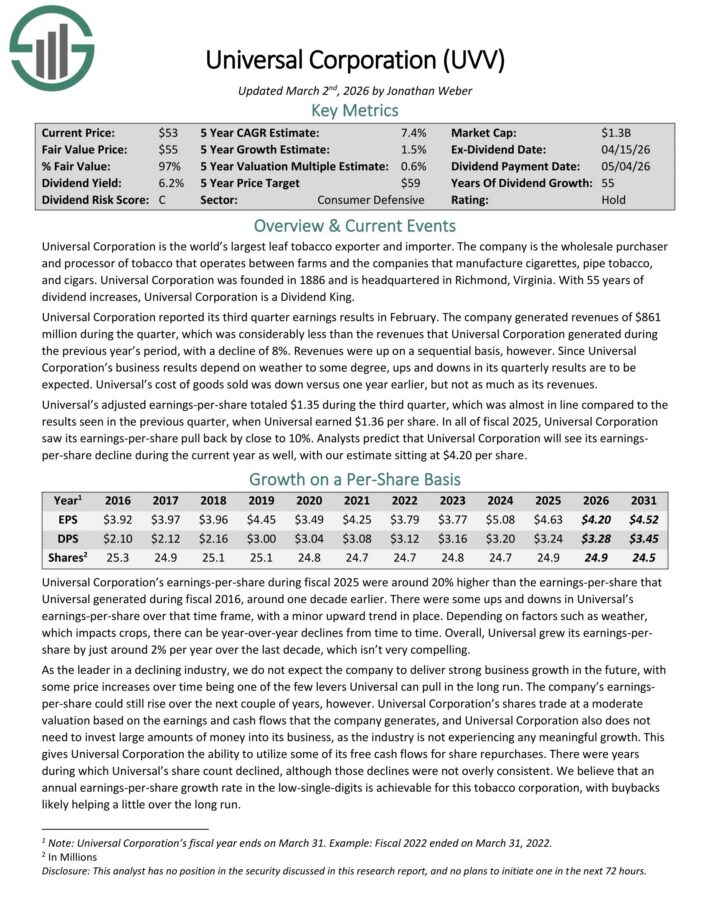
#15: Universal Corporation (UVV)
- 5-year expected annual returns: 7.9%
Universal Corporation is the world’s largest leaf tobacco exporter and importer. The company is the wholesale purchaser and processor of tobacco that operates between farms and the companies that manufacture cigarettes, pipe tobacco, and cigars.
Universal Corporation was founded in 1886 and is headquartered in Richmond, Virginia. With 55 years of dividend increases, Universal Corporation is a Dividend King.
Universal Corporation reported its third quarter earnings results in February. The company generated revenue of $861
million during the quarter, a decline of 8% year-over-year.
Revenues were up on a sequential basis, however. Since Universal Corporation’s business results depend on weather to some degree, ups and downs in its quarterly results are to be expected.
Universal’s cost of goods sold was down versus one year earlier, but not as much as its revenues.
Universal’s adjusted earnings-per-share totaled $1.35 during the third quarter, which was almost in line compared to the results seen in the previous quarter, when Universal earned $1.36 per share.
In all of fiscal 2025, Universal Corporation saw its earnings-per-share pull back by close to 10%.
Click here to download our most recent Sure Analysis report on UVV (preview of page 1 of 3 shown below):
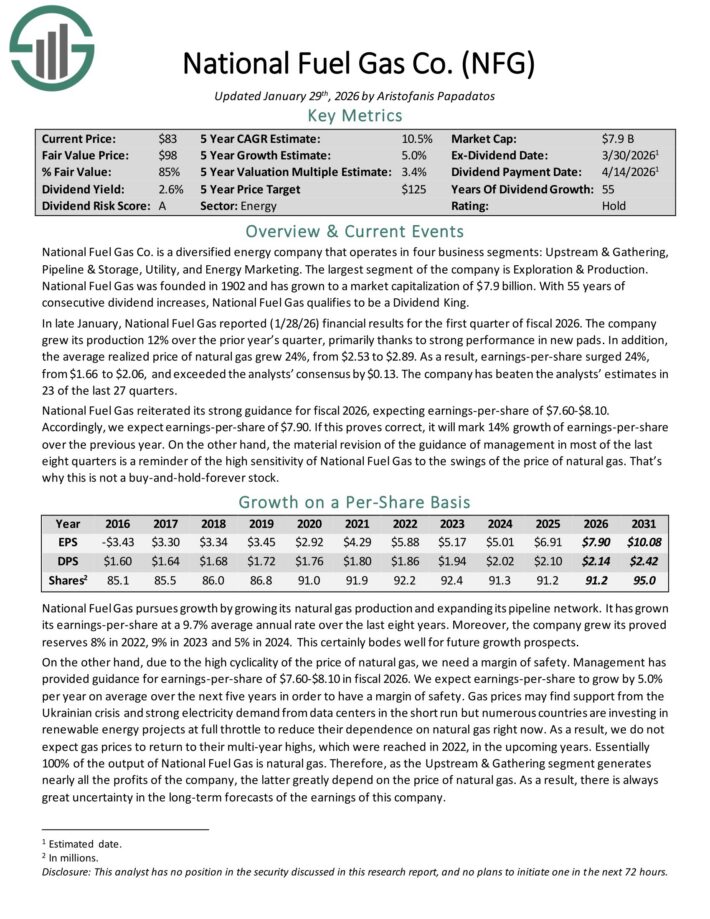
#14: National Fuel Gas (NFG)
- 5-year expected annual returns: 8.1%
National Fuel Gas Co. is a diversified energy company that operates in four business segments: Upstream & Gathering, Pipeline & Storage, Utility, and Energy Marketing.
The largest segment of the company is Exploration & Production. With 55 years of consecutive dividend increases, National Fuel Gas qualifies to be a Dividend King.
In late January, National Fuel Gas reported (1/28/26) financial results for the first quarter of fiscal 2026. The company
grew its production 12% over the prior year’s quarter, primarily thanks to strong performance in new pads.
In addition, the average realized price of natural gas grew 24%, from $2.53 to $2.89.
As a result, earnings-per-share surged 24%, from $1.66 to $2.06, and exceeded the analysts’ consensus by $0.13. The company has beaten the analysts’ estimates in 23 of the last 27 quarters.
National Fuel Gas reiterated its strong guidance for fiscal 2026, expecting earnings-per-share of $7.60-$8.10.
Accordingly, we expect earnings-per-share of $7.90. If this proves correct, it will mark 14% growth of earnings-per-share over the previous year.
Click here to download our most recent Sure Analysis report on NFG (preview of page 1 of 3 shown below):
#13: Universal Health Realty Trust (UHT)
- 5-year expected annual returns: 8.4%
Universal Health Realty Income Trust operates as a real estate investment trust (REIT), specializing in the healthcare sector. The trust owns healthcare and human service-related facilities.
Its property portfolio includes acute care hospitals, medical office buildings, rehabilitation hospitals, behavioral healthcare facilities, sub-acute care facilities and childcare centers. Universal Health’s portfolio consists of 76 properties located in 21 states.
On October 27, 2025, Universal Health Realty Income Trust (UHT) reported third quarter 2025 net income of $4.0 million, or $0.29 per diluted share, unchanged from the same quarter in 2024.
Results included a one-time $275,000 gain ($0.02 per share) from a settlement and release agreement related to one of its medical office buildings, partially offset by a $256,000 decrease in aggregate property income, which included $900,000 of nonrecurring depreciation expense.
Funds from operations (FFO) rose to $12.2 million, or $0.88 per diluted share, up from $11.3 million, or $0.82 per share, in the prior year period.
Click here to download our most recent Sure Analysis report on UHT (preview of page 1 of 3 shown below):

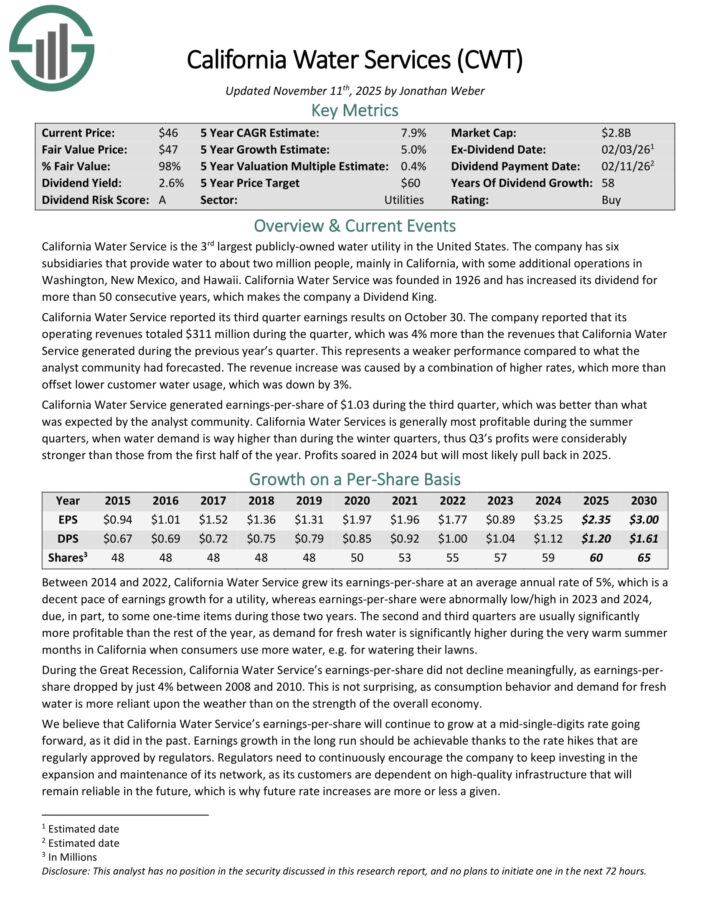
#12: California Water Service (CWT)
- 5-year expected annual returns: 9.3%
California Water Service is the 3rd largest publicly-owned water utility in the United States. The company has six subsidiaries that provide water to about two million people, mainly in California, with some additional operations in Washington, New Mexico, and Hawaii.
California Water Service reported its third quarter earnings results on October 30. The company reported that its operating revenues totaled $311 million during the quarter, which was 4% more than the revenues that California Water Service generated during the previous year’s quarter. This represents a weaker performance compared to what the analyst community had forecast.
The revenue increase was caused by a combination of higher rates, which more than offset lower customer water usage, which was down by 3%. California Water Service generated earnings-per-share of $1.03 during the third quarter.
CWT has increased its dividend for 58 consecutive years.
Click here to download our most recent Sure Analysis report on CWT (preview of page 1 of 3 shown below):
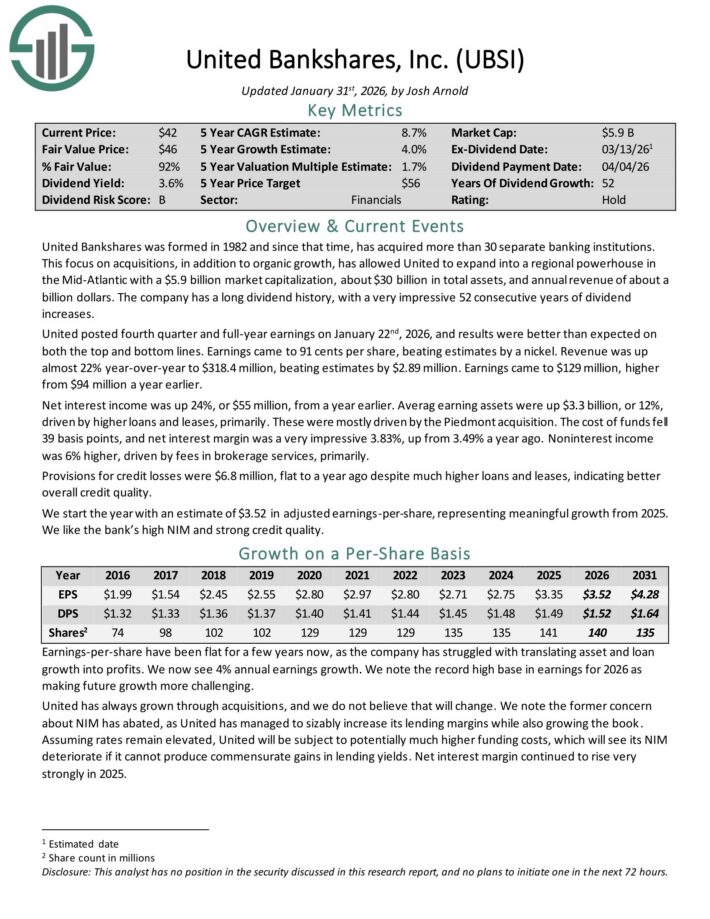
#11: United Bankshares (UBSI)
- 5-year expected annual returns: 10.3%
United Bankshares was formed in 1982 and since that time, has acquired more than 30 separate banking institutions.
This focus on acquisitions, in addition to organic growth, has allowed United to expand into a regional powerhouse in the Mid-Atlantic with about $30 billion in total assets, and annual revenue of about a billion dollars.
The company has a long dividend history, with a very impressive 52 consecutive years of dividend increases.
United posted fourth quarter and full-year earnings on January 22nd, 2026, and results were better than expected on both the top and bottom lines. Earnings came to 91 cents per share, beating estimates by a nickel.
Revenue was up almost 22% year-over-year to $318.4 million, beating estimates by $2.89 million. Earnings came to $129 million, higher from $94 million a year earlier.
Net interest income was up 24%, or $55 million, from a year earlier. Average earning assets were up $3.3 billion, or 12%, driven by higher loans and leases, primarily. These were mostly driven by the Piedmont acquisition.
The cost of funds fell 39 basis points, and net interest margin was a very impressive 3.83%, up from 3.49% a year ago. Non-interest income was 6% higher, driven by fees in brokerage services, primarily.
Click here to download our most recent Sure Analysis report on UBSI (preview of page 1 of 3 shown below):
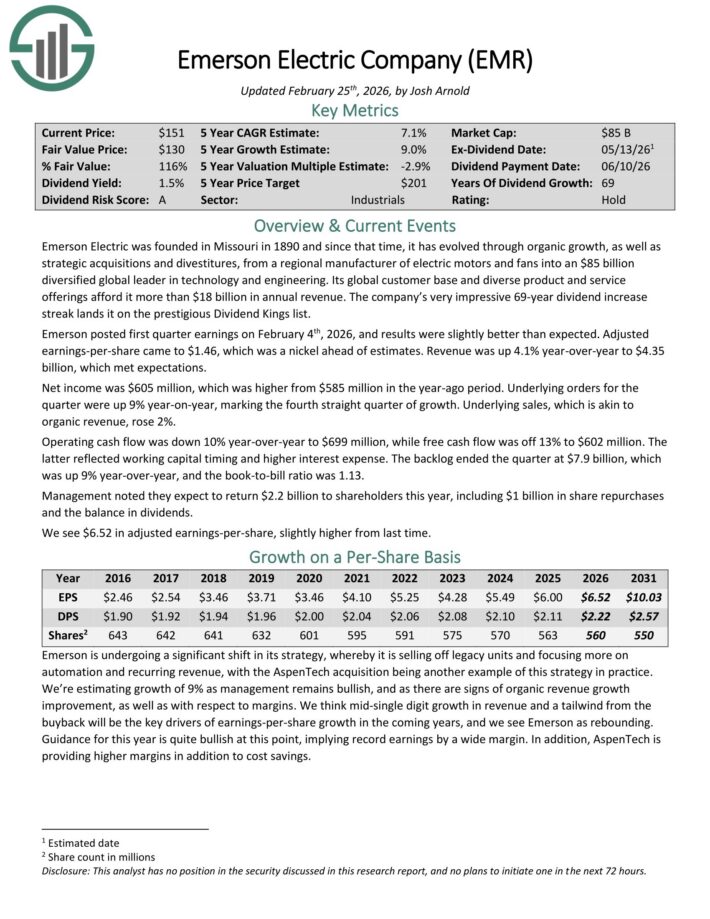
#10: Emerson Electric (EMR)
- 5-year expected annual returns: 10.5%
Emerson Electric was founded in Missouri in 1890 and since that time, it has evolved through organic growth, as well as strategic acquisitions and divestitures, from a regional manufacturer of electric motors and fans into a diversified global leader in technology and engineering.
Its global customer base and diverse product and service offerings afford it more than $18 billion in annual revenue. The company’s very impressive 69-year dividend increase streak lands it on the prestigious Dividend Kings list.
Emerson posted first quarter earnings on February 4th, 2026, and results were slightly better than expected. Adjusted earnings-per-share came to $1.46, which was a nickel ahead of estimates. Revenue was up 4.1% year-over-year to $4.35 billion, which met expectations.
Net income was $605 million, which was higher from $585 million in the year-ago period. Underlying orders for the quarter were up 9% year-on-year, marking the fourth straight quarter of growth.
Underlying sales, which is akin to organic revenue, rose 2%. Operating cash flow was down 10% year-over-year to $699 million, while free cash flow was off 13% to $602 million.
The latter reflected working capital timing and higher interest expense. The backlog ended the quarter at $7.9 billion, which was up 9% year-over-year, and the book-to-bill ratio was 1.13.
Management noted they expect to return $2.2 billion to shareholders this year, including $1 billion in share repurchases and the balance in dividends.
Click here to download our most recent Sure Analysis report on EMR (preview of page 1 of 3 shown below):
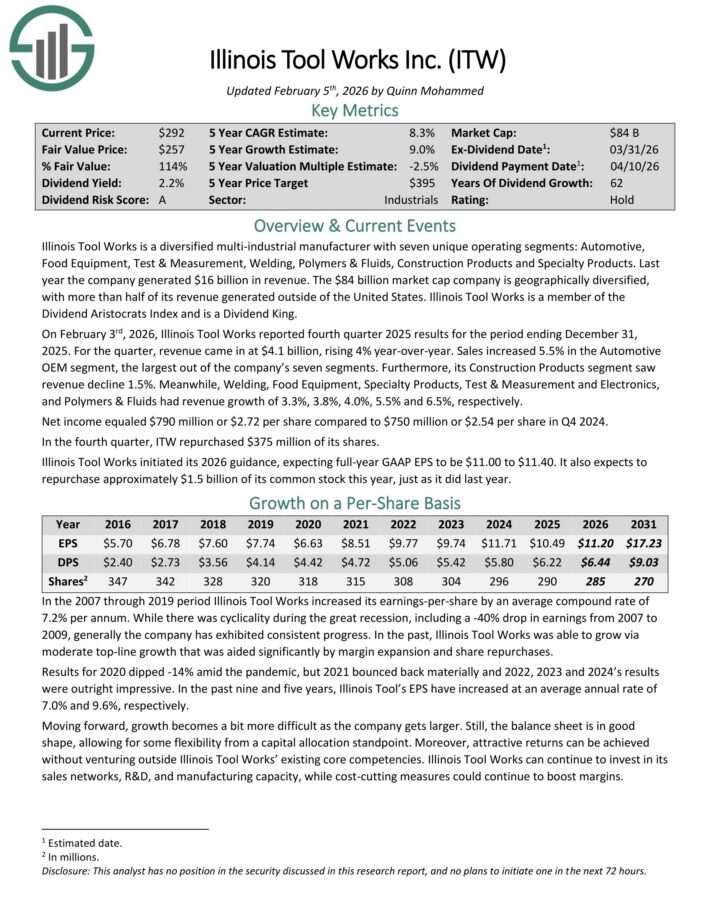
#9: Illinois Tool Works (ITW)
- 5-year expected annual returns: 10.8%
Illinois Tool Works is a diversified multi-industrial manufacturer with seven unique operating segments: Automotive, Food Equipment, Test & Measurement, Welding, Polymers & Fluids, Construction Products and Specialty Products.
Last year the company generated $15.9 billion in revenue. The $72 billion market cap company is geographically diversified, with more than half of its revenue generated outside of the United States.
Illinois Tool Works is a member of the Dividend Aristocrats Index and is a Dividend King.
On February 3rd, 2026, Illinois Tool Works reported fourth quarter 2025 results. For the quarter, revenue came in at $4.1 billion, rising 4% year-over-year.
Sales increased 5.5% in the Automotive OEM segment, the largest out of the company’s seven segments.
Furthermore, its Construction Products segment saw revenue decline 1.5%. Meanwhile, Welding, Food Equipment, Specialty Products, Test & Measurement and Electronics, and Polymers & Fluids had revenue growth of 3.3%, 3.8%, 4.0%, 5.5% and 6.5%, respectively.
Net income equaled $790 million or $2.72 per share compared to $750 million or $2.54 per share in Q4 2024. In the fourth quarter, ITW repurchased $375 million of its shares.
Illinois Tool Works initiated its 2026 guidance, expecting full-year GAAP EPS to be $11.00 to $11.40.
Click here to download our most recent Sure Analysis report on ITW (preview of page 1 of 3 shown below):
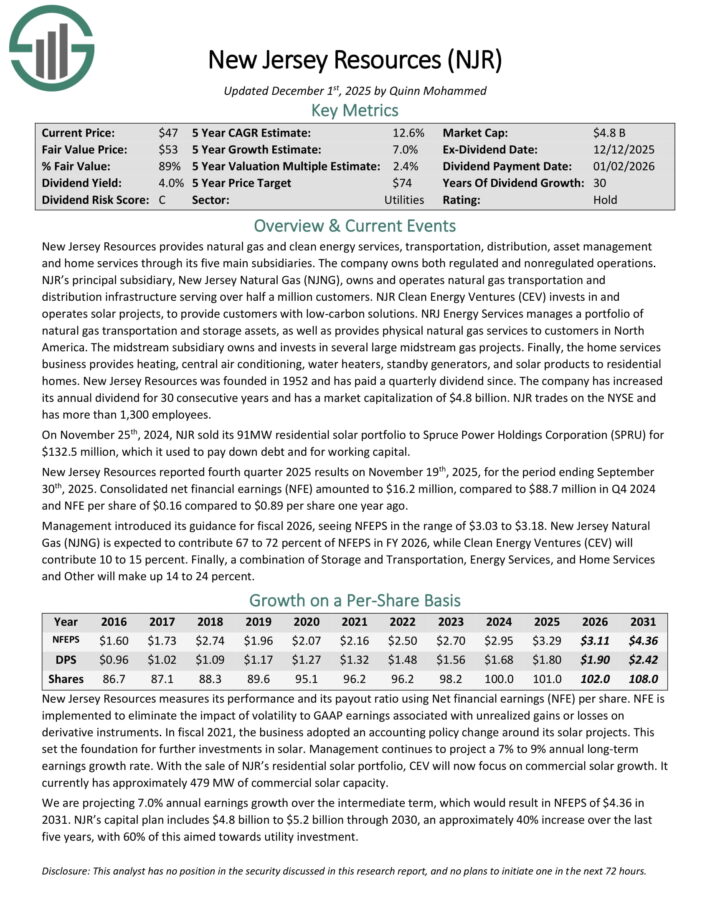
#8: New Jersey Resources (NJR)
- 5-year expected annual returns: 11.3%
New Jersey Resources provides natural gas and clean energy services, transportation, distribution, asset management and home services through its five main subsidiaries. The company owns both regulated and non-regulated operations.
NJR’s principal subsidiary, New Jersey Natural Gas (NJNG), owns and operates natural gas transportation and distribution infrastructure serving over half a million customers.
NJR Clean Energy Ventures (CEV) invests in and operates solar projects, to provide customers with low-carbon solutions.
NRJ Energy Services manages a portfolio of natural gas transportation and storage assets, as well as provides physical natural gas services to customers in North America.
New Jersey Resources was founded in 1952 and has paid a quarterly dividend since. The company has increased its annual dividend for 30 consecutive years.
New Jersey Resources reported fourth quarter 2025 results on November 19th, 2025. Consolidated net financial earnings (NFE) amounted to $16.2 million, compared to $88.7 million in Q4 2024 and NFE per share of $0.16 compared to $0.89 per share one year ago.
Management introduced its guidance for fiscal 2026, seeing NFEPS in the range of $3.03 to $3.18.
Click here to download our most recent Sure Analysis report on NJR (preview of page 1 of 3 shown below):
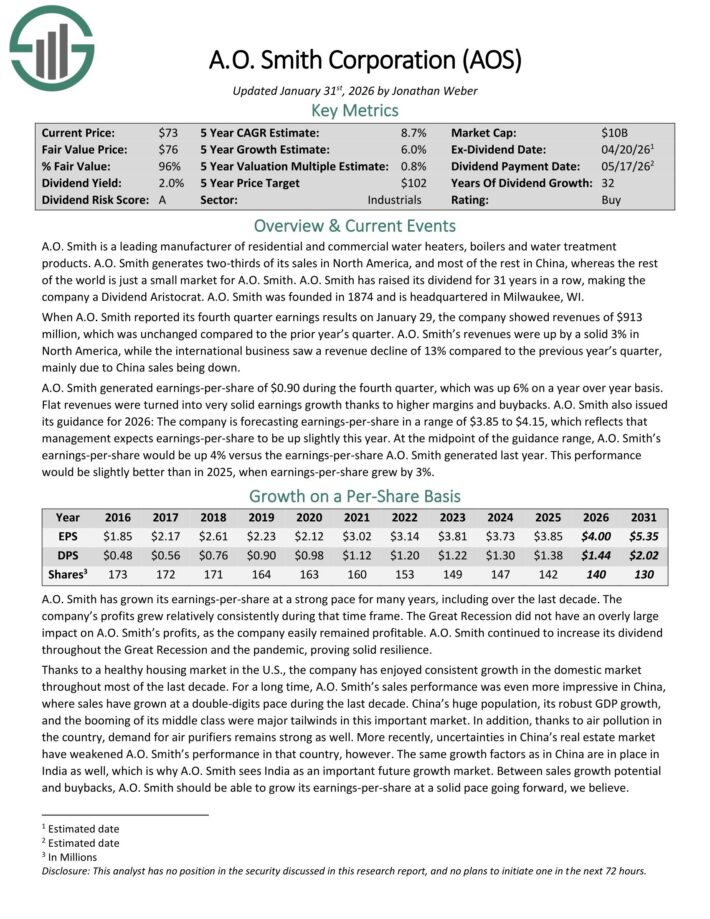
#7: A.O. Smith (AOS)
- 5-year expected annual returns: 11.6%
A.O. Smith is a leading manufacturer of residential and commercial water heaters, boilers and water treatment
products. It generates two-thirds of its sales in North America, and most of the rest in China.
A.O. Smith has raised its dividend for over 30 years in a row, making the company a Dividend Aristocrat. The company was founded in 1874 and is headquartered in Milwaukee, WI.
A.O. Smith generated earnings-per-share of $0.90 during the fourth quarter, which was up 6% on a year over year basis.
Flat revenues were turned into very solid earnings growth thanks to higher margins and buybacks. A.O. Smith also issued its guidance for 2026.
The company is forecasting earnings-per-share in a range of $3.85 to $4.15, which reflects that management expects earnings-per-share to be up slightly this year.
At the midpoint of the guidance range, A.O. Smith’s earnings-per-share would be up 4% versus the earnings-per-share A.O. Smith generated last year.
Click here to download our most recent Sure Analysis report on AOS (preview of page 1 of 3 shown below):
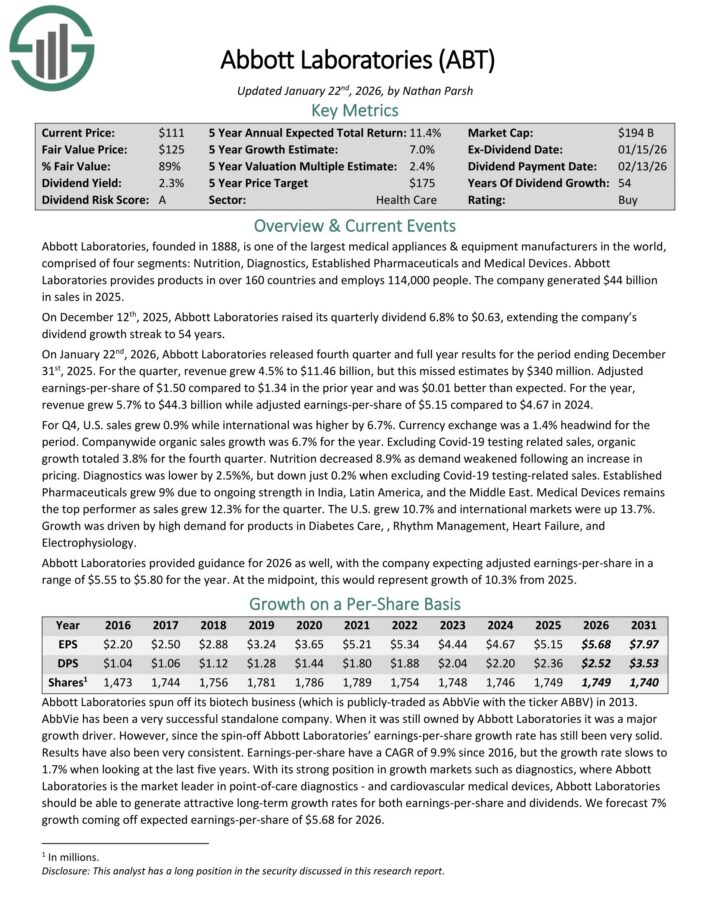
#6: Abbott Laboratories (ABT)
- 5-year expected annual returns: 12.0%
Abbott Laboratories, founded in 1888, is one of the largest medical appliances & equipment manufacturers in the world, comprised of four segments: Nutrition, Diagnostics, Established Pharmaceuticals and Medical Devices.
Abbott Laboratories provides products in over 160 countries and employs 114,000 people. The company generated $44 billion in sales in 2025.
On December 12th, 2025, Abbott Laboratories raised its quarterly dividend 6.8% to $0.63, extending the company’s dividend growth streak to 54 years.
On January 22nd, 2026, Abbott Laboratories released fourth quarter and full year results for the period ending December 31st, 2025. For the quarter, revenue grew 4.5% to $11.46 billion, but this missed estimates by $340 million.
Adjusted earnings-per-share of $1.50 compared to $1.34 in the prior year and was $0.01 better than expected. For the year, revenue grew 5.7% to $44.3 billion while adjusted earnings-per-share of $5.15 compared to $4.67 in 2024.
For Q4, U.S. sales grew 0.9% while international was higher by 6.7%. Currency exchange was a 1.4% headwind for the period.
Abbott Laboratories provided guidance for 2026 as well, with the company expecting adjusted earnings-per-share in a range of $5.55 to $5.80 for the year. At the midpoint, this would represent growth of 10.3% from 2025.
Click here to download our most recent Sure Analysis report on ABT (preview of page 1 of 3 shown below):
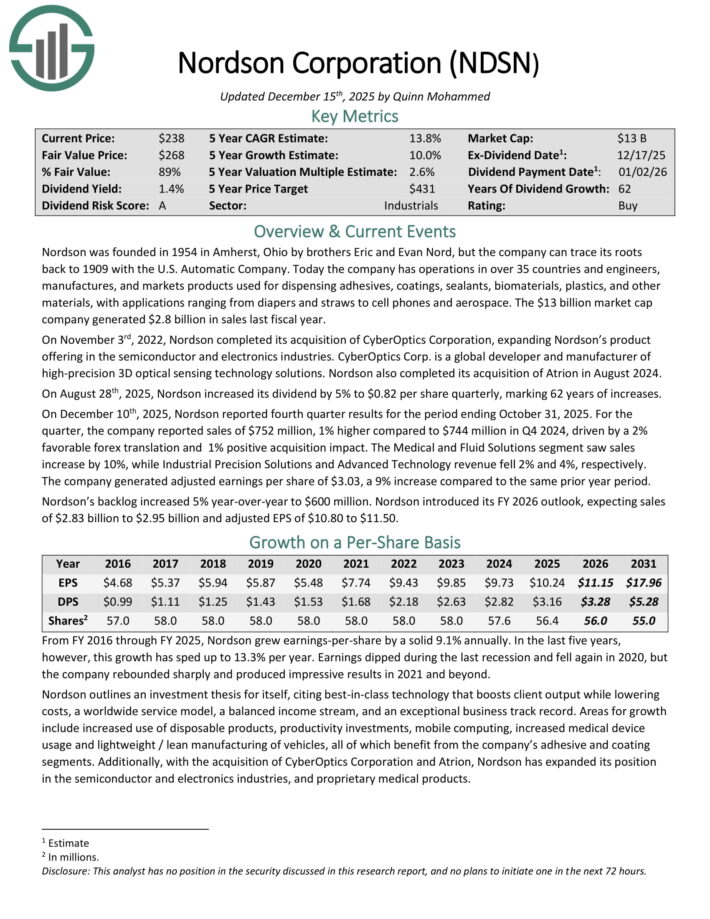
#5: Nordson Corporation (NDSN)
- 5-year expected annual returns: 12.3%
Nordson has operations in over 35 countries and engineers, manufactures, and markets products used for dispensing adhesives, coatings, sealants, biomaterials, plastics, and other materials, with applications ranging from diapers and straws to cell phones and aerospace.
The company generated $2.7 billion in sales last fiscal year.
On December 10th, 2025, Nordson reported fourth quarter results for the period ending October 31, 2025. For the quarter, the company reported sales of $752 million, 1% higher compared to $744 million in Q4 2024, driven by a 2% favorable forex translation and 1% positive acquisition impact.
The Medical and Fluid Solutions segment saw sales increase by 10%, while Industrial Precision Solutions and Advanced Technology revenue fell 2% and 4%, respectively.
The company generated adjusted earnings per share of $3.03, a 9% increase compared to the same prior year period..
Click here to download our most recent Sure Analysis report on NDSN (preview of page 1 of 3 shown below):
#4: Hormel Foods (HRL)
- 5-year expected annual returns: 14.9%
Hormel Foods was founded in 1891 in Minnesota. Since that time, the company has grown into a $13 billion market capitalization juggernaut in the food products industry with about $12 billion in annual revenue.
Hormel has kept its core competency as a processor of meat products for well over a hundred years but has also grown into other business lines through acquisitions.
The company sells its products in 80 countries worldwide, and its brands include Skippy, SPAM, Applegate, Justin’s, and more than 30 others. In addition, Hormel is a member of the Dividend Kings, having increased its dividend for 60 consecutive years.
Hormel posted fourth quarter and full-year earnings on December 4th, 2025.
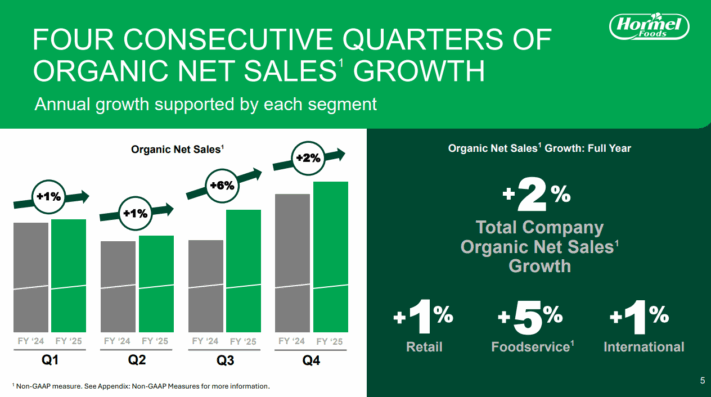
Source: Investor Presentation
The company saw 32 cents in adjusted earnings-per-share for the quarter, beating estimates by two cents. Revenue was up 1.6% year-over-year and missed estimates by $30 million, coming in at $3.19 billion.
Adjusted operating margin was 7.7% of revenue, while cash flow from operations was $323 million. Volumes in the fourth quarter were flat in the retail segment, down 5% in foodservice, and down 7% in the international segment.
Hormel raised its dividend for the 60th consecutive year, this time adding 0.9% to a new payout of $1.20 per share annually. We start 2026 with an estimate of $1.47 in adjusted earnings-per-share.
Click here to download our most recent Sure Analysis report on HRL (preview of page 1 of 3 shown below):

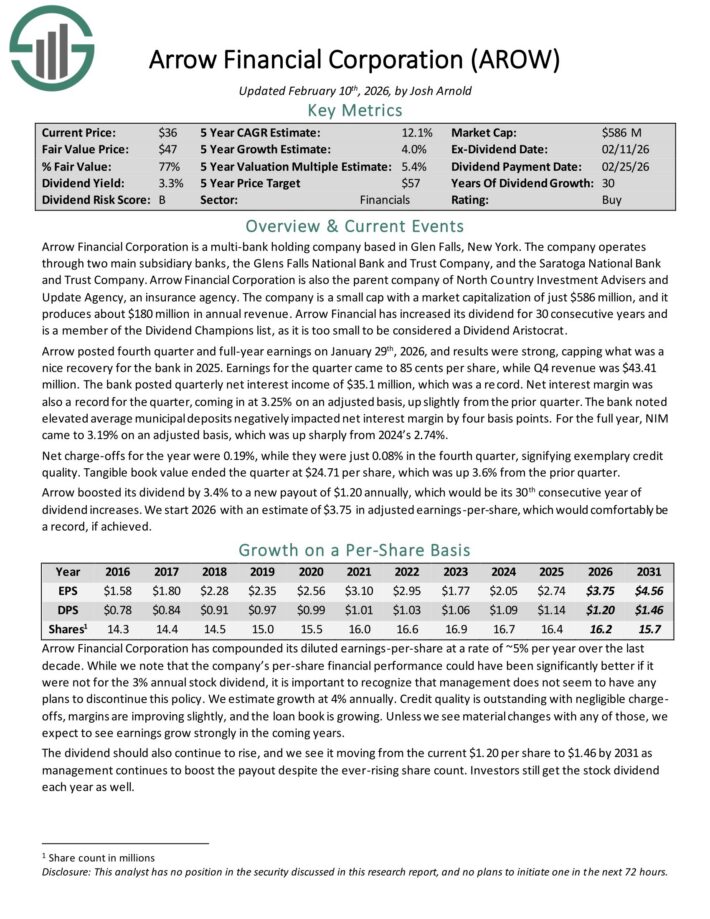
#3: Arrow Financial Corporation (AROW)
- 5-year expected annual returns: 15.3%
Arrow Financial Corporation is a multi-bank holding company based in Glen Falls, New York. The company operates through two main subsidiary banks, the Glens Falls National Bank and Trust Company, and the Saratoga National Bank and Trust Company.
Arrow Financial Corporation is also the parent company of North Country Investment Advisers and Update Agency, an insurance agency. The company is a small cap, and it produces about $163 million in annual revenue.
Arrow posted fourth quarter and full-year earnings on January 29th, 2026. Earnings for the quarter came to 85 cents per share, while Q4 revenue was $43.41 million.
The bank posted quarterly net interest income of $35.1 million, which was a record. Net interest margin was also a record for the quarter, coming in at 3.25% on an adjusted basis, up slightly from the prior quarter.
The bank noted elevated average municipal deposits negatively impacted net interest margin by four basis points.
For the full year, NIM came to 3.19% on an adjusted basis, which was up sharply from 2024’s 2.74%.
Net charge-offs for the year were 0.19%, while they were just 0.08% in the fourth quarter, signifying exemplary credit quality. Tangible book value ended the quarter at $24.71 per share, which was up 3.6% from the prior quarter.
Arrow boosted its dividend by 3.4% to a new payout of $1.20 annually, which would be its 30th consecutive year of dividend increases.
Click here to download our most recent Sure Analysis report on AROW (preview of page 1 of 3 shown below):
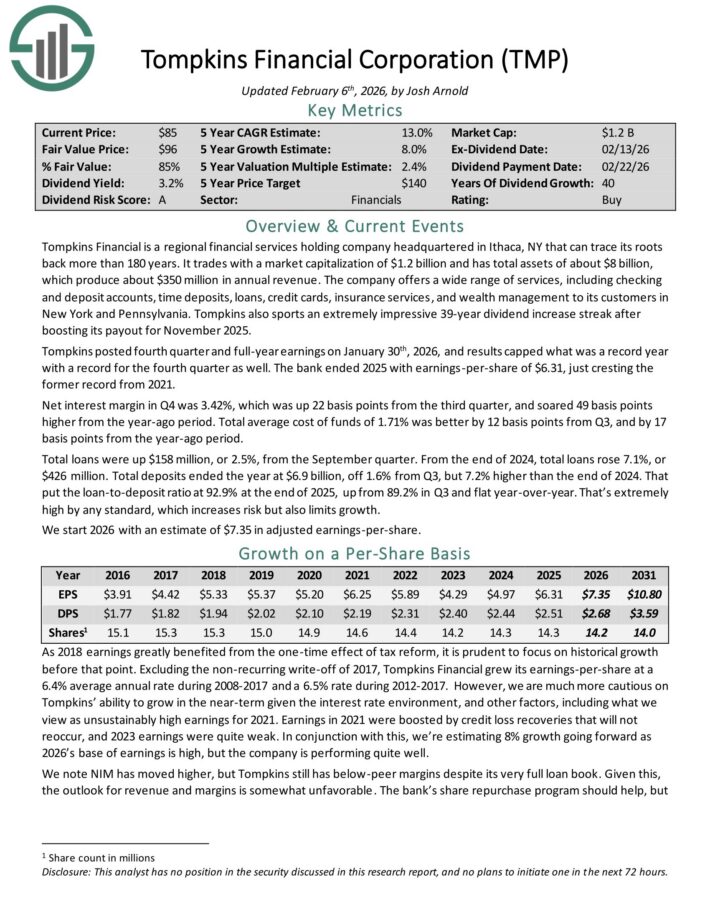
#2: Tompkins Financial (TMP)
- 5-year expected annual returns: 16.4%
Tompkins Financial is a regional financial services holding company headquartered in Ithaca, NY that can trace its roots back more than 180 years. It has total assets of about $8 billion, which produce about $300 million in annual revenue.
The company offers a wide range of services, including checking and deposit accounts, time deposits, loans, credit cards, insurance services, and wealth management to its customers in New York and Pennsylvania.
Tompkins posted fourth quarter and full-year earnings on January 30th, 2026, and results capped what was a record year with a record for the fourth quarter as well.
The bank ended 2025 with earnings-per-share of $6.31, just cresting the former record from 2021.
Net interest margin in Q4 was 3.42%, which was up 22 basis points from the third quarter, and soared 49 basis points higher from the year-ago period. Total average cost of funds of 1.71% was better by 12 basis points from Q3, and by 17 basis points from the year-ago period.
Total loans were up $158 million, or 2.5%, from the September quarter. From the end of 2024, total loans rose 7.1%, or $426 million. Total deposits ended the year at $6.9 billion, off 1.6% from Q3, but 7.2% higher than the end of 2024.
That put the loan-to-deposit ratio at 92.9% at the end of 2025, up from 89.2% in Q3 and flat year-over-year. That’s extremely high by any standard, which increases risk but also limits growth.
Click here to download our most recent Sure Analysis report on TMP (preview of page 1 of 3 shown below):
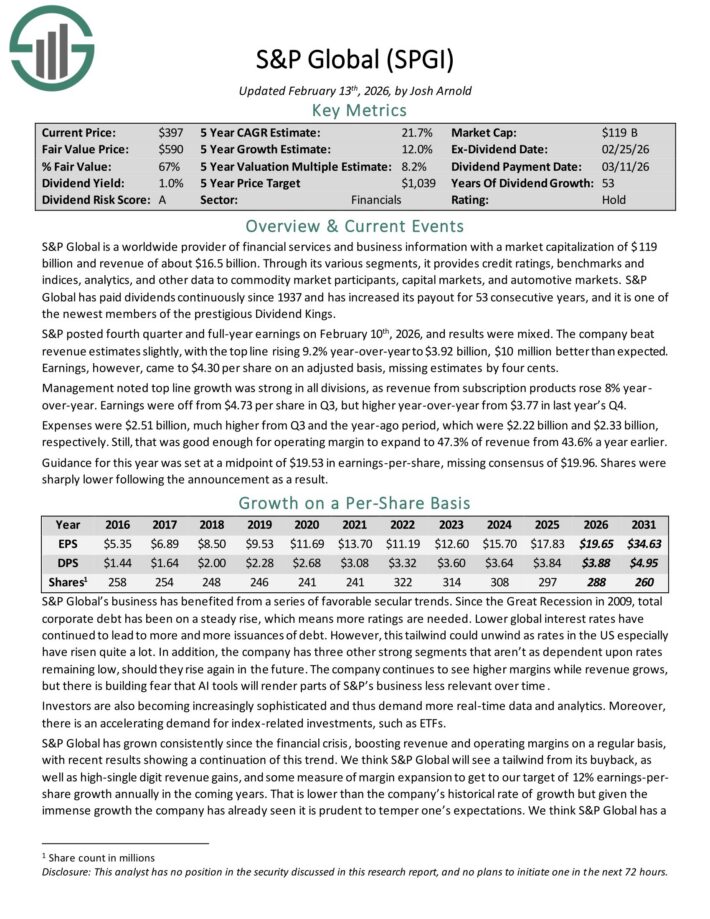
#1: S&P Global (SPGI)
- 5-year expected annual returns: 20.0%
S&P Global is a worldwide provider of financial services and business information with revenue of over $15 billion. Through its various segments, it provides credit ratings, benchmarks and indices, analytics, and other data to commodity market participants, capital markets, and automotive markets.
S&P Global has paid dividends continuously since 1937 and has increased its payout for 52 consecutive years, and it is one of the newest members of the prestigious Dividend Kings.
S&P posted fourth quarter and full-year earnings on February 10th, 2026, and results were mixed. The company beat revenue estimates slightly, with the top line rising 9.2% year-over-year to $3.92 billion, $10 million better than expected.
Earnings, however, came to $4.30 per share on an adjusted basis, missing estimates by four cents. Management noted top line growth was strong in all divisions, as revenue from subscription products rose 8% year-over-year. Earnings were off from $4.73 per share in Q3, but higher year-over-year from $3.77 in last year’s Q4.
Expenses were $2.51 billion, much higher from Q3 and the year-ago period, which were $2.22 billion and $2.33 billion, respectively. Still, that was good enough for operating margin to expand to 47.3% of revenue from 43.6% a year earlier.
Click here to download our most recent Sure Analysis report on SPGI (preview of page 1 of 3 shown below):
Final Thoughts and Additional Resources
Enrolling in DRIP stocks can be a great way to compound your portfolio income over time. Additional resources are listed below for investors interested in further research for DRIP stocks.
For dividend growth investors interested in DRIP stocks, the 15 companies mentioned in this article are a great place to start. Each business is very shareholder friendly, as evidenced by their long dividend histories and their willingness to offer investors no-fee DRIP stocks.
At Sure Dividend, we often advocate for investing in companies with a high probability of increasing their dividends each and every year.
If that strategy appeals to you, it may be useful to browse through the following databases of dividend growth stocks:
- The Dividend Kings List is even more exclusive than the Dividend Aristocrats. It is comprised of 57 stocks with 50+ years of consecutive dividend increases.
- The High Dividend Stocks List: stocks that appeal to investors interested in the highest yields of 5% or more.
- The Monthly Dividend Stocks List: stocks that pay dividends every month, for 12 dividend payments per year.