Updated on September 26th, 2025 by Bob Ciura
Income investors are always on the hunt for high-quality dividend stocks. There are many ways to measure high-quality stocks. One way for investors to find great dividend stocks is to focus on those with the longest histories of raising dividends.
With this in mind, we created a downloadable list of over 130 Dividend Champions.
You can download your free copy of the Dividend Champions list, along with relevant financial metrics like price-to-earnings ratios, dividend yields, and payout ratios, by clicking on the link below:
Investors are likely familiar with the Dividend Aristocrats, a group of 69 stocks in the S&P 500 Index with 25+ consecutive years of dividend increases.
Meanwhile, investors should also familiarize themselves with the Dividend Champions, which have also raised their dividends for at least 25 years in a row.
While their length of dividend increases is the same, leading to some overlap, there are also some important differences between the Dividend Aristocrats and Dividend Champions.
As a result, the Dividend Champions list is much more expansive. There are many high-quality Dividend Champions that are not included on the Dividend Aristocrats list.
This article will discuss the Dividend Champions, and an analysis of our top 7 Dividend Champions now, ranked according to expected total returns in the Sure Analysis Research Database.
Table of Contents
You can instantly jump to any specific section of the article by clicking on the links below:
- Overview of Dividend Champions
- Top Dividend Champion #7: PPG Industries (PPG)
- Top Dividend Champion #6: Becton, Dickinson & Co. (BDX)
- Top Dividend Champion #5: Sonoco Products (SON)
- Top Dividend Champion #4: Novo Nordisk (NVO)
- Top Dividend Champion #3: H2O America (HTO)
- Top Dividend Champion #2: FactSet Research Systems (FDS)
- Top Dividend Champion #1: Stepan Co. (SCL)
Overview of Dividend Champions
The requirement to become a Dividend Champion is simple: 25+ years of consecutive annual dividend increases. The Dividend Aristocrats have the same requirement when it comes to number of years, but with a few additional requirements.
To be a Dividend Aristocrat, a company must also be included in the S&P 500 Index, must have a float-adjusted market cap of at least $3 billion, and must have an average daily value traded of at least $5 million.
These added requirements preclude many companies that possess a sufficient track record of annual dividend increases, but do not qualify based on market cap or liquidity reasons.
As a result, while there is some overlap between the Dividend Aristocrats and the Dividend Champions, there are also many Dividend Champions that are not Dividend Aristocrats.
Income investors might want to consider these stocks due to their impressive histories of annual dividend increases, so we have compiled them in the downloadable spreadsheet above.
In addition, we have ranked the top 7 Dividend Champions according to total expected annual returns over the next five years. Our top 7 Dividend Champions right now are ranked below.
The Top 7 Dividend Champions To Buy Right Now
The following 7 stocks represent Dividend Champions with at least 25 consecutive years of dividend increases, but they also have durable competitive advantages, long-term growth potential, and high expected total returns.
Stocks have been ranked by expected total annual return over the next five years, from lowest to highest.
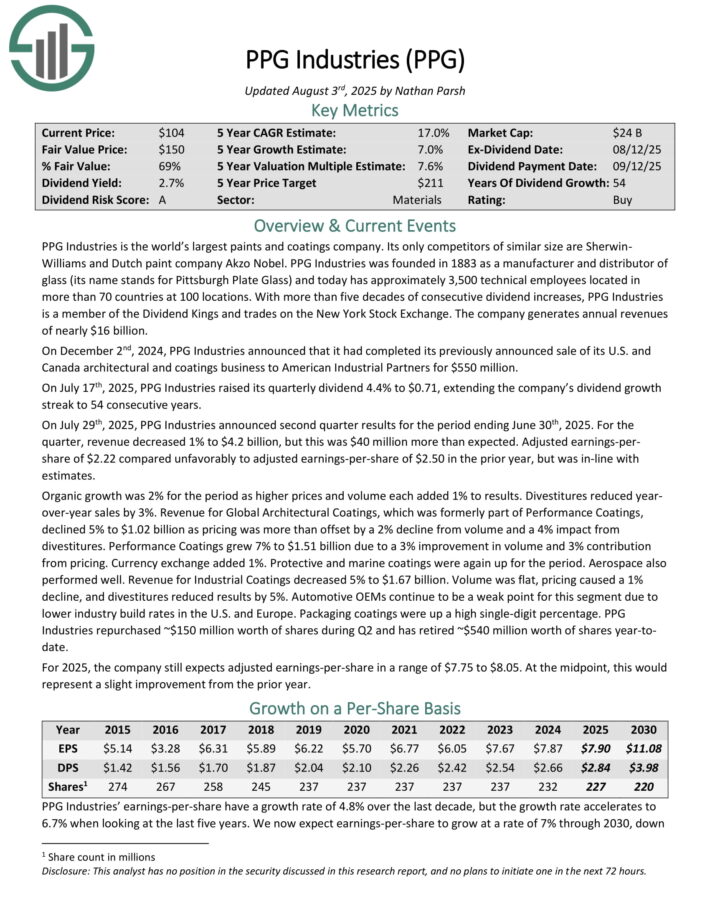
Top Dividend Champion #7: PPG Industries (PPG)
- 5-year expected returns: 17.0%
PPG Industries is the world’s largest paints and coatings company. Its only competitors of similar size are Sherwin-Williams and Dutch paint company Akzo Nobel.
PPG Industries was founded in 1883 as a manufacturer and distributor of glass (its name stands for Pittsburgh Plate Glass) and today has approximately 3,500 technical employees located in more than 70 countries at 100 locations.
On July 17th, 2025, PPG Industries raised its quarterly dividend 4.4% to $0.71, extending the company’s dividend growth streak to 54 consecutive years.
On July 29th, 2025, PPG Industries announced second-quarter results. For the quarter, revenue decreased 1% to $4.2 billion, but this was $40 million more than expected. Adjusted earnings-per-share of $2.22 compared unfavorably to adjusted earnings-per-share of $2.50 in the prior year, but was in-line with estimates.
Organic growth was 2% for the period as higher prices and volume each added 1% to results. Divestitures reduced year-over-year sales by 3%. Revenue for Global Architectural Coatings declined 5% to $1.02 billion as pricing was more than offset by a 2% decline from volume and a 4% impact from divestitures.
Performance Coatings grew 7% to $1.51 billion due to a 3% improvement in volume and 3% contribution from pricing. Currency exchange added 1%. Protective and marine coatings were again up for the period.
PPG Industries repurchased ~$150 million worth of shares during Q2 and has retired ~$540 million worth of shares year-to-date.
Click here to download our most recent Sure Analysis report on PPG (preview of page 1 of 3 shown below):
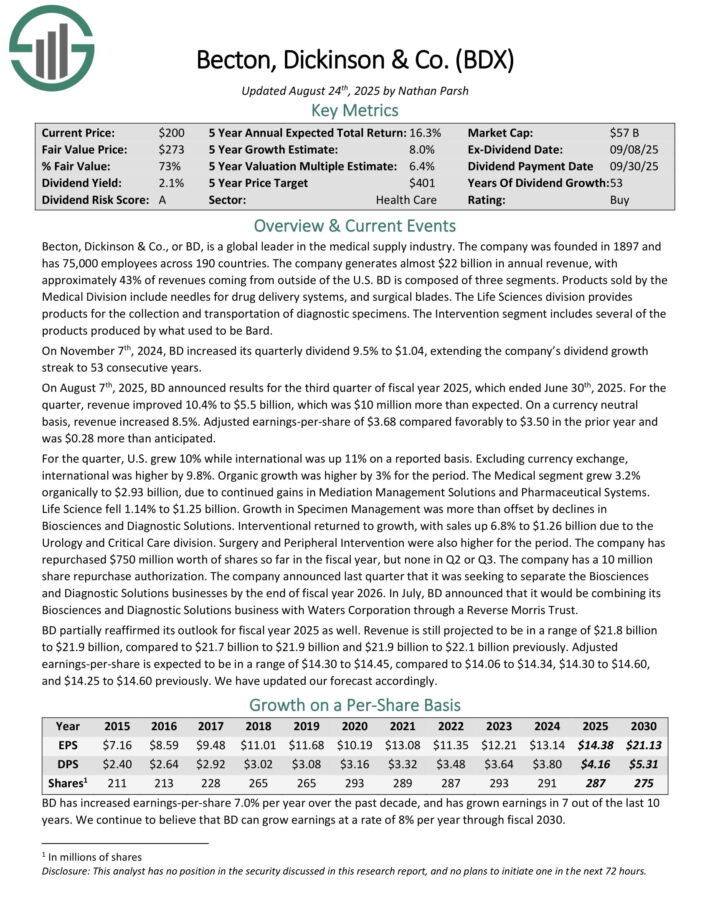
Top Dividend Champion #6: Becton Dickinson & Co. (BDX)
- 5-year expected returns: 18.7%
Becton, Dickinson & Co. is a global leader in the medical supply industry. The company was founded in 1897 and has 75,000 employees across 190 countries.
The company generates about $20 billion in annual revenue, with approximately 43% of revenues coming from outside of the U.S.
Becton, Dickinson & Co., or BD, is a global leader in the medical supply industry. The company generates almost $22 billion in annual revenue, with approximately 43% of revenues coming from outside of the U.S.
On August 7th, 2025, BD announced results for the third quarter of fiscal year 2025, which ended June 30th, 2025. For the quarter, revenue improved 10.4% to $5.5 billion, which was $10 million more than expected.
On a currency neutral basis, revenue increased 8.5%. Adjusted earnings-per-share of $3.68 compared favorably to $3.50 in the prior year and was $0.28 more than anticipated.
For the quarter, U.S. grew 10% while international was up 11% on a reported basis. Excluding currency exchange, international was higher by 9.8%. Organic growth was higher by 3% for the period.
The Medical segment grew 3.2% organically to $2.93 billion, due to continued gains in Mediation Management Solutions and Pharmaceutical Systems.
Life Science fell 1.14% to $1.25 billion. Growth in Specimen Management was more than offset by declines in Biosciences and Diagnostic Solutions. Interventional returned to growth, with sales up 6.8% to $1.26 billion due to the Urology and Critical Care division. Surgery and Peripheral Intervention were also higher for the period.
BD partially reaffirmed its outlook for fiscal year 2025 as well. Revenue is still projected to be in a range of $21.8 billion to $21.9 billion, compared to $21.7 billion to $21.9 billion and $21.9 billion to $22.1 billion previously. Adjusted earnings-per-share is expected to be in a range of $14.30 to $14.45.
Click here to download our most recent Sure Analysis report on BDX (preview of page 1 of 3 shown below):
Top Dividend Champion #5: Sonoco Products (SON)
- 5-year expected returns: 18.8%
Sonoco Products provides packaging, industrial products and supply chain services to its customers. The markets that use the company’s products include those in the appliances, electronics, beverage, construction and food industries.
The company generates over $5 billion in annual sales. Sonoco Products is now composed of 2 major segments, Consumer Packaging, and Industrial Packaging, with all other businesses listed as “All Other”.
On April 16th, 2025, Sonoco Products raised its quarterly dividend 1.9% to $0.53, extending the company’s dividend growth streak to 49 consecutive years.
On July 23rd, 2025, Sonoco Products announced second quarter results for the period ending June 29th, 2025. For the quarter, revenue grew 17.9% to $1.91 billion, which was in-line with estimates. Adjusted earnings-per-share of $1.37 compared to $1.28 in the prior year, but was $0.08 less than expected.
Revenues and earnings benefited from the addition of Eviosys. For the quarter, Consumer Packaging revenues surged 110% to $1.23 billion, mostly due to contributions from Eviosys.
Volume growth was strong and favorable currency exchange rates also aided results. Industrial Paper Packing sales fell 2% to $588 million due to the impact of foreign currency exchange rates and lower volume following two plant divestitures in China last year.
Click here to download our most recent Sure Analysis report on Sonoco (SON) (preview of page 1 of 3 shown below):

Top Dividend Champion #4: Novo Nordisk (NVO)
- 5-year expected returns: 20.1%
Novo Nordisk A/S ADR is a large global pharmaceutical company headquartered in Denmark. The company focuses on two core business segments: Diabetes & Obesity Care and Rare Diseases.
The Diabetes & Obesity Care segment manufactures insulin, related delivery systems, oral anti-diabetic products, and products to treat obesity.
The Rare Diseases segment manufactures products for hemophilia and other chronic diseases. Novo Nordisk derives ~92% of revenue from diabetes and obesity.
The company’s products are marketed in 170 countries but approximately 48% of net sales are from North America and the rest is international sales.1 Total revenue was nearly $40.7B in 2024.
Novo Nordisk reported solid H1 2025 results on August 6th, 2025. Company-wide sales were up 16% in Danish kroner to 154,944M ($24,300M) from 133,409 ($20,922M) and diluted earnings per share rose 23% to 12.49 DKK ($1.96) from 10.17 DKK ($1.59) on a year-over-year basis.
Diabetes & Obesity sales increased 16% to 145,406M DKK ($22,804M) driven by increases in Ozempic and Rybelsus (GLP-1), Wegovy (obesity), long-acting insulin, and fast-acting insulin, offset by lower sales for human insulin, Saxenda (obesity), Victoza (GLP-1), and flat premix insulin.
The Rare Disease segment sales rose 14% to 9,538M DKK ($1,496M) caused by rising rare blood and endocrine disorders drugs.
The firm is expanding its blockbuster GLP-1 and obesity drugs to other indications and dosing sizes. The company lowered its outlook to 8 – 14% sales growth and 10% – 16% operating profit growth in 2025.
Click here to download our most recent Sure Analysis report on NVO (preview of page 1 of 3 shown below):

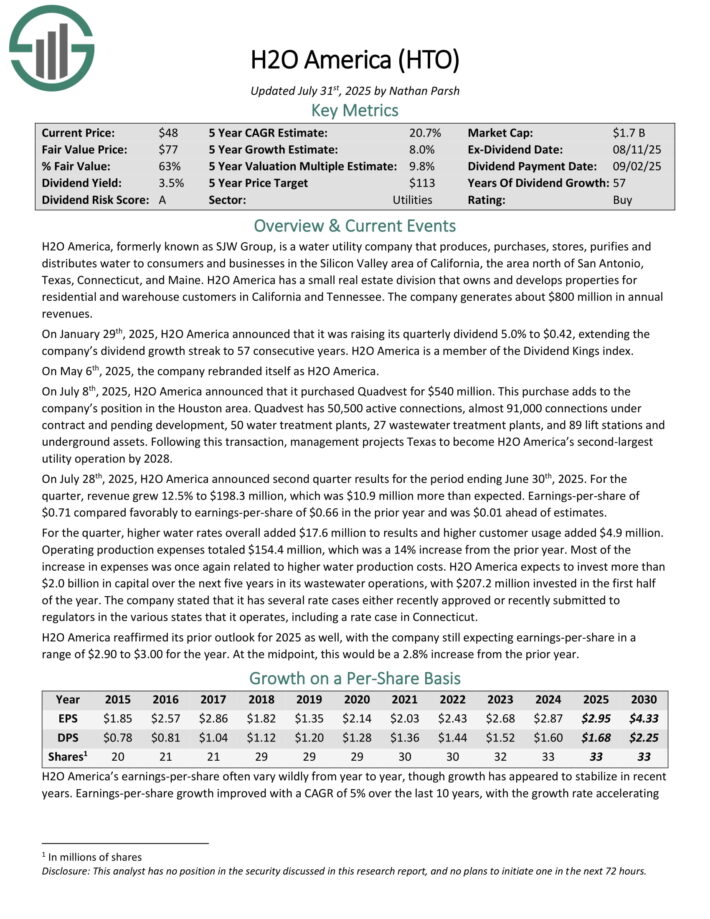
Top Dividend Champion #3: H2O America (HTO)
- 5-year expected returns: 20.7%
H2O America, formerly known as SJW Group, is a water utility company that produces, purchases, stores, purifies and distributes water to consumers and businesses in the Silicon Valley area of California, the area north of San Antonio, Texas, Connecticut, and Maine.
It also has a small real estate division that owns and develops properties for residential and warehouse customers in California and Tennessee. The company generates about $670 million in annual revenues.
On July 8th, 2025, H2O America announced that it purchased Quadvest for $540 million. This purchase adds to the company’s position in the Houston area.
Quadvest has 50,500 active connections, almost 91,000 connections under contract and pending development, 50 water treatment plants, 27 wastewater treatment plants, and 89 lift stations and underground assets.
On July 28th, 2025, H2O America announced second quarter results for the period ending June 30th, 2025. For the quarter, revenue grew 12.5% to $198.3 million, which was $10.9 million more than expected.
Earnings-per-share of $0.71 compared favorably to earnings-per-share of $0.66 in the prior year and was $0.01 ahead of estimates.
For the quarter, higher water rates overall added $17.6 million to results and higher customer usage added $4.9 million. Operating production expenses totaled $154.4 million, which was a 14% increase from the prior year.
Click here to download our most recent Sure Analysis report on HTO (preview of page 1 of 3 shown below):
Top Dividend Champion #2: FactSet Research Systems (FDS)
- 5-year expected returns: 21.3%
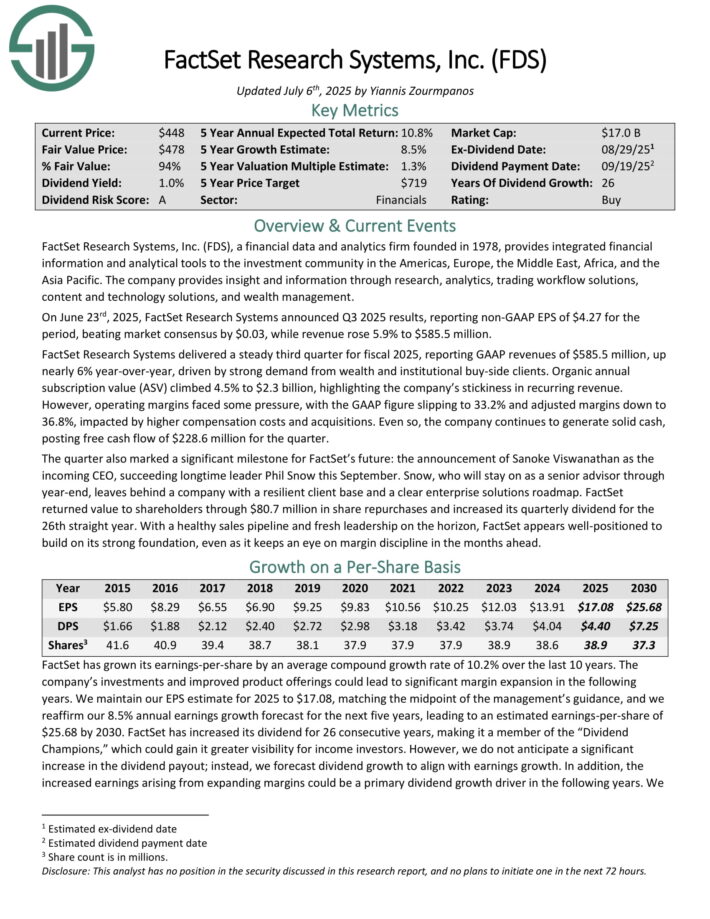
FactSet Research Systems, a financial data and analytics firm founded in 1978, provides integrated financial information and analytical tools to the investment community in the Americas, Europe, the Middle East, Africa, and Asia-Pacific.
The company provides insight and information through research, analytics, trading workflow solutions, content and technology solutions, and wealth management.
On June 23rd, 2025, FactSet Research Systems announced Q3 2025 results, reporting non-GAAP EPS of $4.27 for the period, beating market consensus by $0.03, while revenue rose 5.9% to $585.5 million.
It delivered a steady third quarter for fiscal 2025, reporting GAAP revenues of $585.5 million, up nearly 6% year-over-year, driven by strong demand from wealth and institutional buy-side clients.
Organic annual subscription value (ASV) climbed 4.5% to $2.3 billion, highlighting the company’s stickiness in recurring revenue.
However, operating margins faced some pressure, with the GAAP figure slipping to 33.2% and adjusted margins down to 36.8%, impacted by higher compensation costs and acquisitions.
Even so, the company continues to generate solid cash, posting free cash flow of $228.6 million for the quarter.
FactSet returned value to shareholders through $80.7 million in share repurchases and increased its quarterly dividend for the 26th straight year.
Click here to download our most recent Sure Analysis report on FDS (preview of page 1 of 3 shown below):
Top Dividend Champion #1: Stepan Co. (SCL)
- 5-year expected returns: 24.3%
Stepan manufactures basic and intermediate chemicals, including surfactants, specialty products, germicidal and fabric softening quaternaries, phthalic anhydride, polyurethane polyols and special ingredients for the food, supplement, and pharmaceutical markets.
It is organized into three distinct business lines: surfactants, polymers, and specialty products. These businesses serve a wide variety of end markets, meaning that Stepan is not beholden to just a handful of industries.
The surfactants business is Stepan’s largest by revenue, accounting for ~68% of total sales in the most recent quarter. A surfactant is an organic compound that contains both water-soluble and water-insoluble components.
Stepan posted second quarter earnings on July 30th, 2025, and results were much worse than expected on both the top and bottom lines. Adjusted earnings-per-share came to 52 cents, which was nowhere close to estimates for 90 cents. Revenue was up 7% year-over-year to $595 million, missing estimates by $3.6 million.
Surfactant sales were $412 million, with selling prices soaring 11% on pass-through of raw material costs, primarily. Sales volumes were down 1%. Polymers net sales were up 2% to $163 million. Volumes were up 7% but selling prices declined 7%. Specialty Product sales were $20.5 million, up 22%, but margins worsened.
Adjusted EBITDA was $51.4 million, up 8% year-over-year. Adjusted net income was $12 million. Cash from operations came to $11.2 million, and free cash flow was negative $14.4 million on higher working capital requirements, as well as raw material builds.
Click here to download our most recent Sure Analysis report on SCL (preview of page 1 of 3 shown below):

Final Thoughts
The various lists of stocks by length of dividend history are a good resource for investors who focus on high-quality dividend stocks.
In order for a company to raise its dividend for at least 25 years, it must have durable competitive advantages, highly profitable businesses, and leadership positions in their respective industries.
They also have long-term growth potential and the ability to navigate recessions while continuing to raise their dividends.
The top 7 Dividend Champions presented in this article have long histories of dividend growth, and the combination of high dividend yields, low valuations, and future earnings growth potential make them attractive buys right now.
The Dividend Champions list is not the only way to quickly screen for stocks that regularly pay rising dividends.
- The Dividend Kings List is even more exclusive than the Dividend Aristocrats. It is comprised of 56 stocks with 50+ years of consecutive dividend increases.
- The High Dividend Stocks List: stocks that appeal to investors interested in the highest yields of 5% or more.
- The Monthly Dividend Stocks List: stocks that pay dividends every month, for 12 dividend payments per year.