Updated on October 6th, 2026 by Nikolaos Sismanis
Master Limited Partnerships – or MLPs, for short – offer
- Tax-advantaged income
- High yields well in excess of market averages
- The bulk of corporate cash flows returned to shareholders through distributions
An example of a typical MLP is an organization involved in the midstream energy industry.
- Midstream energy companies are in the business of transporting oil, primarily through pipelines
- Pipeline companies make up the vast majority of MLPs
Since MLPs typically offer high yields, they are naturally appealing for income investors.
With this in mind, we created a full downloadable list of over 50 MLPs.
You can download the Excel spreadsheet (along with relevant financial metrics like dividend yield and payout ratios) by clicking on the link below:

This comprehensive research report covers MLPs in depth, including our top 10 best MLPs today based on expected total returns.
Table Of Contents
- The History of Master Limited Partnerships
- MLP Tax Consequences
- Advantages & Disadvantages of Investing in MLPs
- #10 Best MLP: Star Group, L.P. (SGU)
- #9 Best MLP: Western Midstream Partners, LP (WES)
- #8 Best MLP: Enterprise Products Partners L.P. (EPD)
- #7 Best MLP: Delek Logistics Partners, LP (DKL)
- #6 Best MLP: Plains All American Pipeline, L.P. (PAA)
- #5 Best MLP: Plains GP Holdings, L.P. (PAGP)
- #4 Best MLP: Hess Midstream LP (HESM)
- #3 Best MLP: Global Partners LP (GLP)
- #2 Best MLP: Brookfield Infrastructure Partners L.P. (BIP)
- #1 Best MLP: Brookfield Renewable Partners L.P. (BEP)
- MLP ETFs, ETNs, & Mutual Funds
- Final Thoughts
The History of Master Limited Partnerships
MLPs were created in 1981 to allow certain business partnerships to issue publicly traded ownership interests.
The first MLP was Apache Oil Company, which was quickly followed by other energy MLPs, and then real estate MLPs.
The MLP space expanded rapidly until a great many companies from diverse industries operated as MLPs – including the Boston Celtics basketball team.
One important trend over the years, is that energy MLPs have grown from being roughly one-third of the total MLP universe to containing the vast majority of these securities.
Moreover, the energy MLP universe has evolved to be focused on midstream energy operations.
MLP Tax Consequences
Master limited partnerships are tax-advantaged investment vehicles. They are taxed differently than corporations. MLPs are pass-through entities. They are not taxed at the entity level.
Instead, all money distributed from the MLP to unit holders is taxed at the individual level.
Distributions are “passed through” because MLP investors are actually limited partners in the MLP, not shareholders. Because of this, MLP investors are called unit holders, not shareholders.
And, the money MLPs pay out to unit holders is called a distribution (not a dividend).
The money passed through from the MLP to unit holders is classified as either:
- Return of Capital
- Ordinary Income
MLPs tend to have lots of depreciation and other non-cash charges. This means they often have income that is far lower than the amount of cash they can actually distribute. The cash distributed less the MLPs income is a return of capital.
A return of capital is not technically income, from an accounting and tax perspective. Instead, it is considered as the MLP actually returning a portion of its assets to unit holders.
Now here’s the interesting part…
Returns of capital reduce your cost basis.
That means taxes for returns of capital are only due when you sell your MLP units. Returns of capital are tax-deferred.
Note: Return of capital taxes are also due in the event that your cost basis is less than $0. This only happens for very long-term holding, typically around 10 years or more at a minimum.
Each individual MLP is different, but on average an MLPs distribution is usually around 80% to 90% a return of capital, and 10% to 20% ordinary income.
This works out very well from a tax perspective. The images below compare what happens when a corporation and an MLP each have the same amount of cash to send to investors.
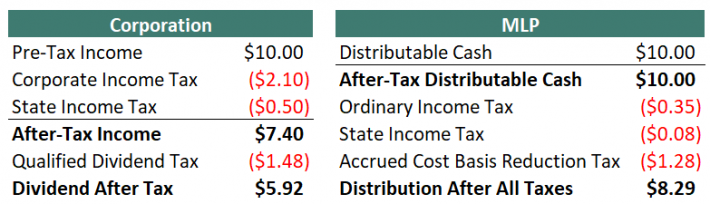
Note 1: Taxes are never simple. Some reasonable assumptions had to be made to simplify the table above. These are listed below:
- Corporate federal income tax rate of 21%
- Corporate state income tax rate of 5%
- Qualified dividend tax rate of 20%
- Distributable cash is 80% a return of capital, 20% ordinary income
- Personal federal tax rate of 22% less 20% for passive entity tax break
(19.6% total instead of 22%) - Personal state tax rate of 5% less 20% for passive entity tax break
(4% total instead of 5%) - Long-term capital gains tax rate of 20% less 20% for passive entity tax break
(16% total instead of 20%)
Note 2: In the MLP example, the accrued cost basis reduction tax is due when the MLP is sold, not annually come tax time.
As the tables above show, MLPs are far more efficient vehicles for returning cash to shareholders relative to corporations.
Additionally, in the example above $9.57 out of $10.00 distribution would be kept by the MLP investor until they sold because the bulk of taxes are from returns of capital and not due until the MLP is sold.
Return of capital and other issues discussed above do not matter when MLPs are held in a retirement account.
There is a different issue with holding MLPs in a retirement account, however. This includes 401(k), IRA, and Roth IRA accounts, among others.
When retirement plans conduct or invest in a business activity, they must file separate tax forms to report Unrelated Business Income (UBI) and may owe Unrelated Business Taxable Income (UBTI). UBTI tax brackets go up to 37% (the top personal rate).
MLPs issue K-1 forms for tax reporting. K-1s report business income, expense, and loss to owners. Therefore, MLPs held in retirement accounts may still qualify for taxes.
If UBI for all holdings in your retirement account is over $1,000, you must have your retirement account provider (typically, your brokerage) file Form 990-T.
You will want to file form 990-T as well if you have a UBI loss to get a loss carryforward for subsequent tax years. Failure to file form 990-T and pay UBIT can lead to severe penalties.
Fortunately, UBIs are often negative. It is a fairly rare occurrence to owe taxes on UBI.
The subject of MLP taxation can be complicated and confusing. Hiring a tax professional to aid in preparing taxes is a viable option for dealing with the complexity.
The bottom line is this: MLPs are tax-advantaged vehicles that are suited for investors looking for current income. It is fine to hold them in either taxable or non-taxable (retirement) accounts.
Since retirement accounts are already tax-deferred, holding MLPs in taxable accounts allows you to ‘get credit’ for the full effects of their unique structure.
4 Advantages & 6 Disadvantages of Investing in MLPs
MLPs are a unique asset class. As a result, there are several advantages and disadvantages to investing in MLPs. Many of these advantages and disadvantages are unique specifically to MLPs.
Advantages of MLPs
Advantage #1: Lower taxes
MLPs are tax-advantaged securities, as discussed in the Tax Consequences section above. Depending on your individual tax bracket, MLPs are able to generate around 40% more after-tax income for every pre-tax dollar they decide to distribute, versus Corporations.
Advantage #2: Tax-deferred income through returns of capital
In addition to lower taxes in general, 80% to 90% of the typical MLPs distributions are classified as returns of capital. Taxes are not owed (unless cost basis falls below 0) on return of capital distributions until the MLP is sold.
This creates the favorable situation of tax-deferred income.
Tax-deferred income is especially beneficial for retirees as return on capital taxes may not need to be paid throughout retirement.
Advantage #3: Diversification from other asset classes
Investing in MLPs provides added diversification in a balanced portfolio. Diversification can be measured by the correlation in return series between asset classes.
MLPs are excellent diversifiers, having either a near zero or negative correlation to corporate bonds, government bonds, and gold.
Additionally, they have a correlation coefficient of less than 0.6 to both REITs and the S&P 500. This makes MLPs an excellent addition to a diversified portfolio.
Source: Portfolio Visualizer
Advantage #4: Typically very high yields
MLPs tend to have high yields far in excess of the broader market. The 10 securities in this ranking currently yield between 5.0% and 8.4%, illustrating their income appeal. And some individual MLPs have yields above 10%.
Disadvantages of MLPs
Disadvantage #1: Complicated tax situation
MLPs can create a headache come tax season. MLPs issue K-1’s and are generally more time-consuming and complicated to correctly calculate taxes than common stocks.
Disadvantage #2: Potential additional paperwork if held in a retirement account
In addition, MLPs create extra paperwork and complications when invested through a retirement account because they potentially create unrelated business income (UBI). See the Tax Consequences section above for more on this.
Disadvantage #3: Little diversification within the MLP asset class
While MLPs provide significant diversification versus other asset classes, there is little diversification within the MLP structure.
The majority of publicly traded MLPs are oil and gas pipeline businesses. There are some exceptions, but in general MLP investors are investing in energy pipelines and not much else.
Because of this, it would be unwise to allocate all or a majority of one’s portfolio to this asset class.
Disadvantage #4: Incentive Distribution Rights (IDRs)
MLP investors are limited partners in the partnership. The MLP form also has a general partner.
The general partner is usually the management and ownership group that controls the MLP, even if they own a very small percentage of the actual MLP.
Incentive Distribution Rights, or IDRs, are used to incentivize the general partner to grow the MLP.
IDRs typically allocate greater percentages of cash flows to go to the general partner (and not to the limited partners) as the MLP grows its cash flows.
This reduces the MLPs ability to grow its distributions, putting a handicap on distribution increases.
It should be noted that not all MLPs have IDRs, but many do.
Disadvantage #5: Elevated risk of distribution cuts due to high payout ratios
One of the big advantages of investing in MLPs is their high yields. Unfortunately, high yields very often come with high payout ratios.
Most MLPs distribute nearly all of the cash flows they make to unit holders. In general, this is a positive.
However, it creates very little room for error.
The pipeline business is generally stable, but if cash flows decline unexpectedly, there is almost no margin of safety at many MLPs. Even a short-term disturbance in business results can necessitate a reduction in the distribution.
Disadvantage #6: Growth Through Debt & Share Issuances
Since MLPs typically distribute virtually all of their cash flows as distributions, there is very little money left over to actually grow the partnership.
And most MLPs strive to grow both the partnership, and distributions, over time. To do this, the MLP’s management must tap capital markets by either issuing new units or taking on additional debt.
When new units are issued, existing unit holders are diluted; their percentage of ownership in the MLP is reduced.
When new debt is issued, more cash flows must be used to cover interest payments instead of going into the pockets of limited partners through distributions.
If an MLPs management team starts projects with lower returns than the cost of their debt or equity capital, it destroys unit holder value. This is a real risk to consider when investing in MLPs.
The 10 Best MLPs Today
The 10 best MLPs are ranked and analyzed below using expected total returns from the Sure Analysis Research Database. Expected total returns consist of 3 elements:
- Return from change in valuation multiple
- Return from distribution yield
- Return from growth on a per-unit basis
Investors should note that the top MLPs list was not screened on a qualitative assessment of a company’s distribution risk. The focus is expected annual returns over the next five years.
That said, MLPs with current distribution yields below 2% were not considered. This screen makes the list more attractive to income investors.
Continue reading for detailed analysis of each of our top MLPs, ranked according to expected 5-year annual returns.
MLP #10: Star Group, L.P. (SGU)
- 5-year expected annual returns: 6.6%
- Distribution yield: 6.1%
Star Group, L.P. distributes home heating oil and propane while also providing heating, ventilation, and air-conditioning services, making its results highly seasonal and sensitive to winter weather.
Despite its limited-partnership legal form, Star Group is taxed as a corporation and reports distributions on Form 1099-DIV.
In the fiscal third quarter of 2026, revenue increased 17.2% to $358.1 million as higher selling prices reflected increased wholesale product costs.
However, product volume fell 9.4% to 32.8 million gallons, and the quarterly net loss widened to $28.0 million.
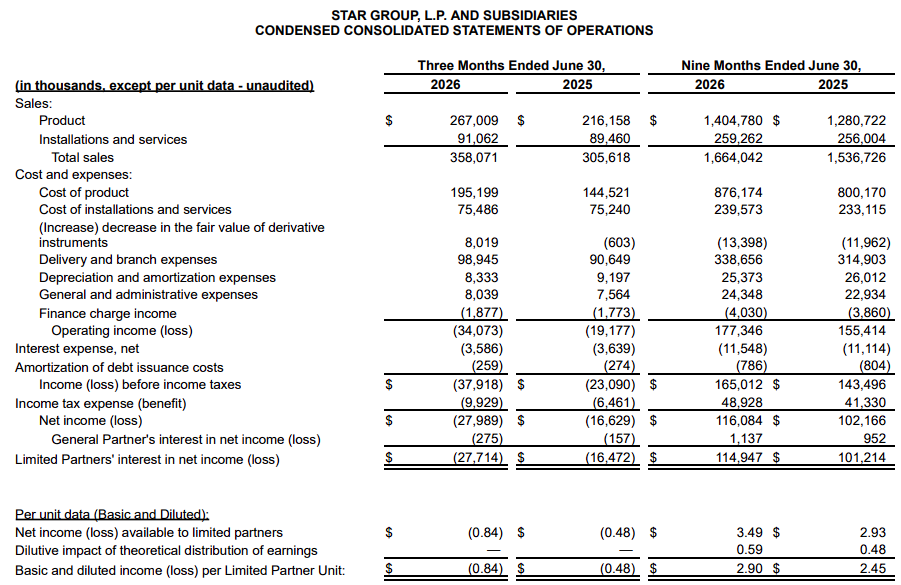
The adjusted EBITDA loss was $17.7 million, compared with a $10.6 million loss a year earlier, as better per-gallon margins and service profitability were outweighed by higher operating expenses and lower volume.
The longer nine-month period was considerably stronger: adjusted EBITDA rose to $189.3 million from $169.4 million, helped by acquisitions, colder weather, and margin improvement.
Star Group’s annualized distribution is $0.79 per unit, and the partnership has increased its payout for 14 consecutive years.
Management completed no acquisitions during the latest quarter, but continues to evaluate opportunities while emphasizing customer retention and service and installation profitability.
Weather variability, customer attrition, fuel-price swings, and insurance costs remain important risks, yet the service business and acquisition strategy offer ways to reduce reliance on heating-oil volumes over time.
Deep Dive: Click here to download (for free) our most recent 3-Page Sure Analysis PDF report on Star Group, L.P. (SGU).
MLP #9: Western Midstream Partners, LP (WES)
- 5-year expected annual returns: 8.2%
- Distribution yield: 8.3%
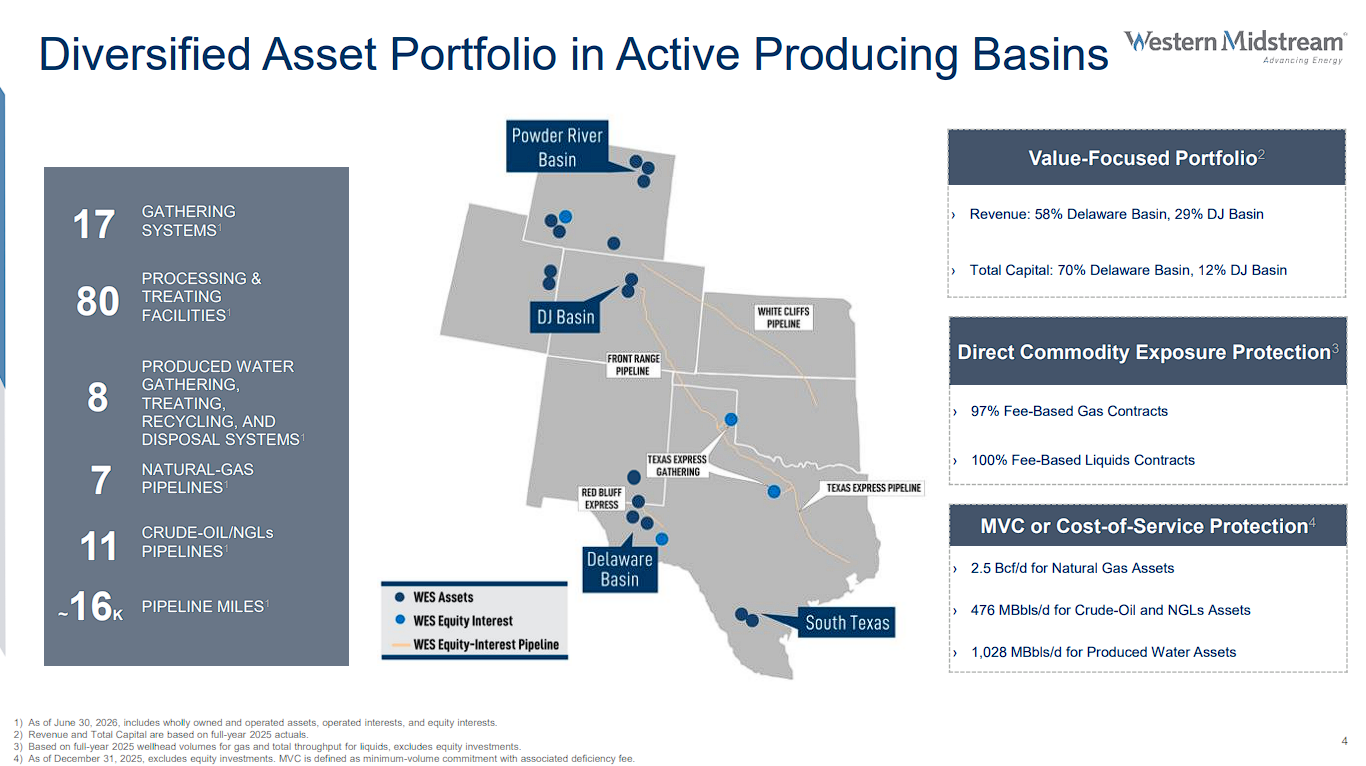
Western Midstream Partners, LP owns gathering, processing, transportation, and produced-water infrastructure.
It is concentrated in the Delaware and DJ basins, with most cash flow protected from direct commodity-price exposure by fee-based contracts.
Second-quarter 2026 net income attributable to limited partners was $394.9 million, or $0.99 per diluted unit.
Adjusted EBITDA increased 19% year over year to a record $736.5 million, while distributable cash flow reached $537.2 million.
Growth reflected record produced-water throughput, higher Delaware Basin natural-gas volumes, and a partial-quarter contribution from the Brazos Delaware acquisition completed in June.
That acquisition added approximately 460 MMcf per day of natural-gas processing capacity and deepened Western’s position in a core producing region.
Management raised the midpoint of its 2026 adjusted EBITDA guidance by 10% to $2.85 billion and reaffirmed capital spending of $850 million to $1.0 billion.
The quarterly distribution is $0.93 per unit, or $3.72 annualized, and the partnership has increased its annual payout for five consecutive years.
Western also took a 7.5% interest in the Solitude Pipeline System, whose two planned Permian-to-Katy pipelines are expected to enter service in phases beginning in 2029.
Strong operating momentum supports the payout, but acquisition integration, capital requirements, leverage, and basin concentration remain the principal risks behind the projected return.
MLP #8: Enterprise Products Partners L.P. (EPD)
- 5-year expected annual returns: 9.2%
- Distribution yield: 6.2%
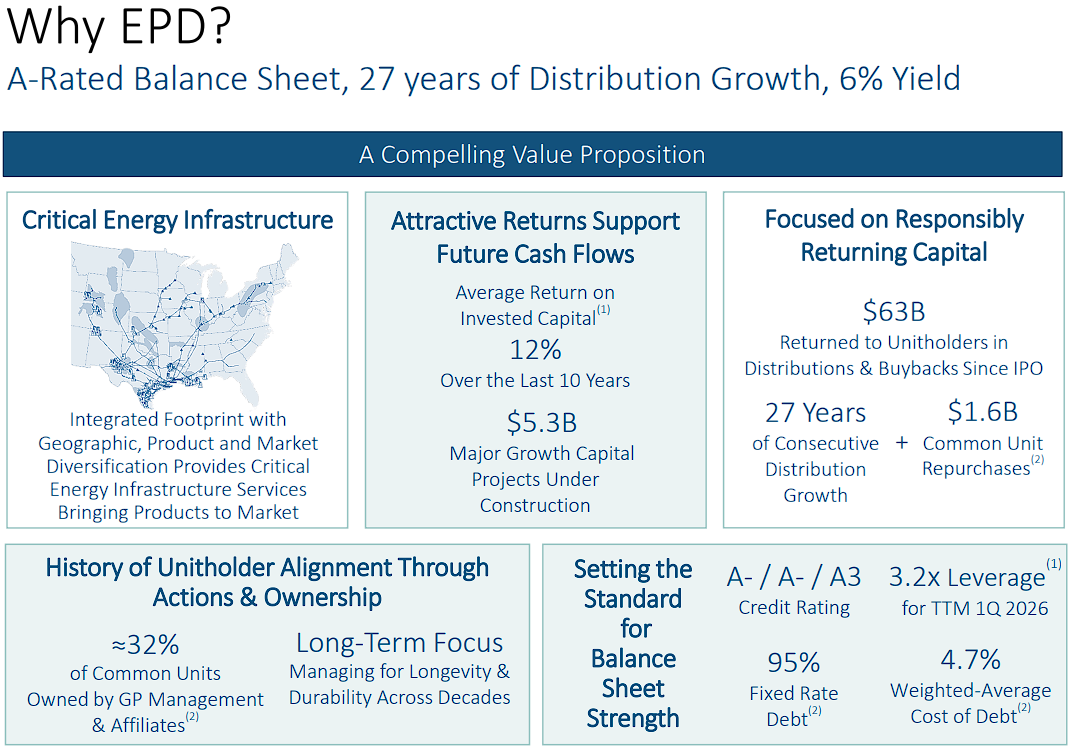
Enterprise Products Partners L.P. owns an integrated network of pipelines, processing plants, storage facilities, fractionators, and export terminals that connects major North American energy-producing regions with end markets.
The partnership reported record second-quarter 2026 net income attributable to common unitholders of $1.84 billion, or $0.84 per unit, an increase of 28% year over year.
Adjusted EBITDA rose 17% to $2.83 billion, while distributable cash flow increased 21% to $2.31 billion.
Distribution coverage was a robust 1.9 times, allowing Enterprise to retain roughly $1.1 billion of cash flow for reinvestment and balance-sheet support.
The quarterly distribution of $0.56 per unit was 2.8% above the prior-year level, continuing Enterprise’s long record of annual payout increases.
Operational momentum was broad, with pipeline volumes up 8% and marine-terminal volumes up 33%.
Enterprise has approximately $6.5 billion of organic growth projects under construction, including additional Permian gas-processing capacity, a new fractionator, and export expansions.
Co-CEO Jim Teague will retire on January 4, 2027, with co-CEO Randy Fowler becoming sole CEO.
Enterprise’s integrated assets, strong coverage, and self-funding capacity support a more defensive distribution than many higher-yielding MLPs.
MLP #7: Delek Logistics Partners, LP (DKL)
- 5-year expected annual returns: 9.9%
- Distribution yield: 8.3%
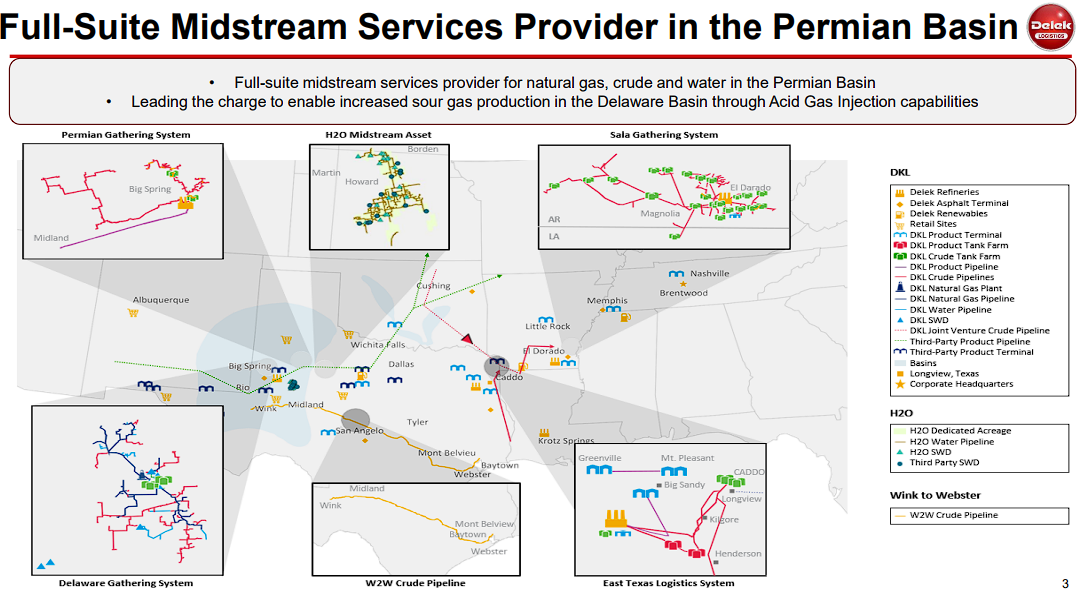
Delek Logistics Partners, LP owns gathering, transportation, storage, and natural-gas infrastructure, with an expanding third-party business alongside its longstanding sponsor relationship with Delek US Holdings.
Second-quarter 2026 net income was $28.9 million, or $0.54 per unit, compared with $44.6 million, or $0.83 per unit, in the prior-year period.
Adjusted EBITDA nevertheless increased to $143.5 million from $127.4 million, while adjusted distributable cash flow rose to $80.5 million from $72.5 million.
The partnership declared a quarterly distribution of $1.135 per unit, its 54th consecutive quarterly increase and 1.8% above the prior-year payment.
Management reaffirmed 2026 adjusted EBITDA guidance of $520 million to $560 million.
The Libby sour-gas gathering system was nearing completion, while the Delaware Gathering business posted record crude-oil volumes and should remain an important growth engine.
On August 14, Delek completed an offering of 4.6 million common units at $50 each, generating approximately $220.8 million after underwriting fees but before other expenses.
Proceeds were earmarked for debt repayment and general purposes; Delek US’s ownership fell from approximately 63% to 58%.
The financing strengthens liquidity but dilutes existing holders, while leverage of 4.23 times at quarter-end remains a risk.
MLP #6: Plains All American Pipeline, L.P. (PAA)
- 5-year expected annual returns: 10.6%
- Distribution yield: 7.0%
Plains All American Pipeline, L.P. is a large crude-oil midstream partnership whose pipelines, gathering systems, storage terminals, and transportation assets are concentrated in key North American producing basins.
For the second quarter of 2026, net income attributable to the partnership was $1.83 billion, including an approximately $1.6 billion net gain from the sale of its Canadian natural-gas-liquids business.
Adjusted EBITDA attributable to the partnership was $738 million, while cash flow from operating activities totaled $956 million.
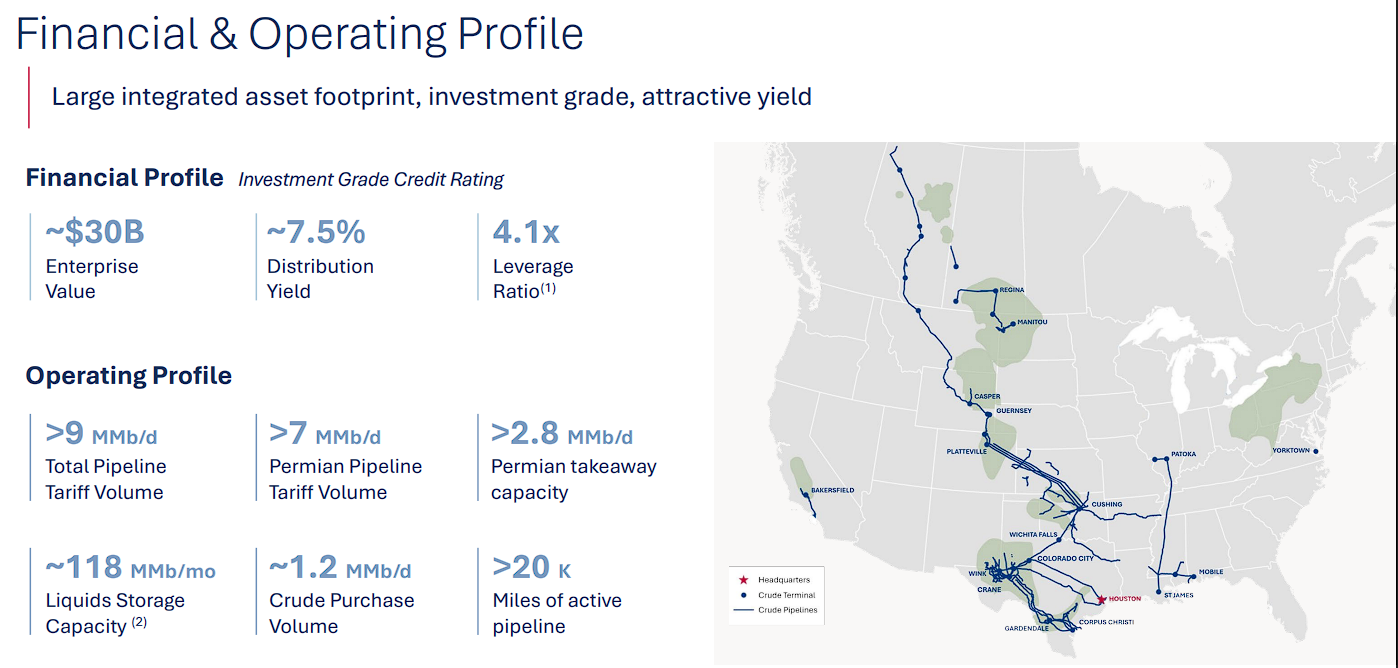
The Canadian asset sale, completed in May, sharpened Plains’ focus on crude-oil infrastructure and funded approximately $2.9 billion of debt reduction, bringing pro forma leverage to 3.3 times.
On October 1, Plains reaffirmed a quarterly distribution of $0.4175 per unit, or $1.67 annualized, unchanged sequentially and 10% higher year over year.
On September 16, Plains agreed to acquire Silver Creek Midstream assets for $585 million, expanding its Powder River Basin crude-oil network, with closing expected in the fourth quarter.
Plains also announced $1.5 billion of hybrid financing to fund preferred-unit redemptions.
Organic growth capital guidance is $400 million to $450 million, including a Cactus III expansion.
Acquisition integration, financing costs, and crude-oil volumes remain central to sustaining distribution growth.
MLP #5: Plains GP Holdings, L.P. (PAGP)
- 5-year expected annual returns: 11.7%
- Distribution yield: 6.5%
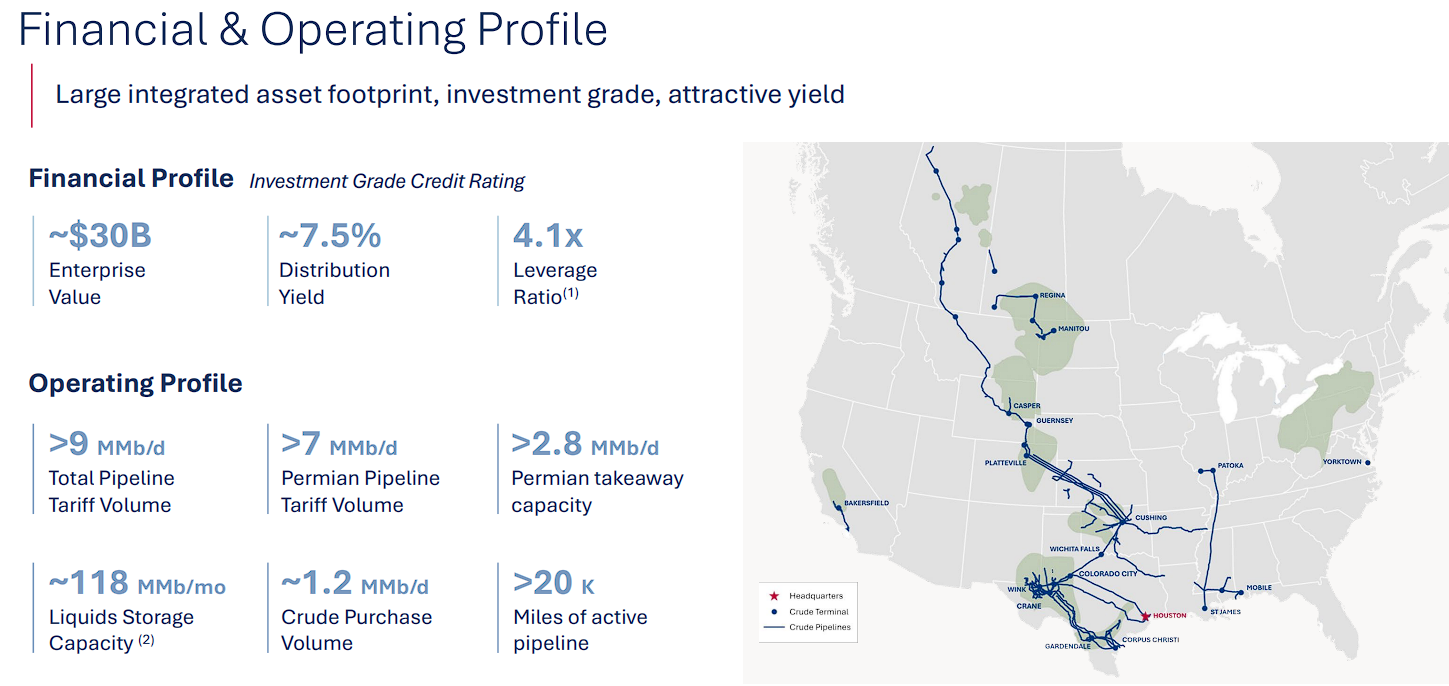
Plains GP Holdings, L.P. owns an indirect limited-partner interest in Plains All American Pipeline and a controlling interest in its general partner, so its economic results closely follow the same crude-oil midstream platform.
Second-quarter 2026 results reflected the May completion of the Canadian natural-gas-liquids asset sale, which generated an approximately $1.6 billion net gain within consolidated net income.
The transaction transformed Plains into a more focused crude-oil midstream business and funded approximately $2.9 billion of debt reduction, lowering pro forma leverage to 3.3 times.
The October 1 declaration maintained PAGP’s quarterly payout at $0.4175 per Class A share, or $1.67 annualized, up 10% year over year.
September developments included the proposed $585 million Silver Creek acquisition and $1.5 billion of hybrid financing for preferred-unit redemptions.
PAGP reports distributions on Form 1099, and its relative valuation explains its higher expected return than PAA despite their shared underlying business.
Plains cautioned that part of PAGP’s 2026 payout may be taxable as a dividend following the asset sale.
Investors should compare tax treatment, relative valuation, and liquidity when choosing between the two securities.
MLP #4: Hess Midstream LP (HESM)
- 5-year expected annual returns: 12.2%
- Distribution yield: 8.4%
Hess Midstream LP owns gathering, processing, storage, and terminaling assets in North Dakota’s Bakken and Three Forks regions, with Chevron now serving as its principal sponsor following the Hess acquisition.
Second-quarter 2026 net income was $173.7 million, while net income attributable to the partnership was $96.4 million, or $0.75 per Class A share.
Revenue and other income declined to $399.0 million as lower production reduced oil and water volumes and Tioga Gas Plant maintenance affected gas processing.
Adjusted EBITDA was $313.7 million, only modestly below the prior-year period, while adjusted free cash flow increased to $231.6 million as capital expenditures fell.
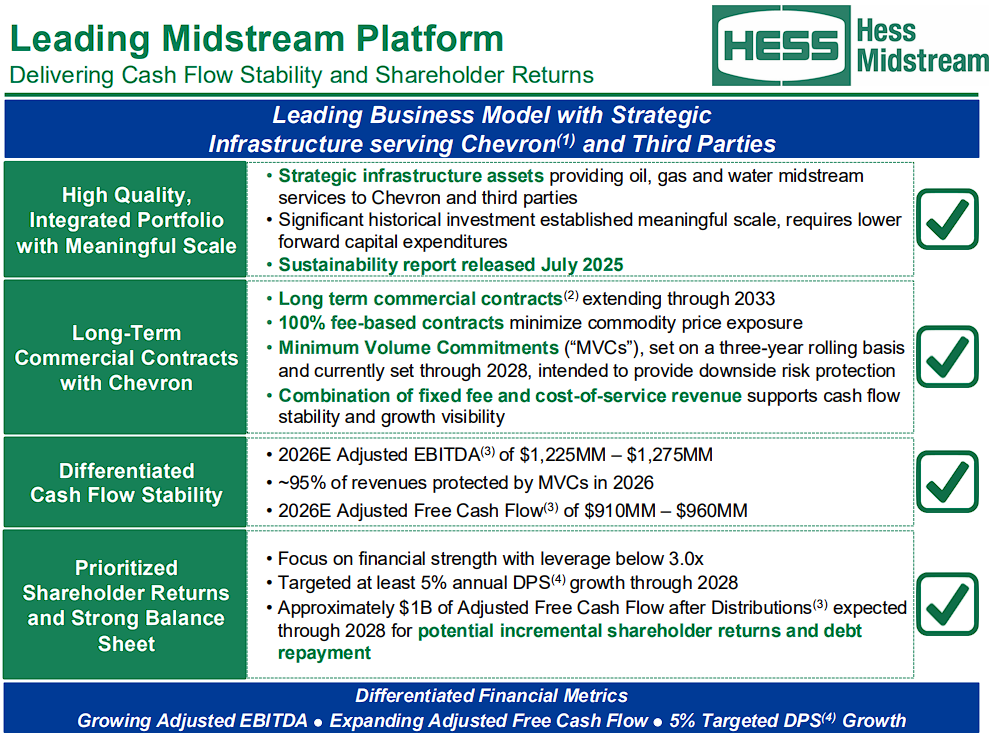
Management reaffirmed 2026 guidance for adjusted EBITDA of $1.225 billion to $1.275 billion and adjusted free cash flow of $910 million to $960 million.
The quarterly distribution increased to $0.7888 per share, and management continues to target at least 5% annual distribution growth through 2028.
Hess Midstream is taxed as a corporation and issues Form 1099 rather than Schedule K-1, despite its limited-partnership legal structure.
Minimum-volume commitments, tariff escalators, and substantial free cash flow support the distribution, while future Bakken activity and Chevron’s long-term development plans will shape growth.
MLP #3: Global Partners LP (GLP)
- 5-year expected annual returns: 12.3%
- Distribution yield: 6.6%
Global Partners LP owns an integrated network of fuel terminals, transportation assets, and convenience stores across the Northeast, creating exposure to wholesale margins, retail operations, and logistics demand.
The partnership delivered a strong second quarter of 2026, with net income rising to $71.0 million, or $1.86 per unit, from $25.2 million, or $0.55 per unit, a year earlier.
Adjusted EBITDA climbed to $148.2 million from $98.2 million, while adjusted distributable cash flow increased to $92.5 million from $52.3 million.
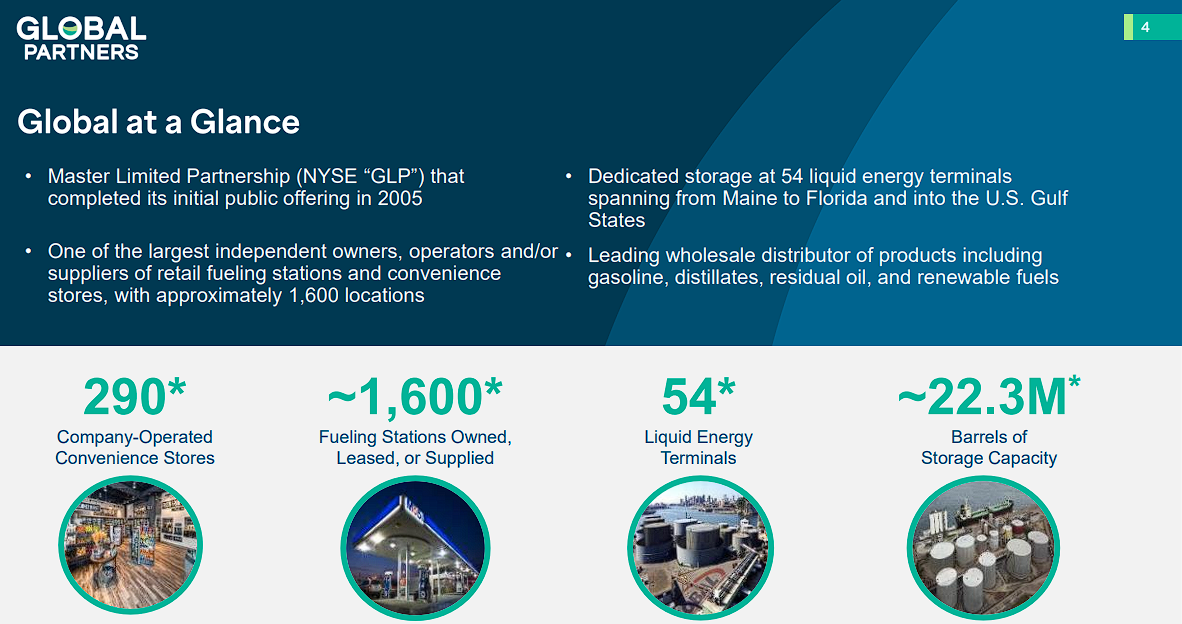
Gross profit reached $328.9 million, supported by favorable fuel margins and improved results across the combined platform.
The quarterly distribution was raised to $0.78 per unit, or $3.12 annualized, continuing a six-year streak of annual distribution growth.
Global’s broad terminal and retail footprint gives management several ways to optimize product sourcing and asset utilization, but quarterly results can still move sharply with wholesale conditions and fuel margins.
Global fully redeemed its Series B preferred units on July 30.
Its high ranking reflects valuation upside and income despite our forecast of 3% annual earnings contraction as unusually favorable fuel margins normalize.
Leverage, acquisition execution, environmental liabilities, and motor-fuel demand remain key risks.
MLP #2: Brookfield Infrastructure Partners L.P. (BIP)
- 5-year expected annual returns: 13.3%
- Distribution yield: 5.0%
Brookfield Infrastructure Partners L.P. owns utilities, transportation, midstream, and data-infrastructure assets worldwide, with inflation-linked or contracted revenue supporting relatively predictable cash flows.
Second-quarter 2026 funds from operations increased 10% to $702 million, or $0.89 per unit, from $638 million, or $0.81 per unit, a year earlier.
Net income was $44 million compared with $69 million, reflecting depreciation and financing costs alongside stronger operations.
Data-segment funds from operations rose 36%, and management expanded its strategic framework with Bloom Energy from $5 billion to as much as $25 billion of potential investment.
At its September Investor Day, Brookfield reported $1.4 billion of asset-sale proceeds secured year to date and a goal of more than $2 billion for 2026.
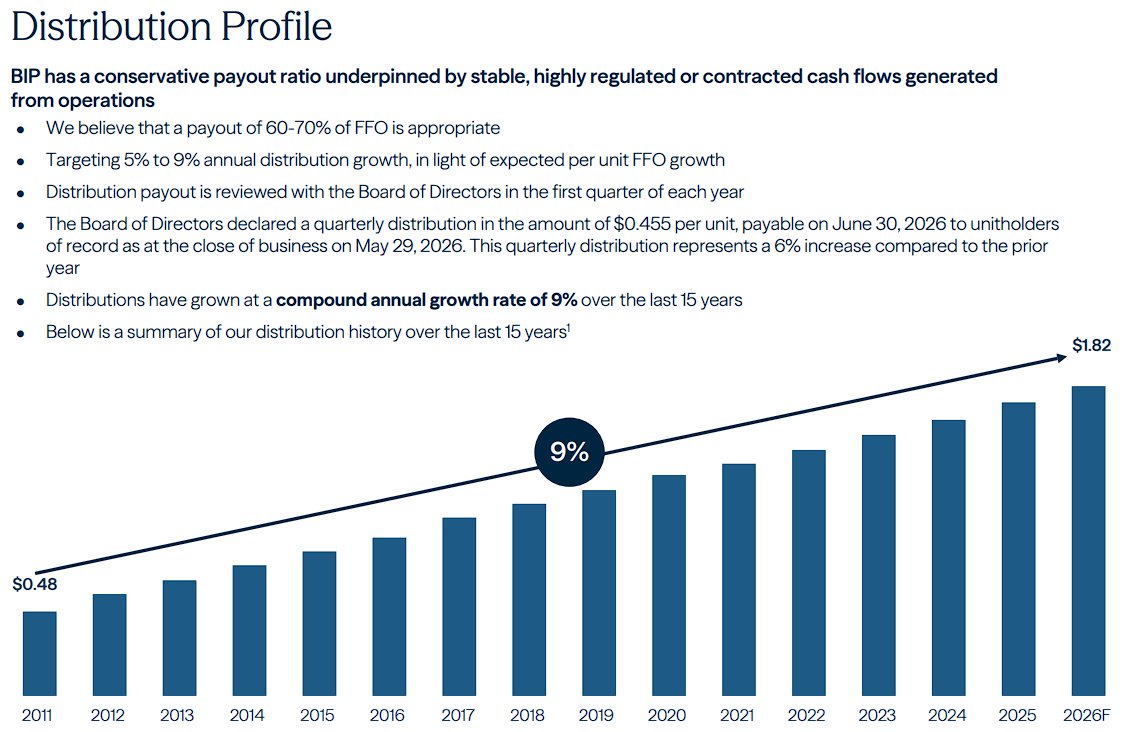
The quarterly distribution is $0.455 per unit, or $1.82 annualized, 6% higher year over year.
Management outlined a path toward at least 12% annual FFO-per-unit growth in the next two to three years, above our 7% long-term growth assumption.
The proposed combination with Brookfield Infrastructure Corporation has securityholder votes scheduled for October 14.
If approved and completed in the fourth quarter, each BIP unit would become one share of the new corporation, retaining the BIP ticker.
The conversion remains conditional, while financing costs, project execution, and asset-sale timing are the main operating risks.
MLP #1: Brookfield Renewable Partners L.P. (BEP)
- 5-year expected annual returns: 14.4%
- Distribution yield: 5.5%
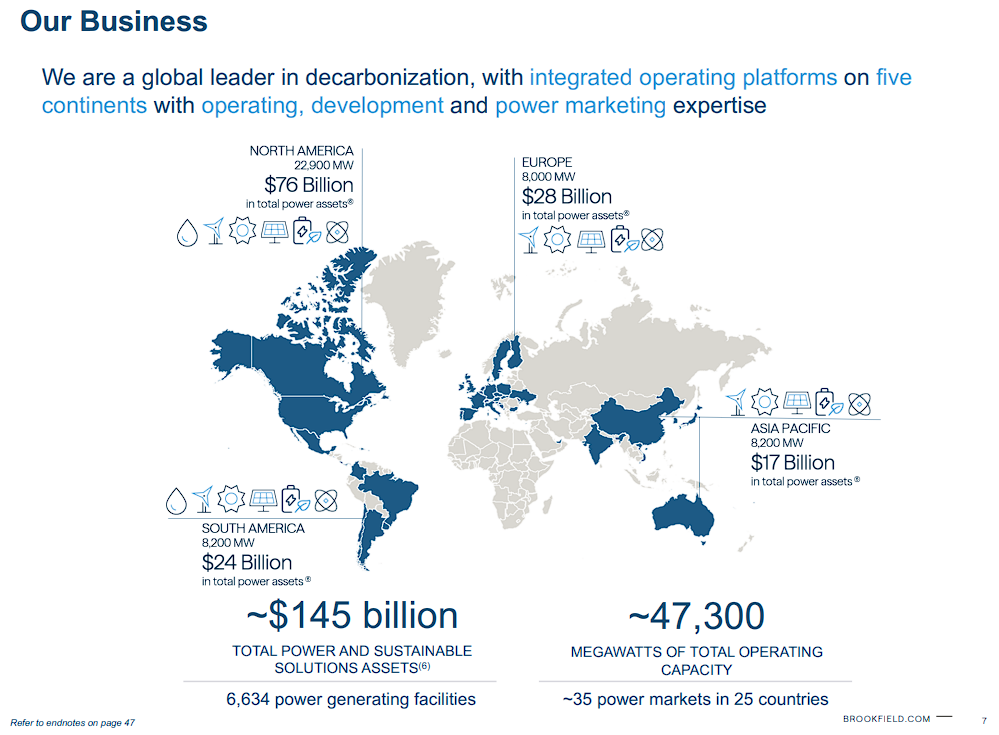
Brookfield Renewable Partners L.P. owns a diversified global portfolio of hydroelectric, wind, solar, storage, and sustainable-solutions assets, supported by long-duration contracted cash flows.
Second-quarter 2026 funds from operations reached a record $421 million, or $0.62 per unit, up 13% and 11% per unit, respectively, from the prior-year period.
Brookfield commissioned approximately 1,280 megawatts during the quarter.
Brookfield and partners completed the Boralex acquisition on August 14, adding a major renewable platform, while the proposed Aypa Power acquisition would expand battery-storage development.
The quarterly distribution is $0.392 per unit, or approximately $1.57 annualized.
On September 30, a non-binding U.S.–Korea framework outlined potential financing for eight U.S. nuclear reactors, offering growth opportunities for Westinghouse, in which Brookfield Renewable holds an interest.
The framework remains subject to final negotiations; its potential investment is not a committed expenditure by Brookfield Renewable.
The proposed combination with Brookfield Renewable Corporation has securityholder votes scheduled for October 14, with fourth-quarter closing conditional on approvals.
Successful completion would replace the publicly traded partnership with a single corporation.
Development execution, acquisition integration, funding costs, and the conversion’s terms remain central to realizing the projected return.
Deep Dive: Click here to download (for free) our most recent 3-Page Sure Analysis PDF report on Brookfield Renewable Partners L.P. (BEP).
MLP ETFs, ETNs, & Mutual Funds
There are 3 primary ways to invest in MLPs:
- By investing in units of individual publicly traded MLPs
- By investing in an MLP ETF or mutual fund
- By investing in an MLP ETN
Note: ETN stands for “exchange traded note”
The difference between investing directly in a company (normal stock investing) versus investing in a mutual fund or ETF is very clear. It is simply investing in one security versus a group of securities.
ETNs are different. Unlike mutual funds or ETFs, ETNs don’t actually own any underlying shares or units of real businesses.
Instead, ETNs are financial instruments backed by the financial institution (typically a large bank) that issued them. They perfectly track the value of an index.
The disadvantage to ETNs is that they expose investors to the possibility of a total loss if the backing institution were to go bankrupt.
The advantage to investing in an MLP ETN is that distribution income is tracked, but paid via a 1099. This eliminates the tax disadvantages of MLPs (no K-1s, UBTI, etc.).
This unique feature may appeal to investors who don’t want to hassle with a more complicated tax situation. The J.P. Morgan Alerian MLP ETN (AMJB) makes a good choice in this case.
Purchasing individual securities is preferable for many, as it allows investors to concentrate on their best ideas. But ETFs have their place as well, especially for investors looking for diversification benefits.
Final Thoughts
MLPs can combine high current income with attractive total-return potential, but this ranking is best viewed as a research shortlist rather than a simple measure of quality or distribution safety.
Brookfield Renewable now ranks first and Brookfield Infrastructure second because of their projected growth and valuation potential, while Enterprise Products stands out for its long distribution-growth record, strong coverage, and integrated asset base.
Western Midstream remains in the Top 10 with a high current yield and record second-quarter adjusted EBITDA, while Global Partners rises to third on income and valuation potential despite the expected normalization of favorable fuel margins.
Higher-yielding names such as Delek Logistics and Hess Midstream offer more immediate income, but also require closer review of sponsor exposure, leverage, and asset concentration.
PAA and PAGP represent the same underlying business through different structures, so their relative valuation and tax treatment matter more than their separate positions in the ranking.
Investors should also note that Brookfield Infrastructure and Brookfield Renewable have proposed converting their publicly traded partnership structures into single corporations, with October 14 votes and fourth-quarter 2026 closings subject to approval and other conditions.
Distribution coverage, balance-sheet strength, contract quality, capital-allocation discipline, and the tax consequences of each security remain the most useful points of comparison before investing.
Hiring a tax professional to aid in preparing taxes may be a worthwhile option for dealing with the complexity.
Additionally, MLPs are not the only way to find high levels of income. The following lists contain many more stocks that regularly pay rising dividends.
Other Sure Dividend Resources
- Dividend Kings: 50+ years of rising dividends
- Dividend Champions: 25+ years of rising dividends
- Dividend Aristocrats: 25+ years of rising dividends and in the S&P 500
- High Dividend Stocks: 4%+ dividend yields
- Monthly Dividend Stocks: Individual securities that pay out every month
- Royalty Stocks: Detailed royalty stocks list
- REITs: Detailed REIT list
- BDCs: Detailed BDC list