Updated on September 7th, 2026 by Nikolaos Sismanis
Business Development Companies (BDCs) make debt and/or equity investments in smaller businesses.
The appeal of BDCs is:
- Exposure to smaller businesses otherwise not available on the stock market
- Required to distribute income to investors
- Typically very high yields
With this in mind, we created a full downloadable spreadsheet list of over 50 BDCs.
You can download the Excel spreadsheet (along with relevant financial metrics like dividend yield and payout ratios) by clicking on the link below:

This research report will provide an overview of BDCs, along with our top 5 BDCs right now as ranked by expected total returns from the Sure Analysis Research Database.
Table Of Contents
The table of contents below provides for easy navigation of the article:
- Overview of BDCs
- Why Invest In BDCs?
- Tax Considerations Of BDCs
- The Top 5 BDCs Today
- #5: Prospect Capital Corporation (PSEC)
- #4: PennantPark Investment Corporation (PNNT)
- #3: Horizon Technology Finance Corporation (HRZN)
- #2: PennantPark Floating Rate Capital Ltd. (PFLT)
- #1: Saratoga Investment Corp. (SAR)
- Final Thoughts
Overview of BDCs
Business Development Companies are closed-end investment firms. Their business model involves making debt and/or equity investments in other companies, typically small or mid-size businesses.
These target companies may not have access to traditional means of raising capital, which makes them suitable partners for a BDC. BDCs invest in a variety of companies, including turnarounds, developing, or distressed companies.
BDCs are registered under the Investment Company Act of 1940. As they are publicly-traded, BDCs must also be registered with the Securities and Exchange Commission.
To qualify as a BDC, the firm must invest at least 70% of its assets in private or publicly-held companies with market capitalizations of $250 million or below.
BDCs make money by investing with the goal of generating income, as well as capital gains on their investments if and when they are sold.
In this way, BDCs operate similar business models as a private equity firm or venture capital firm.
The major difference is that private equity and venture capital investment is typically restricted to accredited investors, while anyone can invest in publicly-traded BDCs.
Why Invest In BDCs?
The obvious appeal for BDCs is their high dividend yields. It is not uncommon to find BDCs with dividend yields above 5%. In some cases, certain BDCs provide 10%+ yields.
Of course, investors should conduct a thorough amount of due diligence, to make sure the underlying fundamentals support the dividend.
Indeed, there are multiple risk factors that investors should know before they invest in BDCs.
First and foremost, BDCs are often heavily indebted.
This is commonplace across BDCs, as their business model involves borrowing to make investments in other companies. The end result is that BDCs are often significantly leveraged companies.
When the economy is strong and markets are rising, leverage can help amplify positive returns.
However, the flip side is that leverage can accelerate losses as well, which can happen in bear markets or recessions.
Another risk to be aware of is interest rates. Since the BDC business model heavily utilizes debt, investors should understand the interest rate environment before investing.
Rising interest rates can negatively affect BDCs if it causes a spike in borrowing costs.
Lastly, credit risk is an additional consideration for investors. As previously mentioned, BDCs make investments in small to mid-size businesses.
Therefore, the quality of the BDC’s portfolio must be assessed, to make sure the BDC will not experience a high level of defaults within its investment portfolio.
This would cause adverse results for the BDC itself, which could negatively impact its ability to maintain distributions to shareholders.
Another unique characteristic of BDCs that investors should know before buying is taxation.
Tax Considerations Of BDCs
BDC dividends are typically not fully (or even mostly) “qualified dividends” for tax purposes, which is generally a more favorable tax rate.
Instead, BDC distributions are taxable at the investor’s ordinary income rates, while the BDC’s capital gains and qualified dividend income is taxed at capital gains rates.
Business Development Companies must pay out 90%+ of their income as distributions. In this way, BDCs are very similar to Real Estate Investment Trusts.
Another factor to keep in mind is that approximately 70% to 80% of BDC dividend income is typically derived from ordinary income.
As a result, BDCs are widely considered to be good candidates for a tax-advantaged retirement account such as an IRA or 401k.
BDCs pay their distributions as a mix of ordinary income and non-qualified dividends, qualified dividends, return of capital, and capital gains.
Returns of capital reduce your tax basis. Qualified dividends and long-term capital gains are taxed at lower rates, while ordinary income and non-qualified dividends are taxed at your personal income tax bracket rate.
The Top 5 BDCs Today
With all this in mind, here are our top 5 BDCs today, ranked according to their expected annual returns over the next five years.
BDC #5: Prospect Capital Corporation (PSEC)
- 5-year expected annual return: 11.7%
Prospect Capital Corporation is a large publicly traded BDC with a portfolio of middle-market loans, real estate investments, and selected equity positions.
For the fiscal fourth quarter ended June 30th, 2026, net investment income was $77.7 million, or $0.15 per share, compared with $0.16 in the prior quarter and $0.17 one year earlier.
The company recorded a net loss attributable to common shareholders of $38.1 million, or $0.08 per share.
NAV fell to $5.71 per share from $6.05 sequentially and $6.56 a year earlier.
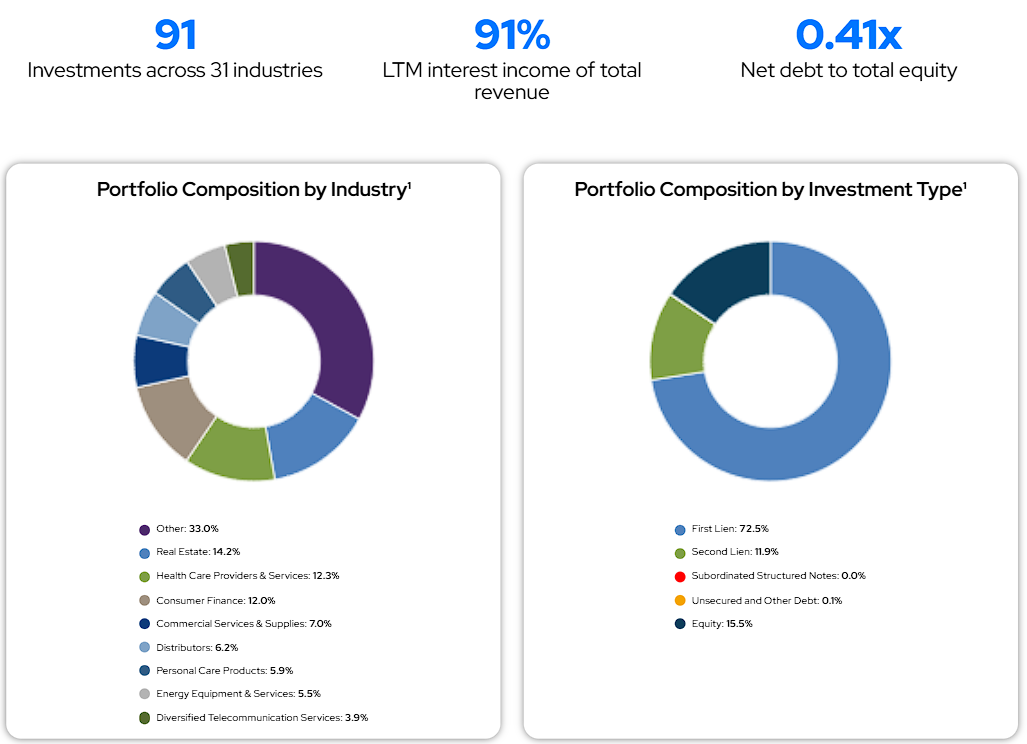
The $6.34 billion portfolio covered 91 companies across 31 industries, with senior secured debt representing 76.7% of fair value and non-accrual loans equaling 0.7% of total assets.
Prospect reduced its monthly dividend from $0.045 to $0.035 per share and has declared the new payment through October.
The resulting $0.42 annualized payout is better aligned with recurring earnings, as quarterly NII covered the new $0.105 three-month distribution by roughly 1.4 times.
Management is rotating toward first-lien loans, which increased to 72.5% of portfolio cost, while reducing second-lien exposure and exiting subordinated structured notes.
The July sale of Valley Electric generated approximately $328 million of consideration and should support deleveraging.
Nevertheless, further NAV erosion, credit losses, rate pressure, and execution on the portfolio repositioning remain important risks behind the unusually high yield.
BDC #4: PennantPark Investment Corporation (PNNT)
- 5-year expected annual return: 11.8%
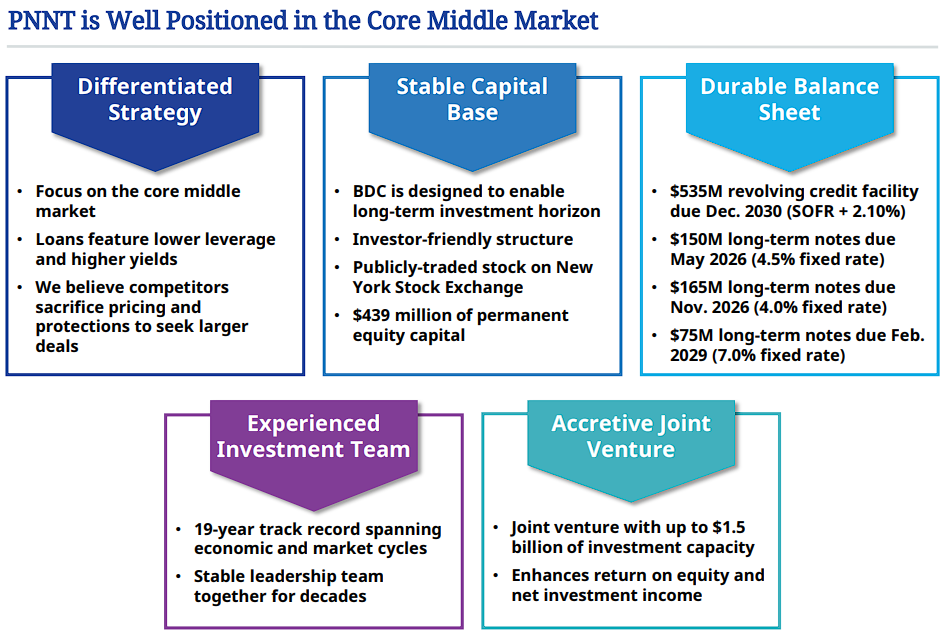
PennantPark Investment Corporation provides private credit and equity capital to U.S. middle-market businesses.
Its portfolio includes first- and second-lien loans, subordinated debt, and a comparatively large equity allocation, which can enhance gains but also makes NAV more volatile.
For the fiscal third quarter ended June 30th, 2026, investment income declined to $24.8 million from $29.6 million as the portfolio and its weighted average yield contracted.
NII fell to $8.9 million, or $0.14 per share, from $0.18 per share one year earlier.
The $1.19 billion portfolio covered 159 companies, yielded 11.0% on interest-bearing debt, and had four non-accruals representing 0.8% of fair value.
NAV declined 2.5% sequentially to $6.56 per share, as $12.0 million of realized gains were more than offset by $16.2 million of unrealized depreciation.
PNNT maintained its $0.08 monthly distribution, but only $0.04 is the base dividend; the remaining $0.04 is supplemental.
Quarterly NII of $0.14 covered about 58% of the $0.24 distributed, so the supplement remains especially vulnerable if recurring income does not recover.
After quarter-end, the PSLF joint venture refinanced part of its securitization, lowering its weighted average financing cost and improving future earnings flexibility.
BDC #3: Horizon Technology Finance Corporation (HRZN)
- 5-year expected annual return: 12.4%
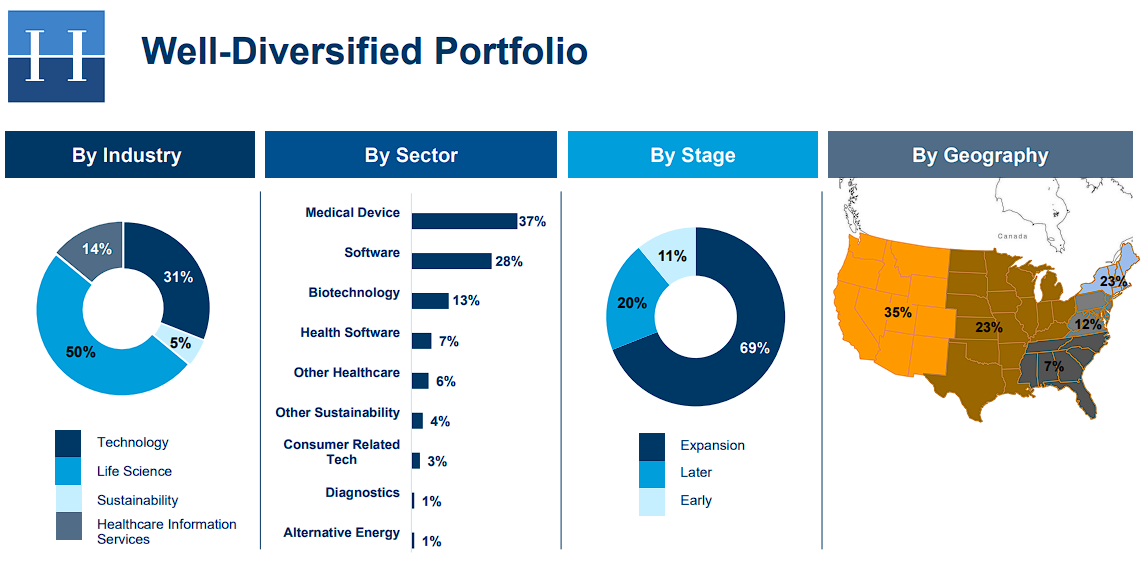
Horizon Technology Finance Corporation provides venture debt to technology, life-sciences, healthcare, and sustainability businesses.
Its senior secured loans generate high current yields, while warrants and equity positions can add upside when portfolio companies are sold or complete public offerings.
Second-quarter 2026 total investment income increased to $25.0 million, but NII declined to $7.4 million, or $0.11 per share.
The result included $0.07 per share of non-recurring expenses from the completed Monroe Capital Corporation merger, so adjusted recurring earnings approximately covered the $0.18 regular quarterly distribution.
The larger concern was $38.5 million of unrealized depreciation, substantially related to one portfolio company, which reduced NAV to $6.23 per share from $6.98.
The merger expanded Horizon’s balance sheet, while $135 million of cash, $329 million of credit capacity, and a $228 million committed backlog support future deployment.
Horizon declared $0.06 regular monthly dividends for October through December, plus $0.03 monthly specials funded from spillover income.
The base payout appears more sustainable than the combined amount, especially because spillover income declined to $0.33 per share.
Management also increased its repurchase authorization to $20 million after buying 1.37 million shares during the quarter, potentially helping NAV while the stock trades at a discount.
BDC #2: PennantPark Floating Rate Capital Ltd. (PFLT)
- 5-year expected annual return: 14.8%
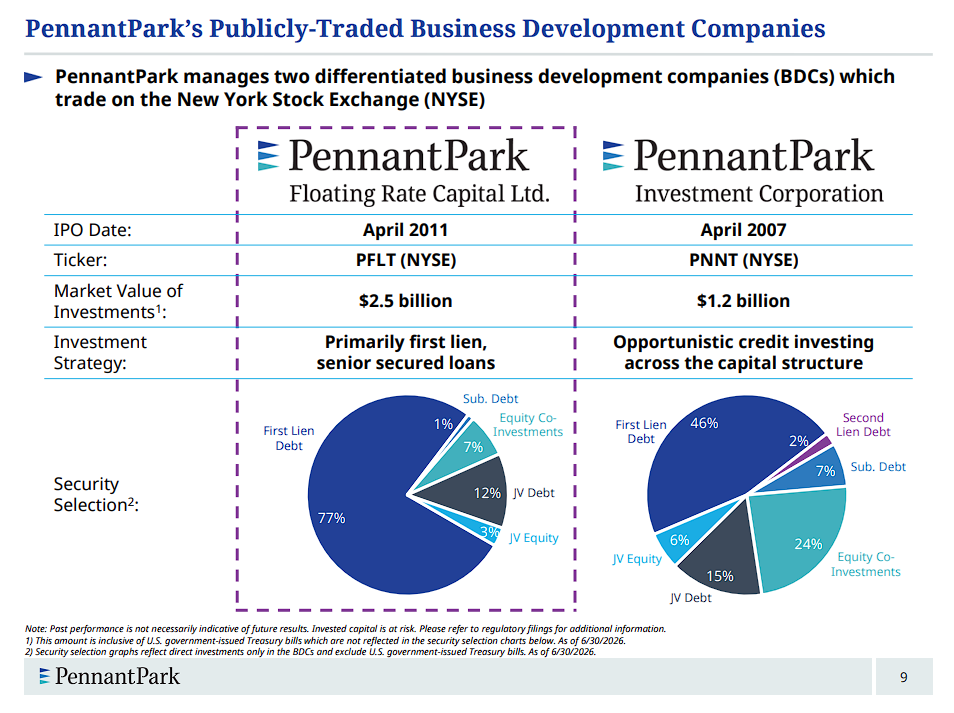
PennantPark Floating Rate Capital Ltd. lends primarily to U.S. middle-market companies through floating-rate, senior secured debt.
This positioning limits direct duration risk and places the company high in borrowers’ capital structures, although falling benchmark rates can compress portfolio income.
For the fiscal third quarter ended June 30th, 2026, investment income increased to $66.1 million and NII reached $25.9 million, or $0.26 per share.
The investment portfolio was $2.50 billion, NAV was $10.26 per share, and the weighted average yield on debt investments was 9.8%.
NAV declined 2.0% sequentially because $37.3 million of realized gains did not fully offset $56.6 million of unrealized depreciation.
PFLT invested $212.1 million during the quarter, while sales and repayments totaled $271.7 million, contributing to a smaller balance sheet.
The company recently reduced its monthly distribution from $0.1025 to $0.0833, comprising a $0.08 base dividend and a $0.0033 supplemental payment.
Quarterly NII narrowly covered three payments at the new combined rate, a much healthier relationship than before the reset, but the limited cushion leaves credit costs and rate movements important.
Two senior-loan joint ventures provide additional scale, while the recently issued 7.375% notes due 2031 extend funding duration at a relatively high fixed cost.
BDC #1: Saratoga Investment Corp. (SAR)
- 5-year expected annual return: 16.8%
Saratoga Investment Corp. provides debt and equity capital to U.S. middle-market companies, with first-lien loans representing more than 80% of portfolio fair value.
Its SBIC licenses, collateralized loan obligation, joint venture, and portfolio of higher-rated CLO debt broaden its funding and income sources.
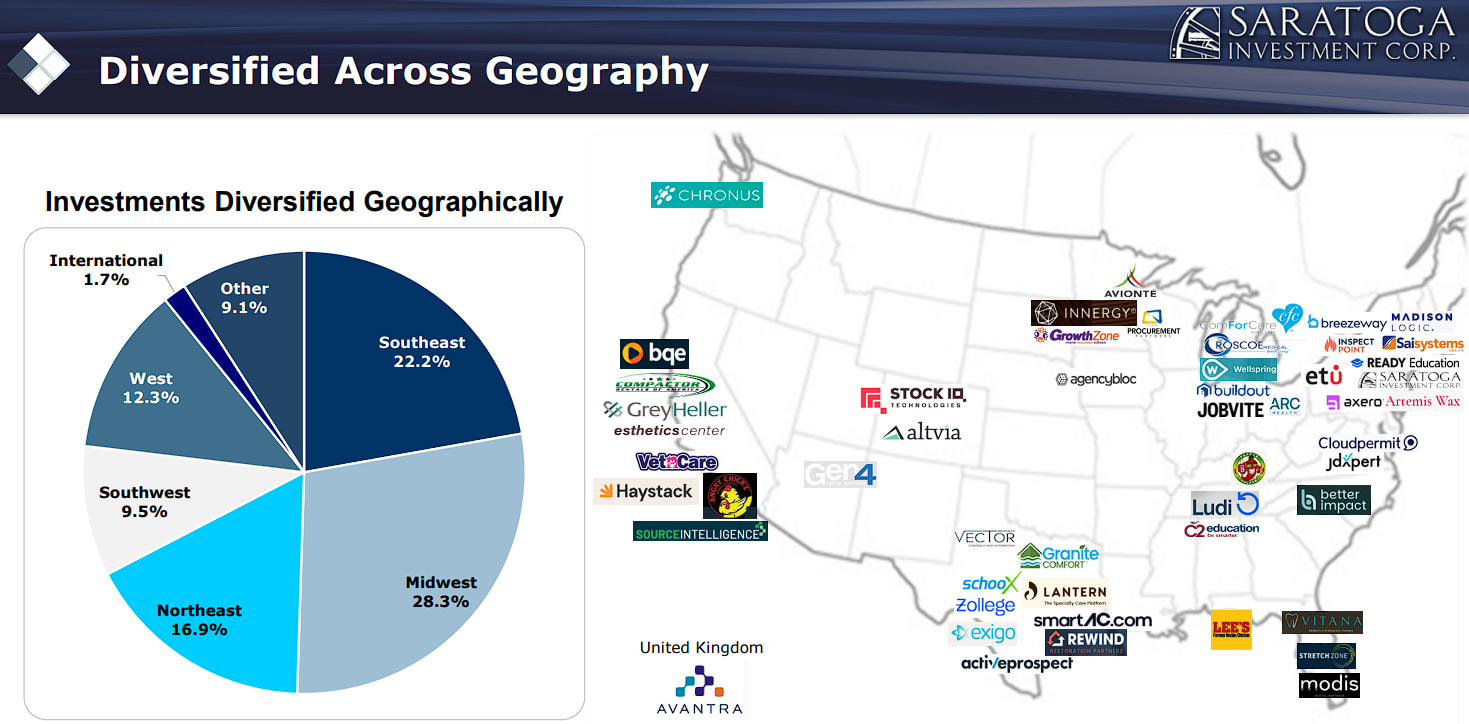
For the first fiscal quarter of 2027 ended May 31st, 2026, assets under management increased 1.6% sequentially to $1.126 billion as net originations totaled $30.8 million.
Total investment income was $30.8 million, while adjusted NII declined to $7.6 million, or $0.47 per share, from $0.66 one year earlier.
NAV fell 4.9% sequentially to $23.23 per share after $15.2 million of net portfolio depreciation.
Credit quality provided one encouraging signal, as non-accruals fell to zero at fair value, although several investments remained on the red watchlist.
Saratoga has increased its base dividend for five consecutive years and currently pays $0.25 per month, or $0.75 each quarter.
However, the latest adjusted NII covered only about 63% of that amount, and under-earning the distribution reduced NAV by $0.28 per share during the quarter.
The first-lien concentration and available liquidity are helpful, but improved recurring earnings are needed for the current payout to become more dependable.
Final Thoughts
BDCs can turn private-credit spreads into substantial current income, but this ranking also shows why projected return and dividend quality must be considered together.
All five selections currently have an F Dividend Risk Score, and each has a distinct pressure point despite its double-digit expected return.
SAR leads the ranking, but its distribution materially exceeds recurring NII, while PFLT recently reset its payout and HRZN is absorbing merger and credit-related NAV volatility.
PNNT still relies heavily on a supplemental dividend, while newcomer PSEC has improved its forward coverage by reducing the payout but continues to contend with persistent NAV erosion.
The most useful checkpoints are recurring NII coverage of the base dividend, NAV direction, non-accruals, leverage, portfolio concentration, and the share of each payout funded by temporary supplements or spillover income.
Accordingly, the ranking is best treated as a focused research shortlist. Do not treat it as a list of automatic purchases.
At Sure Dividend, we often advocate for investing in companies with a high probability of increasing their dividends each and every year.
If that strategy appeals to you, it may be useful to browse through the following databases of dividend growth stocks:
- The Dividend Aristocrats List: S&P 500 stocks with 25+ years of dividend increases.
- The Dividend Kings List is even more exclusive than the Dividend Aristocrats. It is comprised of stocks with 50+ years of consecutive dividend increases.
- The High Dividend Stocks List: stocks that appeal to investors interested in the highest yields of 4% or more.
- The Monthly Dividend Stocks List: stocks that pay dividends every month, for 12 dividend payments per year.
- The Dividend Champions List: stocks that have increased their dividends for 25+ consecutive years.
Note: Not all Dividend Champions are Dividend Aristocrats because Dividend Aristocrats have additional requirements like being in the S&P 500.