Updated on September 10th, 2026 by Nikolaos Sismanis
Real estate investment trusts – or REITs, for short – are compelling investment vehicles.
That’s because:
- They provide diversified real estate exposure
- Without the high up-front cost of traditional real estate
- They often have high dividend yields well in excess of the S&P 500
- They are required by law to distribute 90% of earnings to investors
Bonus: You can download your free 200+ REIT list spreadsheet, complete with metrics that matter, by clicking on the link below:
In addition to the downloadable Excel sheet of all REITs, this article discusses why income investors should pay particularly close attention to this asset class.
And, we also include our top 7 REITs today based on expected total returns.
Table Of Contents
In addition to the full downloadable Excel spreadsheet, this article covers our top 7 REITs today, as ranked using expected total returns from The Sure Analysis Research Database.
The table of contents below allows for easy navigation.
- Why Invest In REITs?
- REIT Financial Metrics
- The Top 7 REITs Today
#7: Canadian Apartment Properties REIT (CDPYF)
#6: Gaming and Leisure Properties (GLPI)
#5: Innovative Industrial Properties (IIPR)
#4: American Tower (AMT)
#3: Rexford Industrial Realty (REXR)
#2: VICI Properties (VICI)
#1: NexPoint Residential Trust (NXRT)
Why Invest in REITs?
REITs are, by design, a fantastic asset class for investors looking to generate income.
Thus, one of the primary benefits of investing in these securities is their high dividend yields.
The currently high dividend yields of REITs is not an isolated occurrence. In fact, this asset class has traded at a higher dividend yield than the S&P 500 for decades.
The high dividend yields of REITs are due to the regulatory implications of doing business as a real estate investment trust.
In exchange for listing as a REIT, these trusts must pay out at least 90% of their net income as dividend payments to their unit holders (REITs trade as units, not shares).
Sometimes you will see a payout ratio of less than 90% for a REIT, and that is likely because they are using funds from operations, not net income, in the denominator for REIT payout ratios (more on that later).
REIT Financial Metrics
REITs run unique business models. More than the vast majority of other business types, they are primarily involved in the ownership of long-lived assets.
From an accounting perspective, this means that REITs incur significant non-cash depreciation and amortization expenses.
How does this affect the bottom line of REITs?
Depreciation and amortization expenses reduce a company’s net income, which means that sometimes a REIT’s dividend will be higher than its net income, even though its dividends are safe based on cash flow.
To give a better sense of financial performance and dividend safety, REITs developed the financial metric funds from operations, or FFO.
Just like earnings, FFO can be reported on a per-unit basis, giving FFO/unit – the rough equivalent of earnings-per-share for a REIT.
FFO is determined by taking net income and adding back various non-cash charges that are seen to artificially impair a REIT’s perceived ability to pay its dividend.
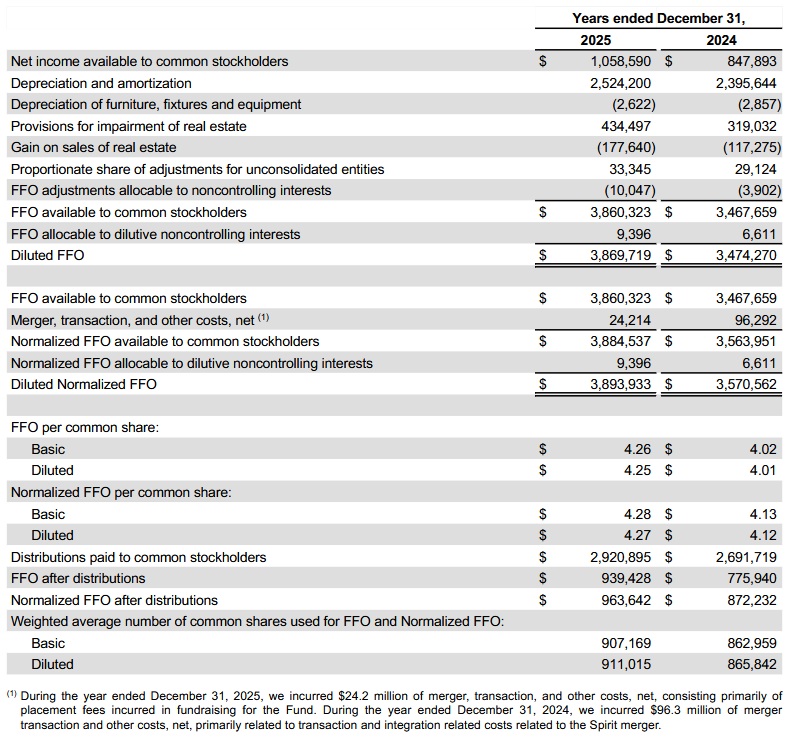
For an example of how FFO is calculated, consider the following net income-to-FFO reconciliation from Realty Income (O), one of the largest and most popular REIT securities.
Source: Realty Income 2025 Annual Report
In 2024, net income was $847 million while FFO available to stockholders was above $3.4 billion, a sizable difference between the two metrics.
This shows the profound effect that depreciation and amortization can have on the GAAP financial performance of real estate investment trusts.
The Top 7 REITs Today
Below we have ranked our top 7 REITs today based on expected total returns.
Expected total returns are in turn made up from dividend yield, expected growth on a per unit basis, and valuation multiple changes. Expected total return investing takes into account income (dividend yield), growth, and value.
Note: The REITs below have not been vetted for safety. These are high expected total return securities, but they may come with elevated risks.
We encourage investors to fully consider the risk/reward profile of these investments.
For the Top 10 REITs each month, based on expected total returns and safety, see our Top 10 REITs service.
Top REIT #7: Canadian Apartment Properties REIT (CDPYF)
- Expected Total Return: 13.8%
- Dividend Yield: 4.8%
Canadian Apartment Properties REIT is Canada’s largest publicly traded residential REIT, with 45,460 apartment suites and townhomes as of June 30th, 2026.
Most of the portfolio is in Canada, although the trust retains a smaller Netherlands presence.
Second-quarter operating revenue declined 3.2% to C$246.4 million, primarily because property sales reduced the asset base.
Diluted FFO per unit slipped 1.1% to C$0.654, while Canadian same-property NOI increased 0.9% and the NOI margin held at 66.2%.
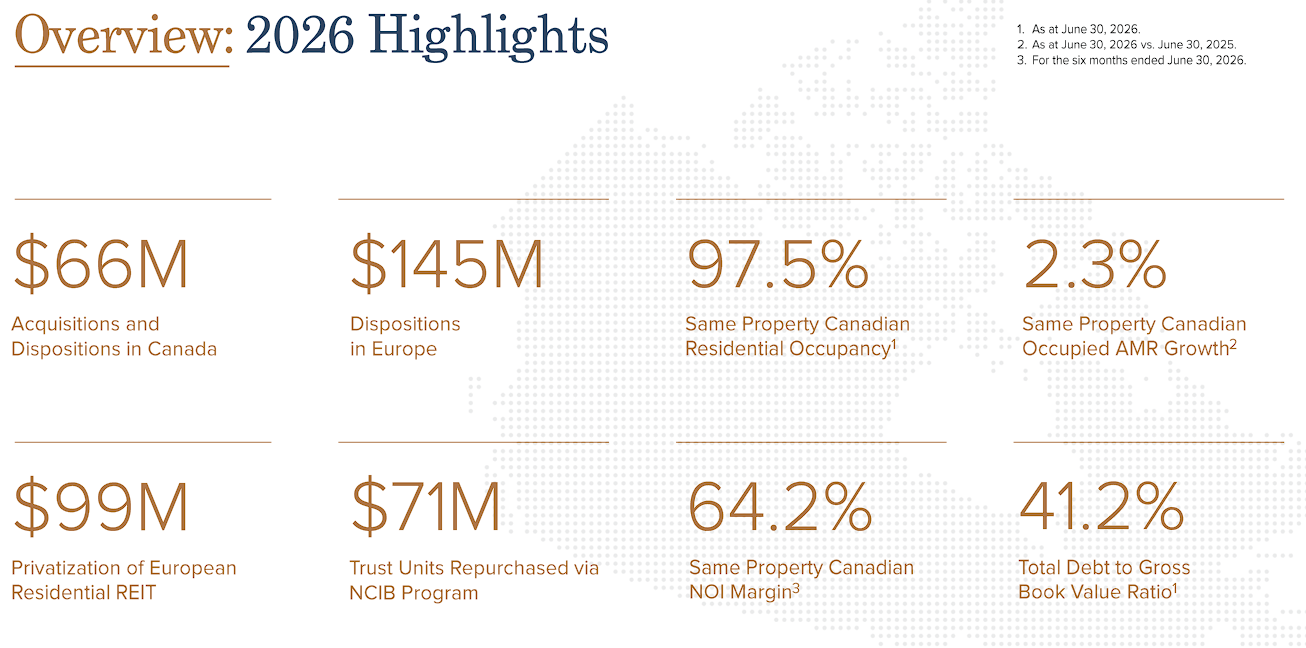
Canadian same-property occupied average monthly rent rose 2.3%, but occupancy declined to 97.5% from 98.4% one year earlier as rental-market conditions softened.
CAPREIT is recycling capital by selling selected properties, buying back units, and seeking newer mid-market rentals at prices below replacement cost.
It completed C$173.9 million of dispositions during the first half and repurchased C$59.5 million of units.
The trust pays monthly distributions, which totaled C$0.388 per unit during the quarter and consumed 59.2% of FFO.
CAPREIT has never cut its distribution in more than 25 years; excluding a freeze in 2022, it has raised the payout annually since 2012.
Investors should weigh that record and the low payout ratio against softer occupancy, a 41.2% debt-to-gross-book-value ratio, interest costs, and currency risk for the U.S.-traded shares.
Deep Dive: Click here to download (for free) our most recent 3-Page Sure Analysis PDF report on CDPYF.
Top REIT #6: Gaming and Leisure Properties (GLPI)
- Expected Total Return: 13.9%
- Dividend Yield: 7.8%
Gaming and Leisure Properties owns 71 gaming properties across 21 states and leases them to casino operators under long-term triple-net agreements.

This structure places property-level expenses with tenants and gives the REIT contractual rent streams, although operator concentration remains an important risk.
Second-quarter revenue increased 9.0% to $430.5 million, while adjusted FFO rose to $304.0 million from $276.1 million.
Adjusted FFO per share advanced 7.3% to $1.03, and management raised full-year guidance to $4.10 to $4.12 per share.
Growth is coming from sale-leaseback transactions and development funding for tenants.
GLPI invested $191 million in tenant projects during the quarter and completed its $225 million commitment for PENN Entertainment’s Hollywood Casino Aurora conversion.
Management expects another $400 million to $450 million of development funding in the second half of 2026.
The quarterly dividend was raised 5.1% in May to $0.82 per share and was maintained at that rate in September, equaling $3.28 annualized.
GLPI has increased its regular payout for seven consecutive years, and the dividend consumes roughly 80% of projected adjusted FFO.
The high yield is supported by long leases and current coverage, but investors should monitor tenant health, the cost of financing the development pipeline, and leverage of approximately 4.8 times net debt to adjusted EBITDA.
Deep Dive: Click here to download (for free) our most recent 3-Page Sure Analysis PDF report on GLPI.
Top REIT #5: Innovative Industrial Properties (IIPR)
- Expected Total Return: 14.4%
- Dividend Yield: 13.3%
Innovative Industrial Properties is an internally managed specialty REIT that owns regulated-cannabis cultivation and processing facilities, alongside selected life-science investments.
At June 30th, 2026, it owned 108 properties totaling 8.4 million rentable square feet across 19 states and had invested $2.4 billion in the portfolio.

Second-quarter revenue increased 0.7% to $63.3 million, while adjusted FFO per share rose 7.0% to $1.83.
Portfolio stabilization remains the central issue because several cannabis tenants have experienced financial distress.
During the quarter, IIPR executed a new Curaleaf lease at a former PharmaCann property and continued working toward replacement tenants for four former 4Front properties.
It also sold a New York property for $88.5 million, including seller financing, and fully funded its $270 million strategic life-science investment with IQHQ.
Liquidity was $299.7 million, while net debt equaled 14.2% of gross assets.
The quarterly dividend remains $1.90 per share, or $7.60 annualized, after seven consecutive years of increases.
However, the dividend exceeded second-quarter adjusted FFO and the SARD payout ratio is approximately 109%.
The exceptionally high yield therefore comes with meaningful tenant-credit, collection, re-leasing, and payout risks, making successful portfolio recovery more important than the headline yield alone.
Deep Dive: Click here to download (for free) our most recent 3-Page Sure Analysis PDF report on IIPR.
Top REIT #4: American Tower (AMT)
- Expected Total Return: 14.7%
- Dividend Yield: 4.1%
American Tower is one of the world’s largest communications-infrastructure REITs, leasing space on towers and other sites to wireless carriers while also owning the CoreSite data-center platform.
The model benefits from recurring contractual revenue and long-term demand for mobile data, cloud connectivity, and low-latency computing.
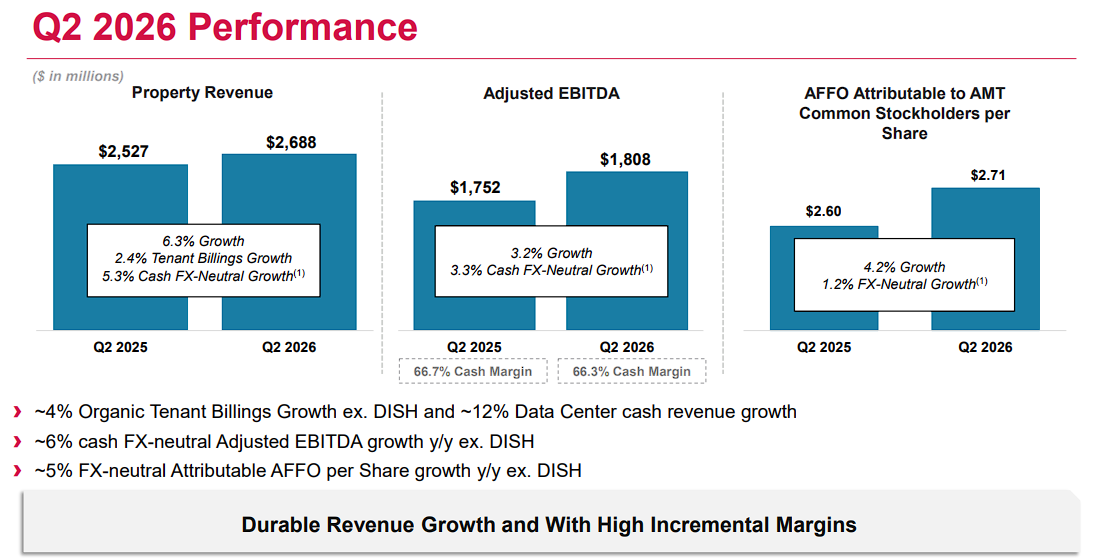
Second-quarter revenue increased 4.7% to $2.75 billion, while property revenue grew 6.3% to $2.69 billion.
AFFO attributable to common shareholders rose 3.8% to $1.26 billion, and AFFO per share increased 4.2% to $2.71.
Free cash flow grew 19.6% to $1.16 billion, although net leverage remained elevated at 4.9 times annualized adjusted EBITDA.
CoreSite posted record leasing activity as hybrid-cloud and artificial-intelligence workloads supported data-center demand.
American Tower raised its 2026 outlook again and now expects AFFO per share of $11.00 to $11.17.
The REIT pays a quarterly dividend of $1.79 per share, or $7.16 annualized, after 15 consecutive years of dividend growth.
That payout represents roughly 65% of expected AFFO, providing more coverage than many high-yield REITs.
The investment case combines digital-infrastructure growth with current income, but investors should still monitor carrier consolidation, foreign-currency exposure, interest expense, and management’s progress reducing leverage.
Deep Dive: Click here to download (for free) our most recent 3-Page Sure Analysis PDF report on AMT.
Top REIT #3: Rexford Industrial Realty (REXR)
- Expected Total Return: 16.0%
- Dividend Yield: 4.7%
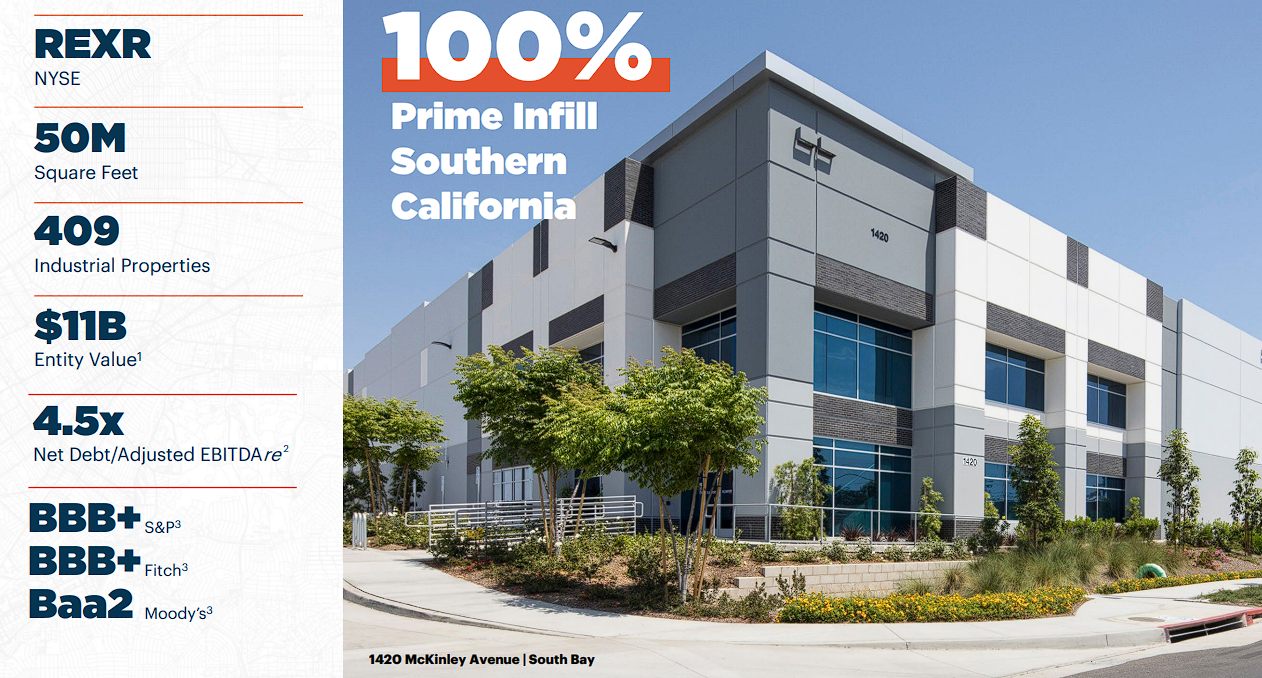
Rexford Industrial Realty owns, operates, and redevelops industrial properties exclusively in infill Southern California, where limited land and a large consumption base support long-term demand.
As of June 30th, 2026, the portfolio included 409 properties and approximately 50 million square feet.
Second-quarter Core FFO increased 1.2% to $141.4 million, while Core FFO per share rose 6.8% to $0.63.
Same-property cash NOI grew 1.5%, average same-property occupancy was 95.7%, and the company completed 2.1 million square feet of leasing.
However, comparable rents declined 2.8% on a net-effective basis and 11.3% on a cash basis.
Rexford is addressing slower leasing conditions through a major portfolio realignment.
In August, it agreed to sell a portfolio for approximately $1.2 billion, bringing year-to-date dispositions completed or under contract to $1.5 billion and moving toward its $2.0 billion target.
Proceeds can reduce debt or support repurchases under the new $1.0 billion authorization.
The quarterly dividend is $0.435 per share, or $1.74 annualized, following 12 consecutive years of growth.
Updated 2026 Core FFO guidance of $2.38 to $2.43 implies reasonable coverage, but execution of the sale program and stabilization of leasing spreads are critical to the expected-return case.
Deep Dive: Click here to download (for free) our most recent 3-Page Sure Analysis PDF report on REXR.
Top REIT #2: VICI Properties (VICI)
- Expected Total Return: 17.6%
- Dividend Yield: 7.1%
VICI Properties is an experiential net-lease REIT whose portfolio includes major gaming, hospitality, wellness, entertainment, and leisure destinations.
Its long-term triple-net leases shift property expenses to tenants and generally include contractual rent escalators, creating a predictable base of rental income.
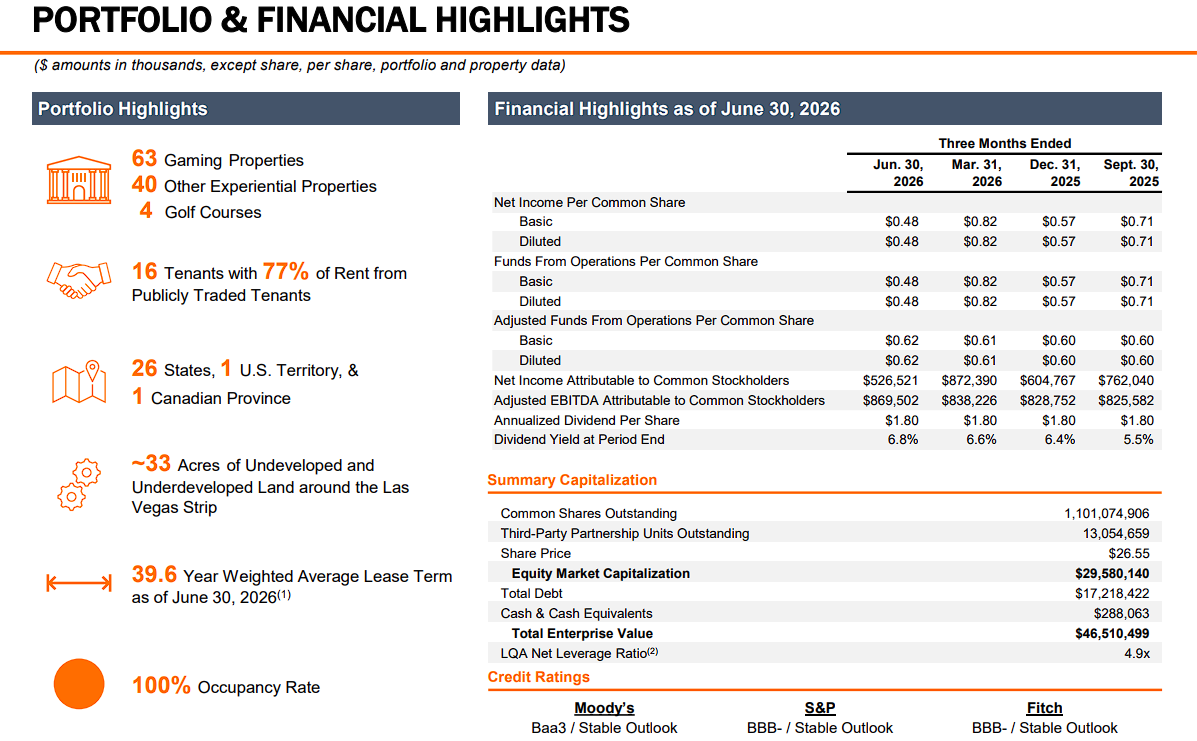
Second-quarter revenue increased 5.7% to $1.1 billion, while AFFO attributable to common shareholders grew 7.8% to $679.6 million.
AFFO per share rose 4.6% to $0.62, and management updated full-year guidance to $2.45 to $2.47 per share.
VICI continued expanding and diversifying its tenant roster.
It closed the $1.16 billion acquisition of seven Nevada casino properties, added gaming assets in Alberta, and began a build-to-suit relationship with Club Med in St. Croix.
These investments broaden exposure beyond the largest legacy operators, although Caesars Entertainment and MGM Resorts still represent important tenant concentrations.
On September 3rd, VICI raised its quarterly dividend 2.2% to $0.46 per share, or $1.84 annualized, marking its eighth consecutive year of dividend growth.
The new payout remains comfortably covered by projected AFFO.
The yield and embedded lease escalators are attractive, but investors should monitor tenant credit, acquisition underwriting, and the cost of funding continued portfolio expansion.
Deep Dive: Click here to download (for free) our most recent 3-Page Sure Analysis PDF report on VICI.
Top REIT #1: NexPoint Residential Trust (NXRT)
- Expected Total Return: 20.6%
- Dividend Yield: 8.9%
NexPoint Residential Trust owns middle-income apartment communities with value-add potential in large Sun Belt markets across the Southeastern and Southwestern United States.
Its strategy centers on renovating units, improving amenities, and raising rents while retaining an affordable position relative to newly built apartments.
Second-quarter revenue increased to $64.6 million from $63.1 million, but same-store revenue declined 0.6% and same-store NOI fell 2.9%.
Core FFO decreased to $0.66 per share from $0.71, while AFFO slipped to $0.77 from $0.80.
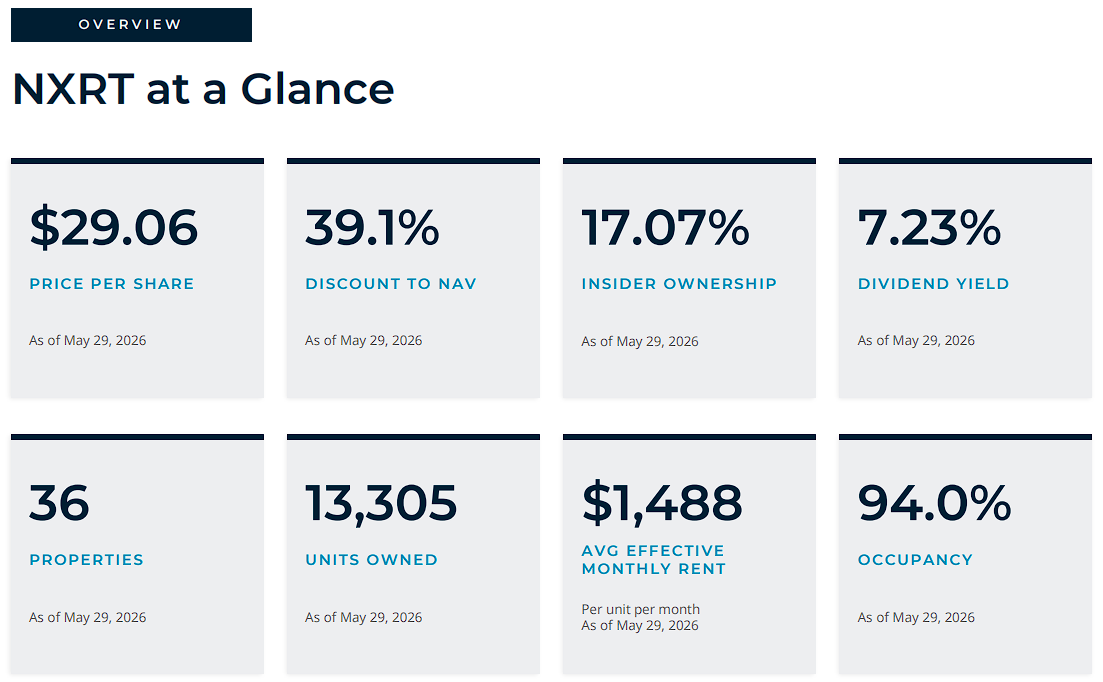
The 36-property portfolio contained 13,305 units, with 93.5% physical occupancy and a $1,490 weighted-average monthly rent.
The value-add program remained productive: NXRT completed 459 upgrades during the quarter at a 23% return on investment.
However, management lowered its 2026 AFFO-per-share outlook to a midpoint of $2.86 as supply and operating pressure weighed on same-store performance.
The quarterly dividend is $0.53 per share, or $2.12 annualized, after 10 consecutive years of increases.
That payout represents roughly 74% of expected AFFO.
The unusually high projected return reflects the yield and valuation upside, but it also depends on stabilizing rents and NOI while managing leverage, refinancing costs, and continued apartment supply in Sun Belt markets.
Deep Dive: Click here to download (for free) our most recent 3-Page Sure Analysis PDF report on NXRT.
Final Thoughts
Our REITs Spreadsheet provides a broad starting point for researching publicly traded real estate investment trusts, while the seven names above represent the highest expected returns in the current Sure Analysis universe.
The opportunities span several property types.
For example, NexPoint offers Sun Belt apartments, while VICI and Gaming and Leisure Properties provide gaming-related net leases.
Rexford focuses on Southern California industrial real estate, American Tower owns digital infrastructure, Innovative Industrial Properties serves regulated cannabis operators, and CAPREIT adds Canadian residential exposure.
These high projected returns should not be confused with uniformly low risk.
Several companies face meaningful tenant, leverage, refinancing, occupancy, or payout challenges, and the estimates rely partly on valuation recovery that may not occur on schedule.
Investors should therefore examine AFFO coverage, balance-sheet strength, tenant quality, and property-level fundamentals alongside the headline yield and expected-return estimate.
You can see more high-quality dividend stocks in the following Sure Dividend databases, each based on long streaks of steadily rising dividend payments:
- Dividend Kings List: Dividend Stocks With 50+ Years of Rising Dividends
- Dividend Aristocrats List: 25+ Years of Rising Dividends
You might also be looking to create a highly customized dividend income stream to pay for life’s expenses.
The following lists provide useful information on high dividend stocks and stocks that pay monthly dividends: