Updated on July 7th, 2026 by Bob Ciura
Monthly dividend stocks have instant appeal for many income investors. Stocks that pay their dividends each month offer more frequent payouts than traditional quarterly or semi-annual dividend payers.
For this reason, we created a full list of over 100 monthly dividend stocks.
You can download our full Excel spreadsheet of all monthly dividend stocks (along with metrics that matter like dividend yield and payout ratio) by clicking on the link below:
In addition, stocks that have high dividend yields are also attractive for income investors.
With the average S&P 500 yield hovering around 1.2%, investors can generate much more income with high-yield stocks. Screening for monthly dividend stocks that also have high dividend yields makes for an appealing combination.
This article will list the 20 highest-yielding monthly dividend stocks.
Table Of Contents
The following 20 monthly dividend stocks have high dividend yields above 5%. Stocks are listed by their dividend yields, from lowest to highest.
The list excludes oil and gas royalty trusts, which have extreme fluctuations in their dividend payouts from one quarter to the next due to the underlying volatility of commodity prices.
You can instantly jump to an individual section of the article by utilizing the links below:
- High-Yield Monthly Dividend Stock #20: Bridgemarq Real Estate Services (BREUF)
- High-Yield Monthly Dividend Stock #19: Timbercreek Financial Corp. (TBCRF)
- High-Yield Monthly Dividend Stock #18: MSC Income Fund (MSIF)
- High-Yield Monthly Dividend Stock #17: Ellington Financial (EFC)
- High-Yield Monthly Dividend Stock #16: Trinity Capital (TRIN)
- High-Yield Monthly Dividend Stock #15: AGNC Investment Corporation (AGNC)
- High-Yield Monthly Dividend Stock #14: PennantPark Floating Rate Capital (PFLT)
- High-Yield Monthly Dividend Stock #13: Saratoga Investment Corp. (SAR)
- High-Yield Monthly Dividend Stock #12: BCP Investment Corporation (BCIC)
- High-Yield Monthly Dividend Stock #11: Dynex Capital (DX)
- High-Yield Monthly Dividend Stock #10: Horizon Technology Finance (HRZN)
- High-Yield Monthly Dividend Stock #9: Stellus Capital (SCM)
- High-Yield Monthly Dividend Stock #8: ARMOUR Residential REIT (ARR)
- High-Yield Monthly Dividend Stock #7: Orchid Island Capital (ORC)
- High-Yield Monthly Dividend Stock #6: Invesco Mortgage Capital (IVR)
- High-Yield Monthly Dividend Stock #5: Prospect Capital (PSEC)
- High-Yield Monthly Dividend Stock #4: CION Investment Corporation (CION)
- High-Yield Monthly Dividend Stock #3: Ellington Credit Co. (EARN)
- High-Yield Monthly Dividend Stock #2: PennantPark Investment Corporation (PNNT)
- High-Yield Monthly Dividend Stock #1: Oxford Square Capital (OXSQ)
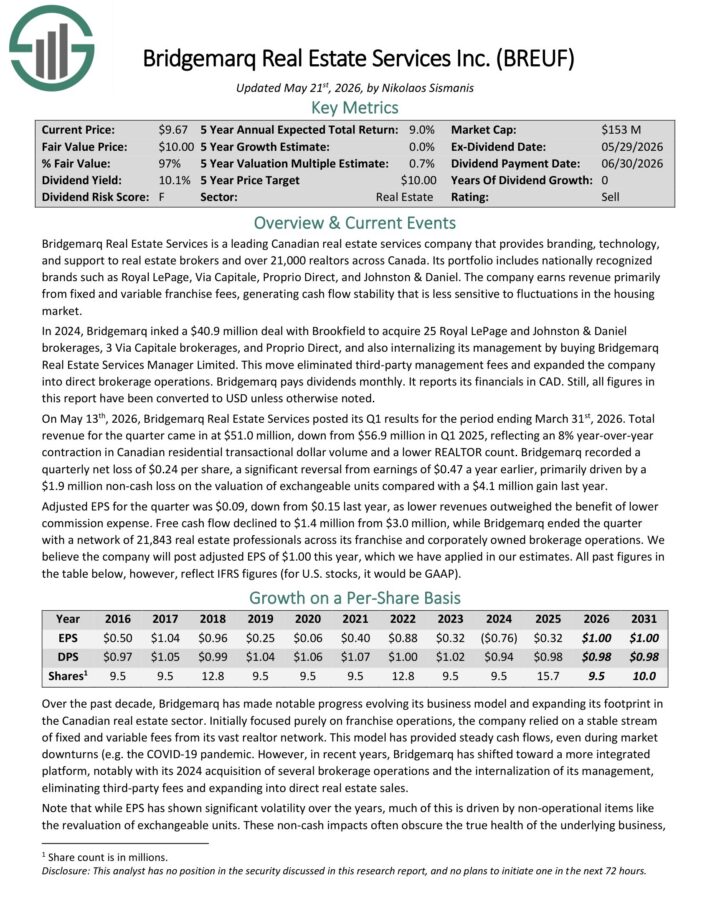
High-Yield Monthly Dividend Stock #20: Bridgemarq Real Estate Services (BREUF)
- Dividend Yield: 10.4%
Bridgemarq Real Estate Services is a leading Canadian real estate services company that provides branding, technology, and support to real estate brokers and over 21,000 realtors across Canada.
Its portfolio includes nationally recognized brands such as Royal LePage, Via Capitale, Proprio Direct, and Johnston & Daniel.
The company earns revenue primarily from fixed and variable franchise fees, generating cash flow stability that is less sensitive to fluctuations in the housing market.
On May 13th, 2026, Bridgemarq Real Estate Services posted its Q1 results for the period ending March 31st, 2026. Total revenue for the quarter came in at $51.0 million, down from $56.9 million in Q1 2025, reflecting an 8% year-over-year contraction in Canadian residential transactional dollar volume and a lower REALTOR count.
Bridgemarq recorded a quarterly net loss of $0.24 per share, a significant reversal from earnings of $0.47 a year earlier, primarily driven by a $1.9 million non-cash loss on the valuation of exchangeable units compared with a $4.1 million gain last year.
Adjusted EPS for the quarter was $0.09, down from $0.15 last year, as lower revenues outweighed the benefit of lower commission expense.
Click here to download our most recent Sure Analysis report on BREUF (preview of page 1 of 3 shown below):
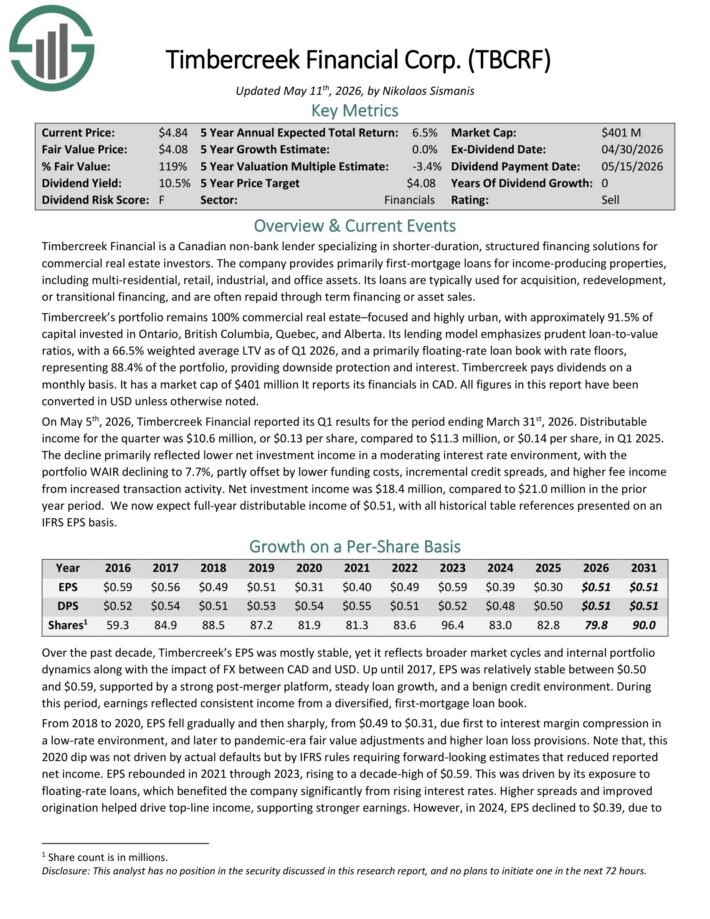
High-Yield Monthly Dividend Stock #19: Timbercreek Financial Corp. (TBCRF)
- Dividend Yield: 11.1%
Timbercreek Financial is a Canadian non-bank lender specializing in shorter-duration, structured financing solutions for commercial real estate investors.
The company provides primarily first-mortgage loans for income-producing properties, including multi-residential, retail, industrial, and office assets. Its loans are typically used for acquisition, redevelopment, or transitional financing, and are often repaid through term financing or asset sales.
Timbercreek’s portfolio is 100% commercial real estate-focused and highly urban, with about 92% of capital invested in Ontario, British Columbia, Quebec, and Alberta.
On May 5th, 2026, Timbercreek Financial reported its Q1 results for the period ending March 31st, 2026. Distributable income for the quarter was $10.6 million, or $0.13 per share, compared to $11.3 million, or $0.14 per share, in Q1 2025.
The decline primarily reflected lower net investment income in a moderating interest rate environment, with the portfolio WAIR declining to 7.7%, partly offset by lower funding costs, incremental credit spreads, and higher fee income from increased transaction activity.
Net investment income was $18.4 million, compared to $21.0 million in the prior year period.
Click here to download our most recent Sure Analysis report on TBCRF (preview of page 1 of 3 shown below):
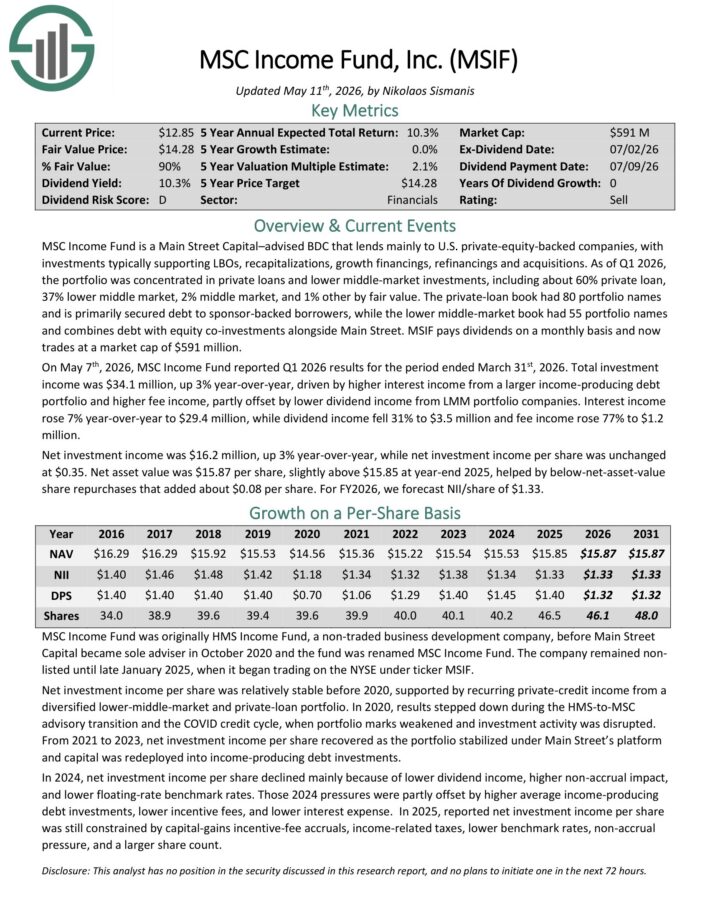
High-Yield Monthly Dividend Stock #18: MSC Income Fund (MSIF)
- Dividend Yield: 10.8%
MSC Income Fund is a Main Street Capital–advised BDC that lends mainly to U.S. private-equity-backed companies, with investments typically supporting LBOs, recapitalizations, growth financings, refinancings and acquisitions.
As of Q1 2026, the portfolio was concentrated in private loans and lower middle-market investments, including about 60% private loan, 37% lower middle market, 2% middle market, and 1% other by fair value.
The private-loan book had 80 portfolio names and is primarily secured debt to sponsor-backed borrowers, while the lower middle-market book had 55 portfolio names and combines debt with equity co-investments alongside Main Street.
On May 7th, 2026, MSC Income Fund reported Q1 2026 results. Total investment income was $34.1 million, up 3% year-over-year, driven by higher interest income from a larger income-producing debt portfolio and higher fee income, partly offset by lower dividend income from LMM portfolio companies.
Interest income rose 7% year-over-year to $29.4 million, while dividend income fell 31% to $3.5 million and fee income rose 77% to $1.2 million.
Net investment income was $16.2 million, up 3% year-over-year, while net investment income per share was unchanged at $0.35. Net asset value was $15.87 per share, slightly above $15.85 at year-end 2025.
Click here to download our most recent Sure Analysis report on MSIF (preview of page 1 of 3 shown below):
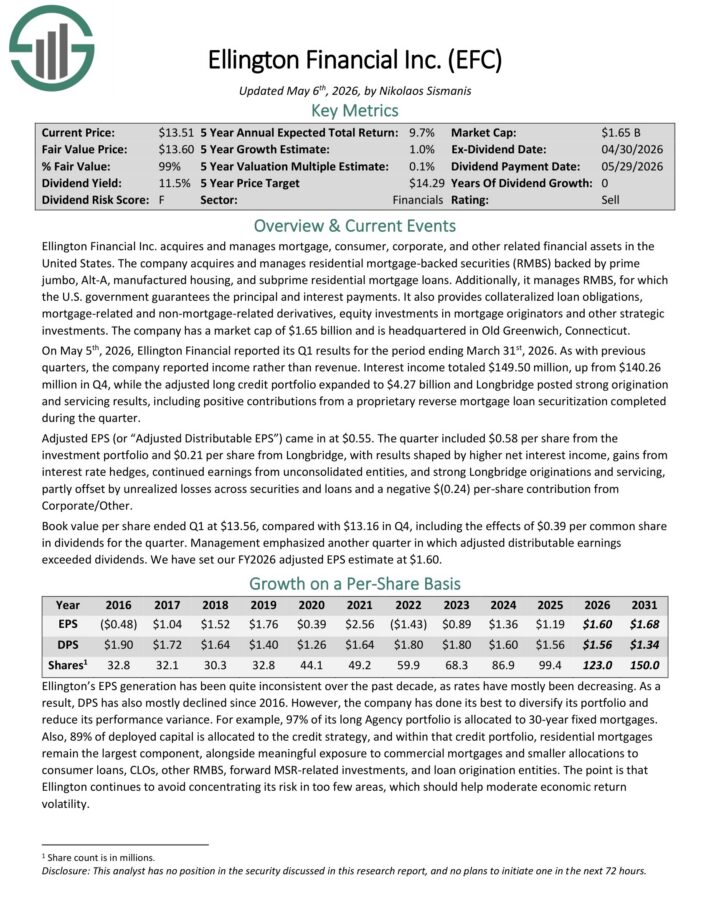
High-Yield Monthly Dividend Stock #17: Ellington Financial (EFC)
- Dividend Yield: 11.5%
Ellington Financial Inc. acquires and manages mortgage, consumer, corporate, and other related financial assets in the United States.
The company acquires and manages residential mortgage–backed securities (RMBS) backed by prime jumbo, Alt–A, manufactured housing, and subprime residential mortgage loans.
Additionally, it manages RMBS, for which the U.S. government guarantees the principal and interest payments. It also provides collateralized loan obligations, mortgage–related and non–mortgage–related derivatives, equity investments in mortgage originators and other strategic investments.
On May 5th, 2026, Ellington Financial reported its Q1 results for the period ending March 31st, 2026. Interest income totaled $149.50 million, up from $140.26 million in Q4.
The adjusted long credit portfolio expanded to $4.27 billion and Longbridge posted strong origination and servicing results, including positive contributions from a proprietary reverse mortgage loan securitization completed during the quarter.
Adjusted EPS came in at $0.55. The quarter included $0.58 per share from the investment portfolio and $0.21 per share from Longbridge.
Results were shaped by higher net interest income, gains from interest rate hedges, continued earnings from unconsolidated entities, and strong Longbridge originations and servicing, partly offset by unrealized losses across securities and loans and a negative $(0.24) per-share contribution from Corporate/Other.
Click here to download our most recent Sure Analysis report on Ellington Financial (EFC) (preview of page 1 of 3 shown below):
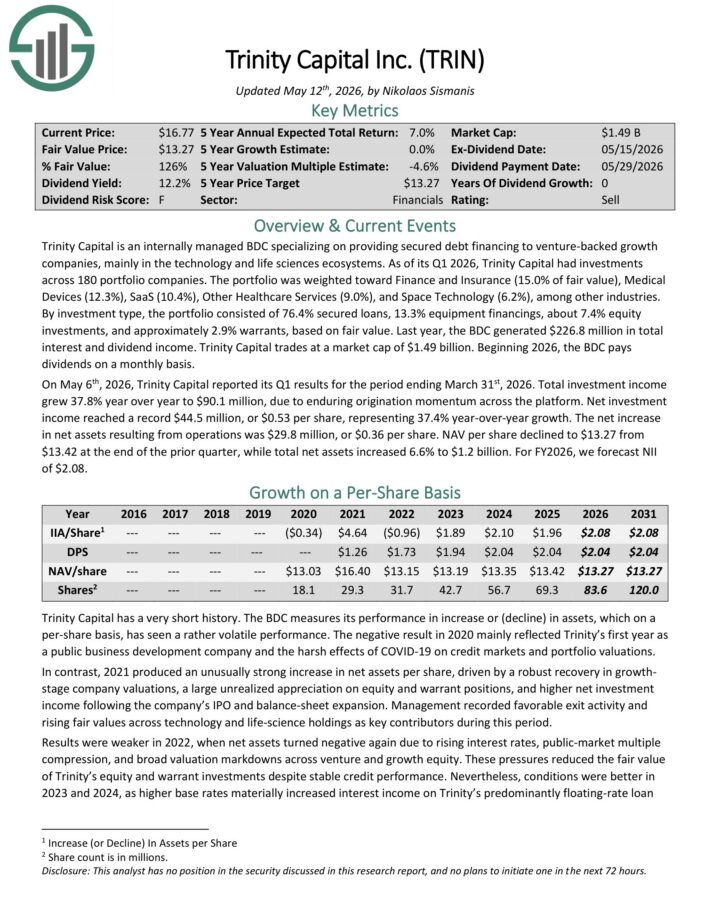
High-Yield Monthly Dividend Stock #16: Trinity Capital (TRIN)
- Dividend Yield: 11.6%
Trinity Capital is an internally managed BDC specializing on providing secured debt financing to venture-backed growth companies, mainly in the technology and life sciences ecosystems.
As of its latest quarterly filings, it has investments in 97 portfolio companies, with the portfolio weighted toward Finance & Insurance (~15.8%), SaaS (~10.3%), Healthcare Services (~10.1%), Medical Devices (~9.9%), and Space Technology (~8.6%), among other industries.
On May 6th, 2026, Trinity Capital reported its Q1 results. Total investment income grew 37.8% year over year to $90.1 million, due to enduring origination momentum across the platform. Net investment income reached a record $44.5 million, or $0.53 per share, representing 37.4% year-over-year growth.
The net increase in net assets resulting from operations was $29.8 million, or $0.36 per share. NAV per share declined to $13.27 from $13.42 at the end of the prior quarter, while total net assets increased 6.6% to $1.2 billion.
Click here to download our most recent Sure Analysis report on TRIN (preview of page 1 of 3 shown below):
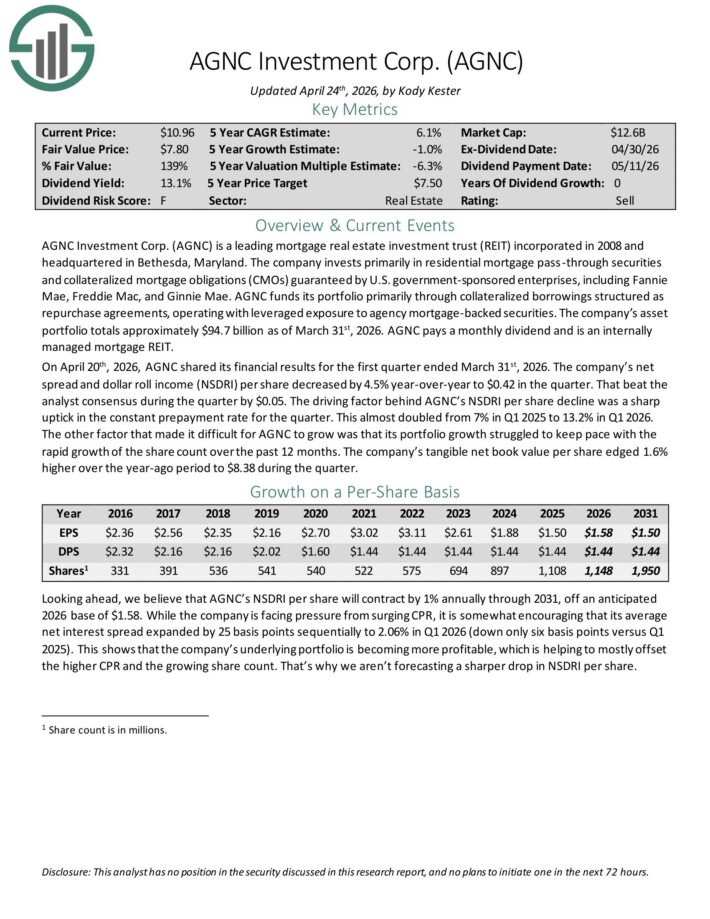
High-Yield Monthly Dividend Stock #15: AGNC Investment Corporation (AGNC)
- Dividend Yield: 12.9%
American Capital Agency Corp is a mortgage real estate investment trust that invests primarily in agency mortgage–backed securities (or MBS) on a leveraged basis.
The firm’s asset portfolio is comprised of residential mortgage pass–through securities, collateralized mortgage obligations (or CMO), and non–agency MBS. Many of these are guaranteed by government–sponsored enterprises.
On April 20th, 2026, AGNC shared its financial results for the first quarter ended March 31st, 2026. The company’s net spread and dollar roll income (NSDRI) per share decreased by 4.5% year-over-year to $0.42 in the quarter.
That beat the analyst consensus during the quarter by $0.05. The driving factor behind AGNC’s NSDRI per share decline was a sharp uptick in the constant prepayment rate for the quarter.
This almost doubled from 7% in Q1 2025 to 13.2% in Q1 2026.
Click here to download our most recent Sure Analysis report on AGNC Investment Corp (AGNC) (preview of page 1 of 3 shown below):
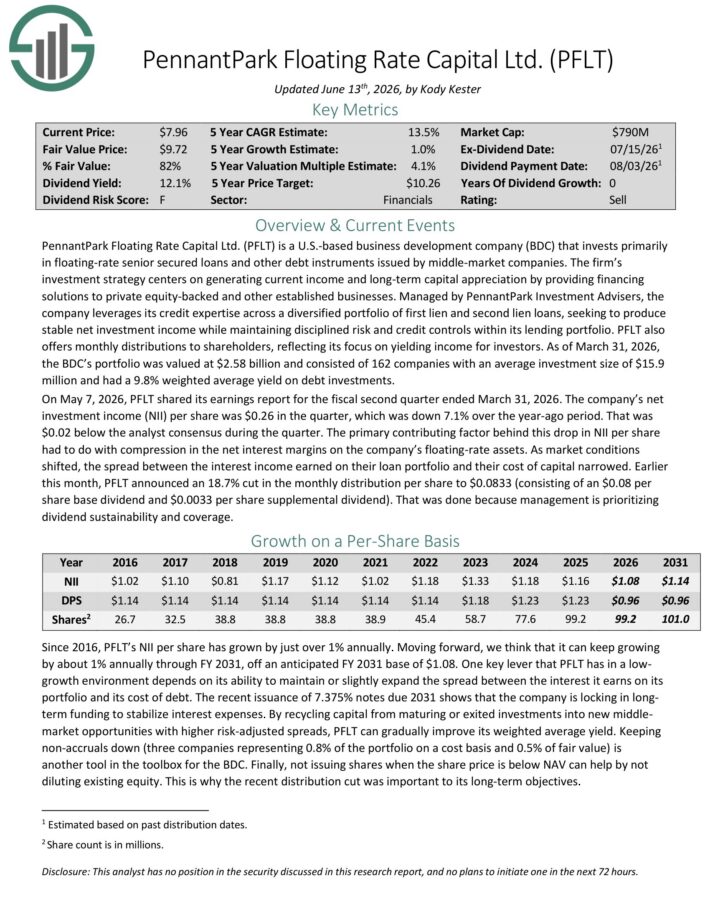
High-Yield Monthly Dividend Stock #14: PennantPark Floating Rate Capital (PFLT)
- Dividend Yield: 13.1%
PennantPark Floating Rate Capital Ltd. is a business development company that seeks to make secondary direct, debt, equity, and loan investments.
The fund also aims to invest through floating rate loans in private or thinly traded or small market-cap, public middle market companies, equity securities, preferred stock, common stock, warrants or options received in connection with debt investments or through direct investments.
On May 7, 2026, PFLT shared its earnings report for the fiscal second quarter ended March 31, 2026. The company’s net investment income (NII) per share was $0.26 in the quarter, which was down 7.1% over the year-ago period. That was $0.02 below the analyst consensus during the quarter.
The primary contributing factor behind this drop in NII per share had to do with compression in the net interest margins on the company’s floating-rate assets. As market conditions shifted, the spread between the interest income earned on their loan portfolio and their cost of capital narrowed.
Earlier this month, PFLT announced an 18.7% cut in the monthly distribution per share to $0.0833 (consisting of an $0.08 per share base dividend and $0.0033 per share supplemental dividend).
Click here to download our most recent Sure Analysis report on PFLT (preview of page 1 of 3 shown below):
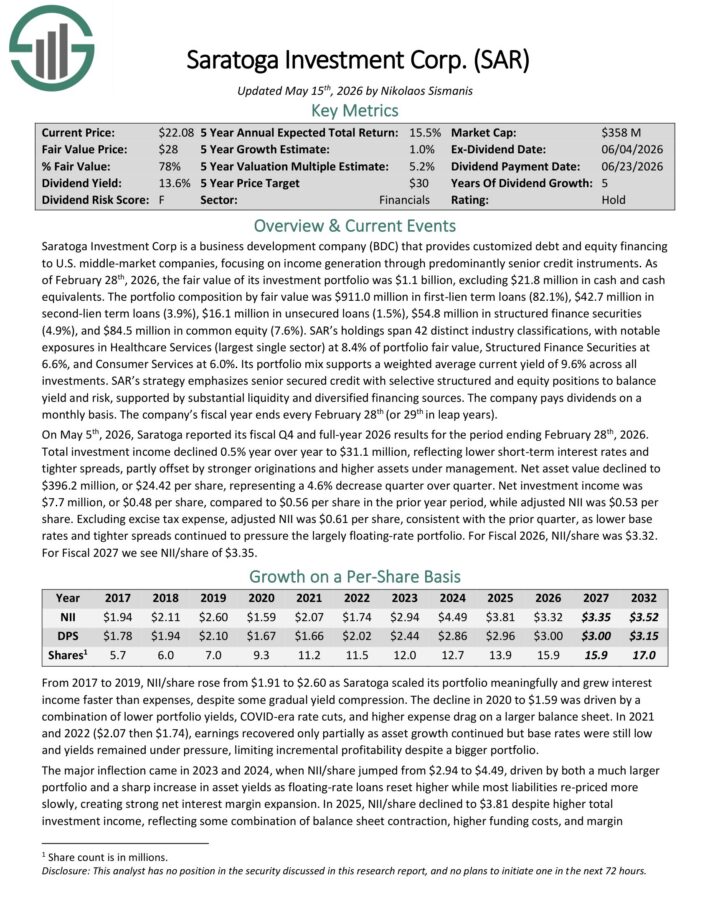
High-Yield Monthly Dividend Stock #13: Saratoga Investment Corp. (SAR)
- Dividend Yield: 14.0%
Saratoga Investment Corp is a BDC that provides customized debt and equity financing to U.S. middle-market companies, focusing on income generation through predominantly senior credit instruments.
As of February 28th, 2026, the fair value of its investment portfolio was $1.1 billion, excluding $21.8 million in cash and cash equivalents.
The portfolio composition by fair value was $911.0 million in first-lien term loans (82.1%), $42.7 million in second-lien term loans (3.9%), $16.1 million in unsecured loans (1.5%), $54.8 million in structured finance securities (4.9%), and $84.5 million in common equity (7.6%).
SAR’s holdings span 39 distinct industry classifications, with notable exposures in Healthcare Services (largest single sector) at 9.7% of portfolio fair value, Structured Finance Securities at 7.3%, and Consumer Services at 6.0%.
On May 5th, 2026, Saratoga reported its fiscal Q4 and full-year 2026 results. Total investment income declined 0.5% year over year to $31.1 million, reflecting lower short-term interest rates and tighter spreads, partly offset by stronger originations and higher assets under management.
Net asset value declined to $396.2 million, or $24.42 per share, representing a 4.6% decrease quarter over quarter. Net investment income was $7.7 million, or $0.48 per share, compared to $0.56 per share in the prior year period, while adjusted NII was $0.53 per share.
Click here to download our most recent Sure Analysis report on SAR (preview of page 1 of 3 shown below):
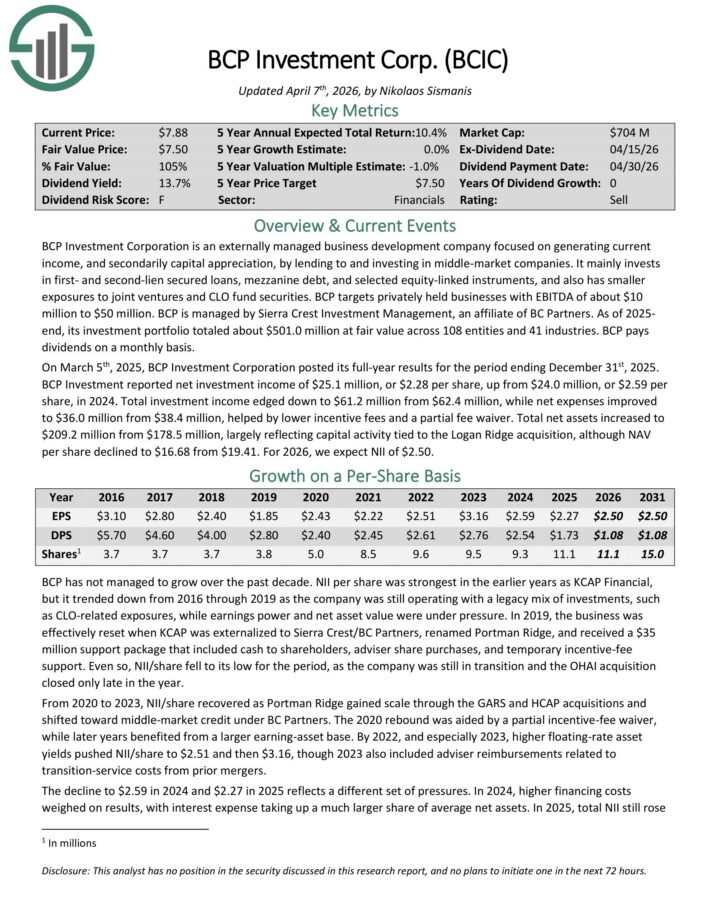
High-Yield Monthly Dividend Stock #12: BCP Investment Corporation (BCIC)
- Dividend Yield: 14.6%
BCP Investment Corporation is an externally managed business development company focused on generating current income, and secondarily capital appreciation, by lending to and investing in middle-market companies.
It mainly invests in first- and second-lien secured loans, mezzanine debt, and selected equity-linked instruments, and also has smaller exposures to joint ventures and CLO fund securities.
BCP targets privately held businesses with EBITDA of about $10 million to $50 million. BCP is managed by Sierra Crest Investment Management, an affiliate of BC Partners.
As of 2025 end, its investment portfolio totaled about $501.0 million at fair value across 108 entities and 41 industries.
On March 5th, 2025, BCP Investment Corporation posted its full-year results for the period ending December 31st, 2025. BCP Investment reported net investment income of $25.1 million, or $2.28 per share, up from $24.0 million, or $2.59 per share, in 2024.
Total investment income edged down to $61.2 million from $62.4 million, while net expenses improved to $36.0 million from $38.4 million, helped by lower incentive fees and a partial fee waiver.
Total net assets increased to $209.2 million from $178.5 million, largely reflecting capital activity tied to the Logan Ridge acquisition, although NAV per share declined to $16.68 from $19.41.
For 2026, we expect NII of $2.50.
Click here to download our most recent Sure Analysis report on BCIC (preview of page 1 of 3 shown below):
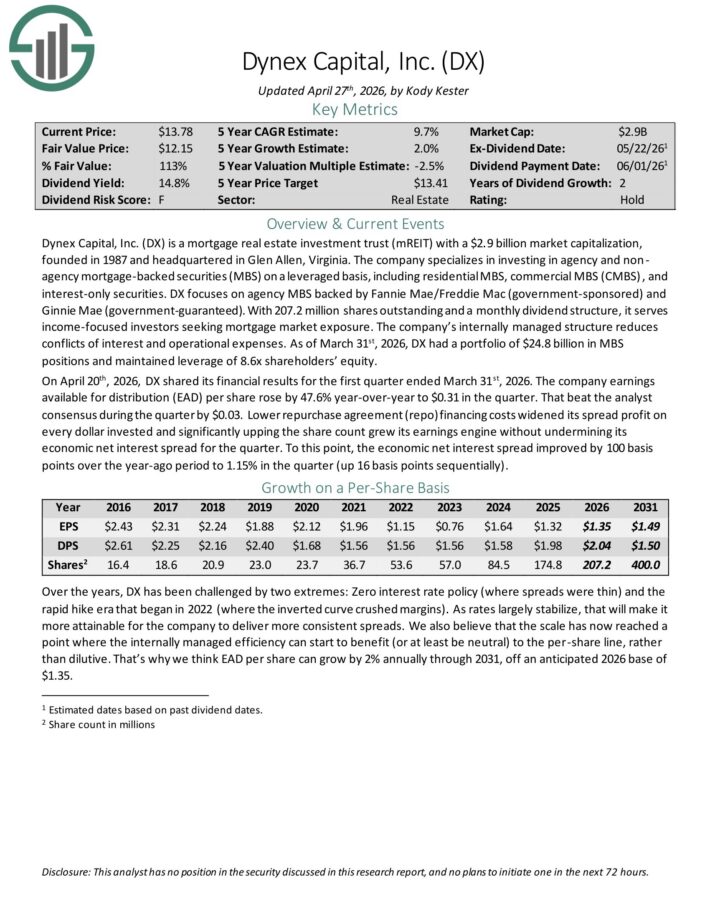
High-Yield Monthly Dividend Stock #11: Dynex Capital (DX)
- Dividend Yield: 15.4%
Dynex Capital invests in mortgage–backed securities (MBS) on a leveraged basis in the United States. It invests in agency and non–agency MBS consisting of residential MBS, commercial MBS (CMBS), and CMBS interest–only securities.
On April 20th, 2026, DX shared its financial results for the first quarter ended March 31st, 2026. The company earnings available for distribution (EAD) per share rose by 47.6% year-over-year to $0.31 in the quarter.
That beat the analyst consensus during the quarter by $0.03. Lower repurchase agreement (repo) financing costs widened its spread profit on every dollar invested and significantly upping the share count grew its earnings engine without undermining its economic net interest spread for the quarter.
To this point, the economic net interest spread improved by 100 basis points over the year-ago period to 1.15% in the quarter (up 16 basis points sequentially).
Click here to download our most recent Sure Analysis report on DX (preview of page 1 of 3 shown below):
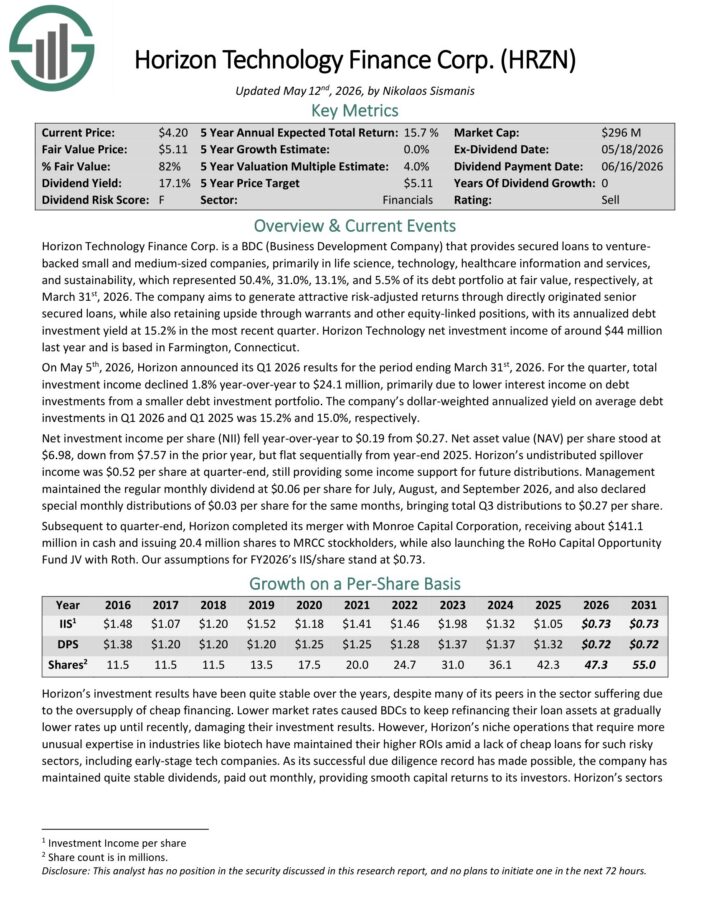
High-Yield Monthly Dividend Stock #10: Horizon Technology Finance (HRZN)
- Dividend Yield: 15.5%
Horizon Technology Finance Corp. is a BDC that provides venture capital to small and medium–sized companies in the technology, life sciences, and healthcare–IT sectors.
The company has generated attractive risk–adjusted returns through directly originated senior secured loans and additional capital appreciation through warrants.
Horizon Technology Finance Corp. is a BDC that provides venture capital to small and medium–sized companies in the technology, life sciences, and healthcare–IT sectors.
On May 5th, 2026, Horizon announced its Q1 2026 results for the period ending March 31st, 2026. For the quarter, total investment income declined 1.8% year-over-year to $24.1 million, primarily due to lower interest income on debt investments from a smaller debt investment portfolio.
The company’s dollar-weighted annualized yield on average debt investments in Q1 2026 and Q1 2025 was 15.2% and 15.0%, respectively.
Net investment income per share (NII) fell year-over-year to $0.19 from $0.27. Net asset value (NAV) per share stood at $6.98, down from $7.57 in the prior year, but flat sequentially from year-end 2025.
Horizon’s undistributed spillover income was $0.52 per share at quarter-end, still providing some income support for future distributions.
Click here to download our most recent Sure Analysis report on HRZN (preview of page 1 of 3 shown below):
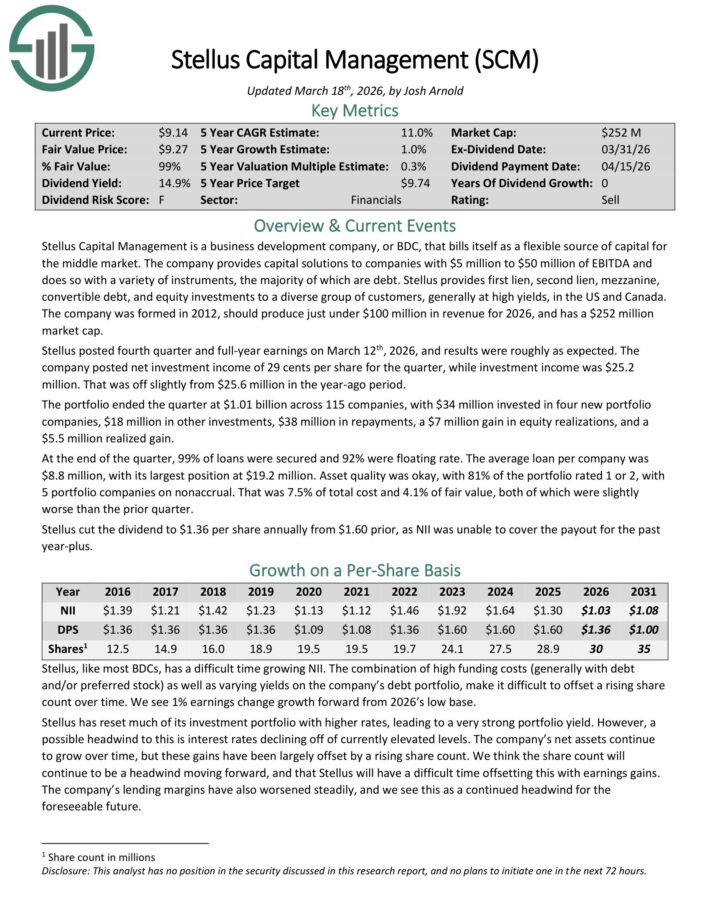
High-Yield Monthly Dividend Stock #9: Stellus Capital (SCM)
- Dividend Yield: 16.3%
Stellus Capital Management provides capital solutions to companies with $5 million to $50 million of EBITDA and does so with a variety of instruments, the majority of which are debt.
Stellus provides first lien, second lien, mezzanine, convertible debt, and equity investments to a diverse group of customers, generally at high yields, in the US and Canada.
Stellus posted fourth quarter and full-year earnings on March 12th, 2026. The company posted net investment income of 29 cents per share for the quarter, while investment income was $25.2 million. That was off slightly from $25.6 million in the year-ago period.
The portfolio ended the quarter at $1.01 billion across 115 companies, with $34 million invested in four new portfolio companies, $18 million in other investments, $38 million in repayments, a $7 million gain in equity realizations, and a $5.5 million realized gain.
At the end of the quarter, 99% of loans were secured and 92% were floating rate. The average loan per company was $8.8 million, with its largest position at $19.2 million.
Asset quality was okay, with 81% of the portfolio rated 1 or 2, with 5 portfolio companies on nonaccrual. That was 7.5% of total cost and 4.1% of fair value, both of which were slightly worse than the prior quarter.
Stellus cut the dividend to $1.36 per share annually from $1.60.
Click here to download our most recent Sure Analysis report on SCM (preview of page 1 of 3 shown below):
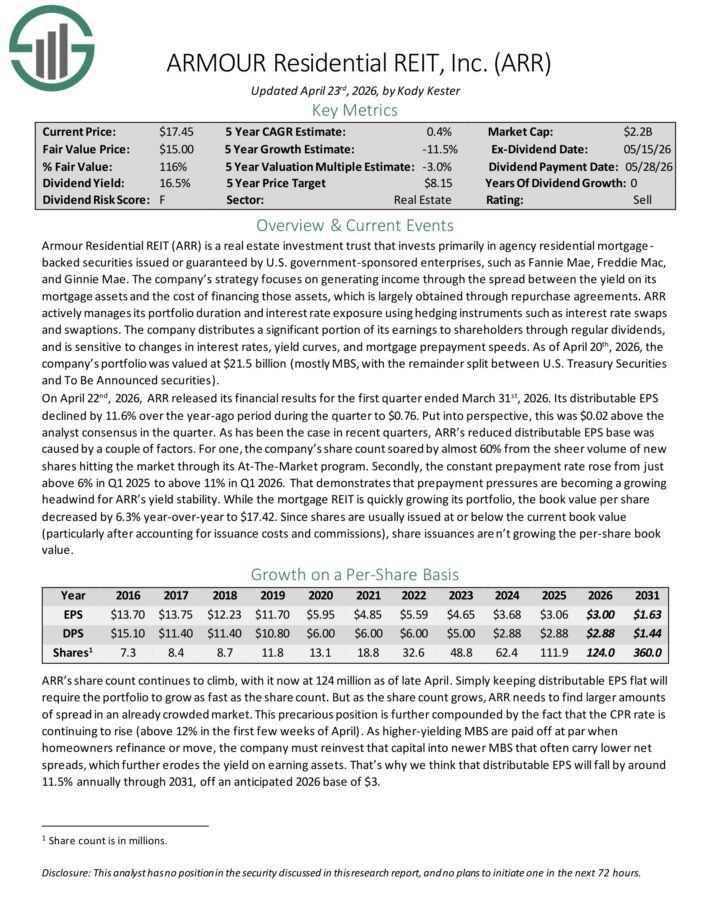
High-Yield Monthly Dividend Stock #8: ARMOUR Residential REIT (ARR)
- Dividend Yield: 16.7%
ARMOUR Residential invests in residential mortgage-backed securities that include U.S. Government-sponsored entities (GSE) such as Fannie Mae and Freddie Mac.
It also includes Ginnie Mae, the Government National Mortgage Administration’s issued or guaranteed securities backed by fixed-rate, hybrid adjustable-rate, and adjustable-rate home loans.
Unsecured notes and bonds issued by the GSE and the US Treasury, money market instruments, and non-GSE or government agency-backed securities are examples of other types of investments.
On April 22nd, 2026, ARR released its financial results for the first quarter ended March 31st, 2026. Its distributable EPS declined by 11.6% over the year-ago period during the quarter to $0.76. This was $0.02 above the analyst consensus in the quarter.
The reduced distributable EPS base was caused by a couple of factors. For one, the company’s share count soared by almost 60% from the sheer volume of new shares hitting the market through its At-The-Market program.
Secondly, the constant prepayment rate rose from just above 6% in Q1 2025 to above 11% in Q1 2026.
Book value per share decreased by 6.3% year-over-year to $17.42.
Click here to download our most recent Sure Analysis report on ARMOUR Residential REIT Inc (ARR) (preview of page 1 of 3 shown below):
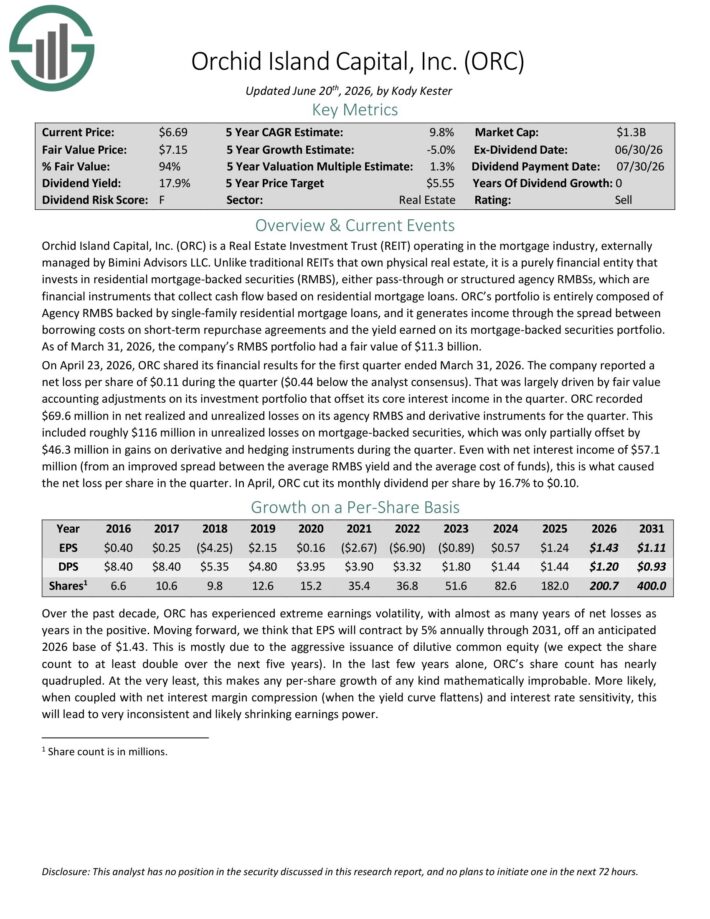
High-Yield Monthly Dividend Stock #7: Orchid Island Capital (ORC)
- Dividend Yield: 17.4%
Orchid Island Capital, Inc. is a Real Estate Investment Trust (REIT) operating in the mortgage industry, externally managed by Bimini Advisors LLC.
Orchid Island is a purely financial entity that invests in residential mortgage-backed securities (RMBS), either pass-through or structured agency RMBSs, which are financial instruments that collect cash flow based on residential mortgage loans.
Its portfolio is entirely composed of Agency RMBS backed by single-family residential mortgage loans.
On April 23, 2026, ORC shared its financial results for the first quarter ended March 31, 2026. The company reported a net loss per share of $0.11 during the quarter ($0.44 below the analyst consensus).
That was largely driven by fair value accounting adjustments on its investment portfolio that offset its core interest income in the quarter. ORC recorded $69.6 million in net realized and unrealized losses on its agency RMBS and derivative instruments for the quarter.
This included roughly $116 million in unrealized losses on mortgage-backed securities, which was only partially offset by $46.3 million in gains on derivative and hedging instruments during the quarter.
Even with net interest income of $57.1 million (from an improved spread between the average RMBS yield and the average cost of funds), this is what caused the net loss per share in the quarter.
In April, ORC cut its monthly dividend per share by 16.7% to $0.10.
Click here to download our most recent Sure Analysis report on ORC (preview of page 1 of 3 shown below):
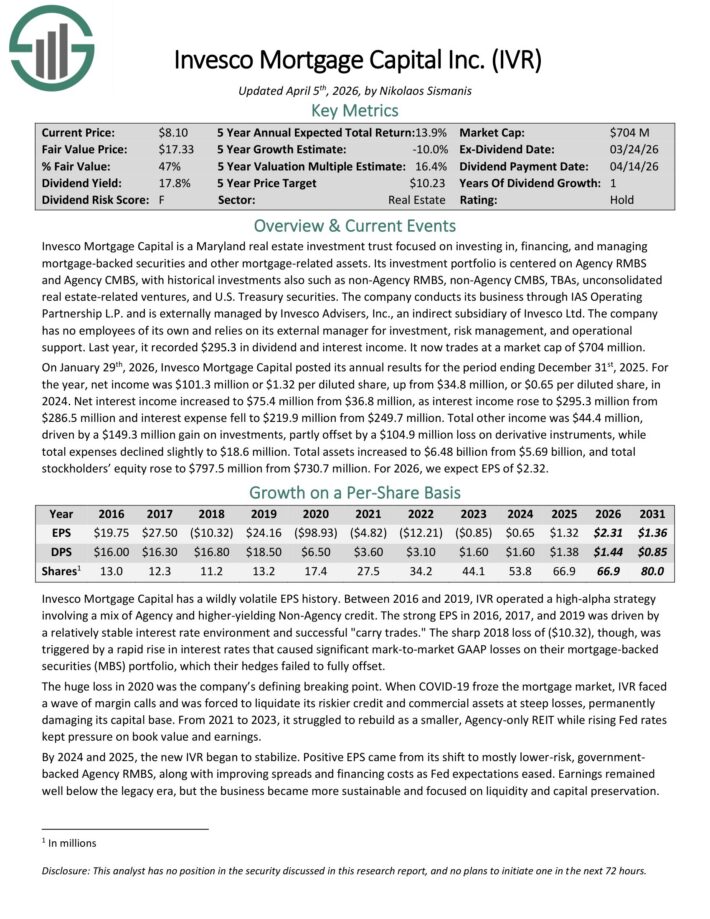
High-Yield Monthly Dividend Stock #6: Invesco Mortgage Capital (IVR)
- Dividend Yield: 18.2%
Invesco Mortgage Capital is a Maryland real estate investment trust focused on investing in, financing, and managing mortgage-backed securities and other mortgage-related assets.
Its investment portfolio is centered on Agency RMBS and Agency CMBS, with historical investments also such as non-Agency RMBS, non-Agency CMBS, TBAs, unconsolidated real estate-related ventures, and U.S. Treasury securities.
The company conducts its business through IAS Operating Partnership L.P. and is externally managed by Invesco Advisers, Inc., an indirect subsidiary of Invesco Ltd.
The company has no employees of its own and relies on its external manager for investment, risk management, and operational support. Last year, it recorded $295.3 in dividend and interest income.
On January 29th, 2026, Invesco Mortgage Capital posted its annual results for the period ending December 31st, 2025. For the year, net income was $101.3 million or $1.32 per diluted share, up from $34.8 million, or $0.65 per diluted share, in 2024.
Net interest income increased to $75.4 million from $36.8 million, as interest income rose to $295.3 million from $286.5 million and interest expense fell to $219.9 million from $249.7 million.
Total other income was $44.4 million, driven by a $149.3 million gain on investments, partly offset by a $104.9 million loss on derivative instruments, while total expenses declined slightly to $18.6 million.
Total assets increased to $6.48 billion from $5.69 billion, and total stockholders’ equity rose to $797.5 million from $730.7 million.
For 2026, we expect EPS of $2.32.
Click here to download our most recent Sure Analysis report on IVR (preview of page 1 of 3 shown below):
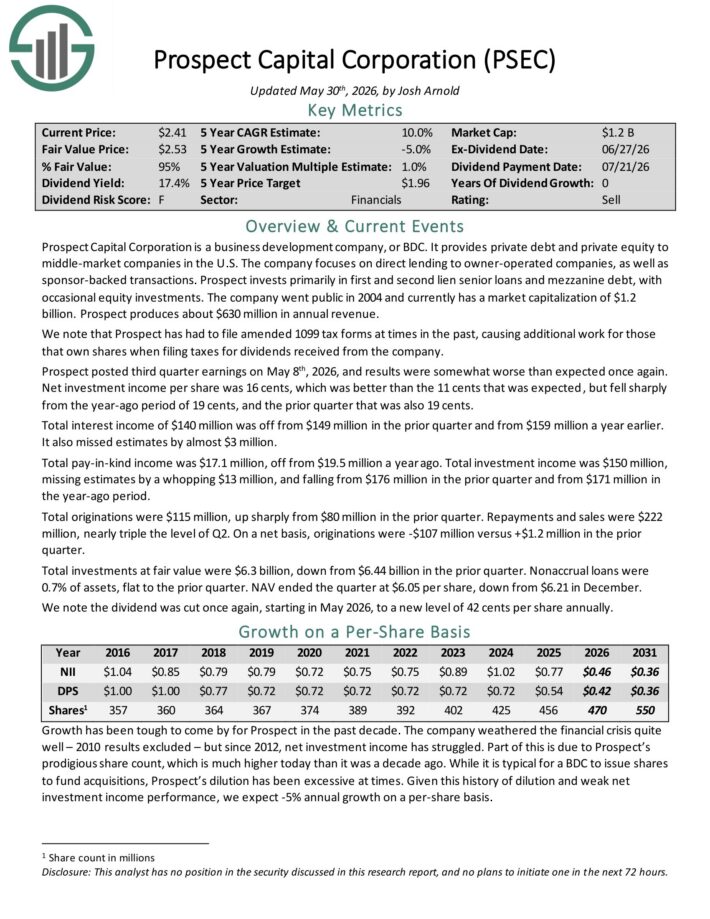
High-Yield Monthly Dividend Stock #5: Prospect Capital (PSEC)
- Dividend Yield: 19.1%
Prospect Capital Corporation is a Business Development Company, or BDC, that provides private debt and private equity to middle–market companies in the U.S.
The company focuses on direct lending to owner–operated companies, as well as sponsor–backed transactions. Prospect invests primarily in first and second lien senior loans and mezzanine debt, with occasional equity investments.
Prospect posted third quarter earnings on May 8th, 2026, and results were somewhat worse than expected once again. Net investment income per share was 16 cents, which was better than the 11 cents that was expected, but fell sharply from the year-ago period of 19 cents, and the prior quarter that was also 19 cents.
Total interest income of $140 million was off from $149 million in the prior quarter and from $159 million a year earlier. It also missed estimates by almost $3 million.
Total pay-in-kind income was $17.1 million, off from $19.5 million a year ago. Total investment income was $150 million, missing estimates by a whopping $13 million, and falling from $176 million in the prior quarter and from $171 million in the year-ago period.
Click here to download our most recent Sure Analysis report on PSEC (preview of page 1 of 3 shown below):
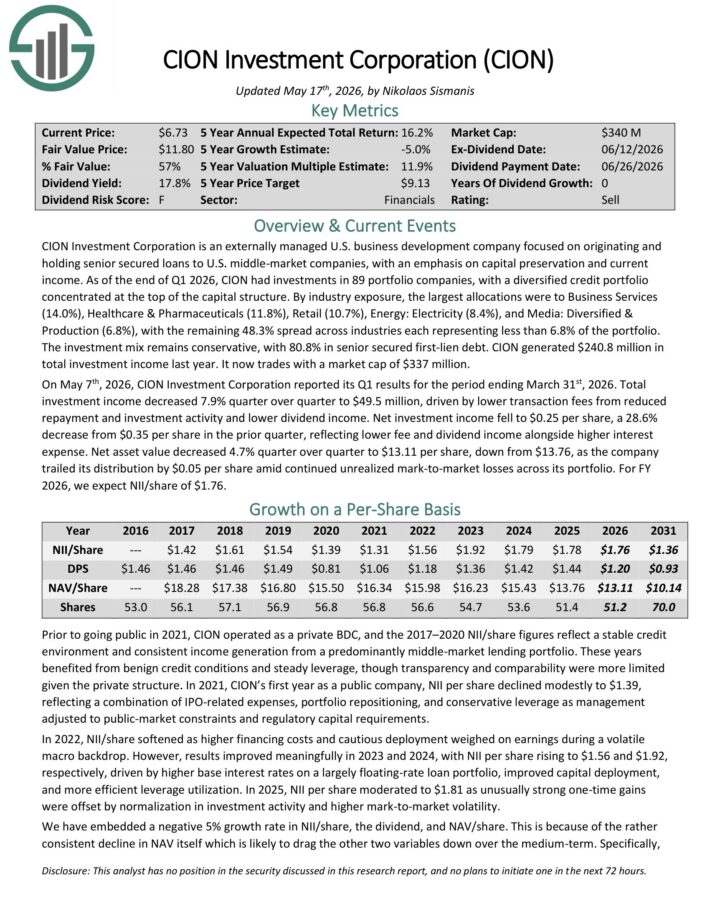
High-Yield Monthly Dividend Stock #4: CION Investment Corporation (CION)
- Dividend Yield: 19.2%
CION Investment Corporation is an externally managed U.S. business development company focused on originating and holding senior secured loans to U.S. middle-market companies, with an emphasis on capital preservation and current income.
As of the end of Q1 2026, CION had investments in 89 portfolio companies, with a diversified credit portfolio concentrated at the top of the capital structure.
By industry exposure, the largest allocations were to Business Services (14.0%), Healthcare & Pharmaceuticals (11.8%), Retail (10.7%), Energy: Electricity (8.4%), and Media: Diversified & Production (6.8%).
The remaining 48.3% is spread across industries each representing less than 6.8% of the portfolio. The investment mix remains conservative, with 80.8% in senior secured first-lien debt.
On May 7th, 2026, CION Investment Corporation reported its Q1 results. Total investment income decreased 7.9% quarter over quarter to $49.5 million, driven by lower transaction fees from reduced repayment and investment activity and lower dividend income.
Net investment income fell to $0.25 per share, a 28.6% decrease from $0.35 per share in the prior quarter, reflecting lower fee and dividend income alongside higher interest expense. Net asset value decreased 4.7% quarter over quarter to $13.11 per share, down from $13.76.
Click here to download our most recent Sure Analysis report on CION (preview of page 1 of 3 shown below):
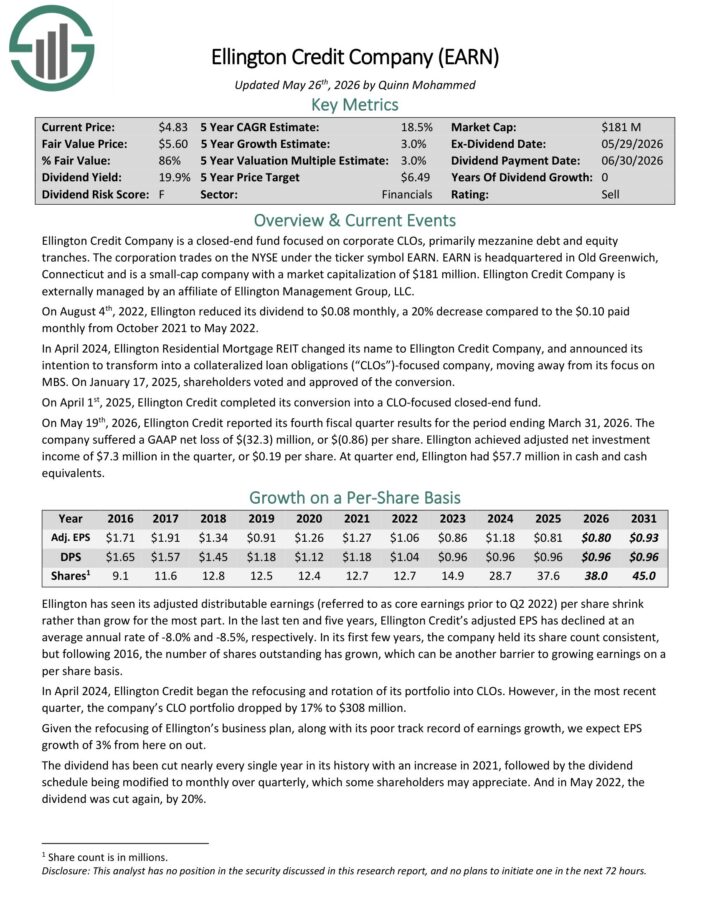
High-Yield Monthly Dividend Stock #3: Ellington Credit Co. (EARN)
- Dividend Yield: 21.9%
Ellington Credit Co. acquires, invests in, and manages residential mortgage and real estate related assets.
Ellington focuses primarily on residential mortgage-backed securities, specifically those backed by a U.S. Government agency or U.S. government–sponsored enterprise.
Agency MBS are created and backed by government agencies or enterprises, while non-agency MBS are not guaranteed by the government.
On May 19th, 2026, Ellington Credit reported its fourth fiscal quarter results for the period ending March 31, 2026. The company suffered a GAAP net loss of $(32.3) million, or $(0.86) per share.
Ellington achieved adjusted net investment income of $7.3 million in the quarter, or $0.19 per share. At quarter end, Ellington had $57.7 million in cash and cash equivalents.
Click here to download our most recent Sure Analysis report on EARN (preview of page 1 of 3 shown below):
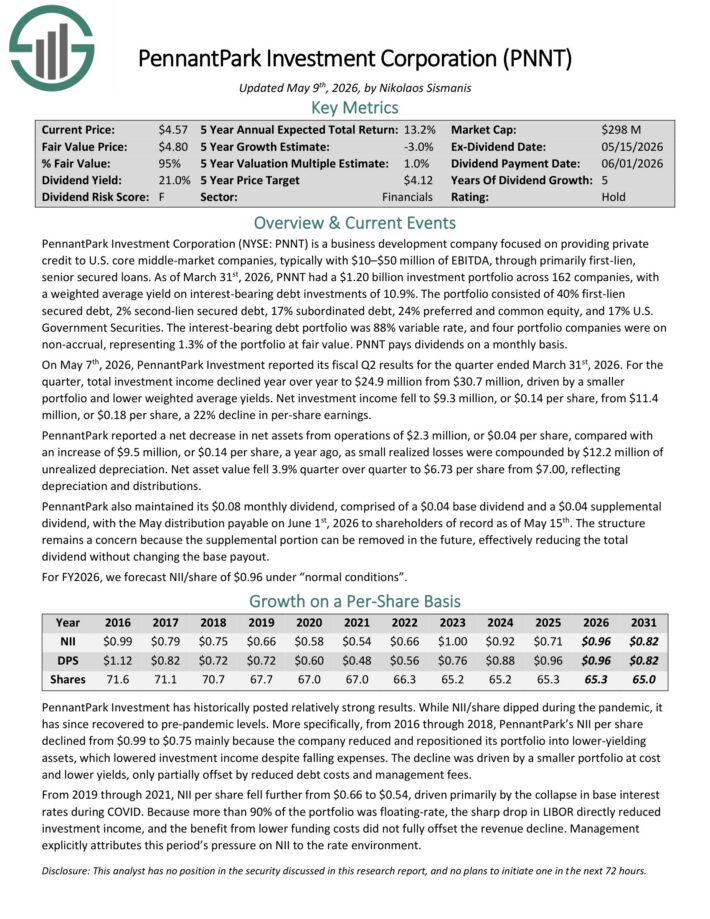
High-Yield Monthly Dividend Stock #2: PennantPark Investment Corporation (PNNT)
- Dividend Yield: 28.0%
PennantPark Investment Corporation is a business development company focused on providing private credit to U.S. core middle-market companies, typically with $10–$50 million of EBITDA, through primarily first-lien, senior secured loans.
As of March 31st, 2026, PNNT had a $1.20 billion investment portfolio across 162 companies, with a weighted average yield on interest-bearing debt investments of 10.9%.
The portfolio consisted of 40% first-lien secured debt, 2% second-lien secured debt, 17% subordinated debt, 24% preferred and common equity, and 17% U.S. Government Securities.
The interest-bearing debt portfolio was 88% variable rate, and four portfolio companies were on non-accrual, representing 1.3% of the portfolio at fair value.
On May 7th, 2026, PennantPark Investment reported its fiscal Q2 results. For the quarter, total investment income declined year over year to $24.9 million from $30.7 million, driven by a smaller portfolio and lower weighted average yields.
Net investment income fell to $9.3 million, or $0.14 per share, from $11.4 million, or $0.18 per share, a 22% decline in per-share earnings.
PennantPark reported a net decrease in net assets from operations of $2.3 million, or $0.04 per share, compared with an increase of $9.5 million, or $0.14 per share, a year ago.
Click here to download our most recent Sure Analysis report on PNNT (preview of page 1 of 3 shown below):
High-Yield Monthly Dividend Stock #1: Oxford Square Capital (OXSQ)
- Dividend Yield: 29.8%
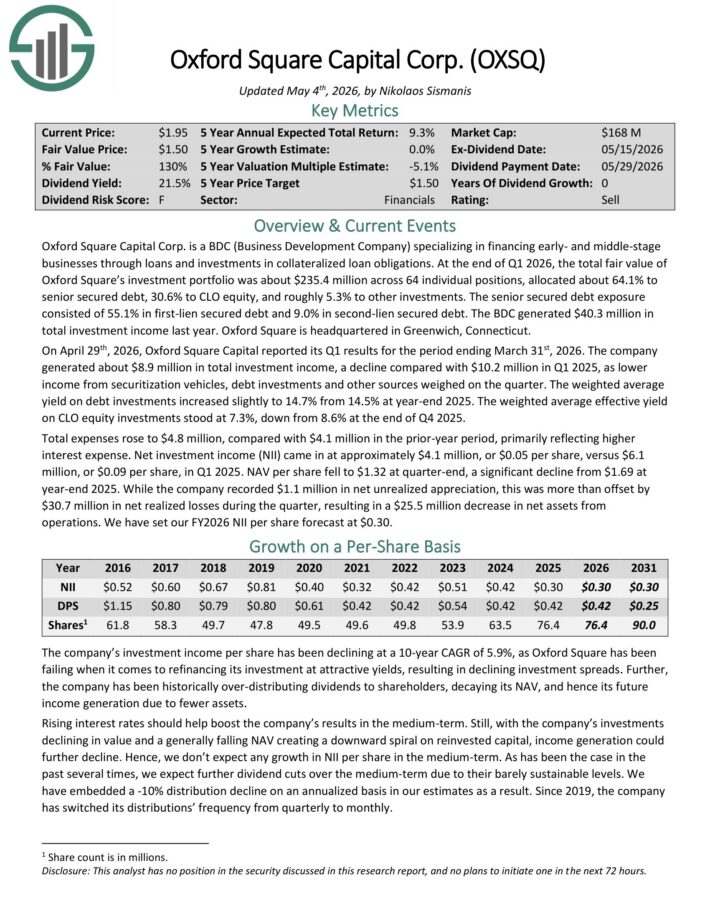
Oxford Square Capital Corp. is a BDC (Business Development Company) specializing in financing early- and middle-stage businesses through loans and investments in collateralized loan obligations.
At the end of 2025, the total fair value of Oxford Square’s investment portfolio was about $251.7 million across its debt, CLO equity, and equity/other holdings, allocated about 58.5% to senior secured debt, 37.8% to CLO equity, and roughly 3.7% to equity or other investments.
On April 29th, 2026, Oxford Square Capital reported its Q1 results for the period ending March 31st, 2026. The company generated about $8.9 million in total investment income, a decline compared with $10.2 million in Q1 2025, as lower income from securitization vehicles, debt investments and other sources weighed on the quarter.
The weighted average yield on debt investments increased slightly to 14.7% from 14.5% at year-end 2025. The weighted average effective yield on CLO equity investments stood at 7.3%, down from 8.6% at the end of Q4 2025.
Total expenses rose to $4.8 million, compared with $4.1 million in the prior-year period, primarily reflecting higher interest expense. Net investment income (NII) came in at approximately $4.1 million, or $0.05 per share, versus $6.1 million, or $0.09 per share, in Q1 2025.
Click here to download our most recent Sure Analysis report on OXSQ (preview of page 1 of 3 shown below):
Final Thoughts
Monthly dividend stocks could be more appealing to income investors than quarterly or semi-annual dividend stocks. This is because monthly dividend stocks make 12 dividend payments per year, instead of the usual 4 or 2.
Furthermore, monthly dividend stocks with high yields above 5% are even more attractive for income investors.
The 20 stocks on this list have not been vetted for dividend safety, meaning each investor should understand the unique risk factors of each company.
That said, these 20 dividend stocks make monthly payments to shareholders, and all have high dividend yields.
Further Reading
If you are interested in finding high-quality dividend growth stocks and/or other high-yield securities and income securities, the following Sure Dividend resources will be useful:
Monthly Dividend Stock Individual Security Research
Other Sure Dividend Resources
- Dividend Kings: 50+ years of rising dividends
- Dividend Champions: 25+ years of rising dividends
- Dividend Aristocrats: 25+ years of rising dividends and in the S&P 500