Published on February 2nd, 2026 by Bob Ciura
Monthly dividend stocks are securities that pay a dividend every month instead of quarterly or annually.
Monthly dividend stocks have instant appeal for many income investors. Stocks that pay their dividends each month offer more frequent payouts than traditional quarterly or semi-annual dividend payers.
For this reason, we created a full list of over 100 monthly dividend stocks.
You can download our full Excel spreadsheet of all monthly dividend stocks (along with metrics that matter like dividend yield and payout ratio) by clicking on the link below:

Much of the monthly dividend stocks list is comprised of Real Estate Investment Trusts, or REITs.
However, there are plenty of monthly dividend stocks that are not REITs. Other types of securities include common stocks, Business Development Companies, or Master Limited Partnerships.
Therefore, this article will discuss the top 10 non-REIT monthly dividend stocks in the Sure Analysis Research Database.
Table Of Contents
The best non-REIT monthly dividend stocks are ranked below, according to their expected annual returns over the next five years.
You can instantly jump to an individual section of the article by utilizing the links below:
- Non-REIT Monthly Dividend Stock #10: Trinity Capital (TRIN)
- Non-REIT Monthly Dividend Stock #9: Capital Southwest Corp. (CSWC)
- Non-REIT Monthly Dividend Stock #8: Itau Unibanco (ITUB)
- Non-REIT Monthly Dividend Stock #7: Dynacor Group (DNGDF)
- Non-REIT Monthly Dividend Stock #6: Ellington Financial (EFC)
- Non-REIT Monthly Dividend Stock #5: Oxford Square Capital (OXSQ)
- Non-REIT Monthly Dividend Stock #4: PennantPark Floating Rate Capital (PFLT)
- Non-REIT Monthly Dividend Stock #3: Saratoga Investment Corp. (SAR)
- Non-REIT Monthly Dividend Stock #2: Horizon Technology Finance Corp. (HRZN)
- Non-REIT Monthly Dividend Stock #1: PennantPark Investment Corporation (PNNT)
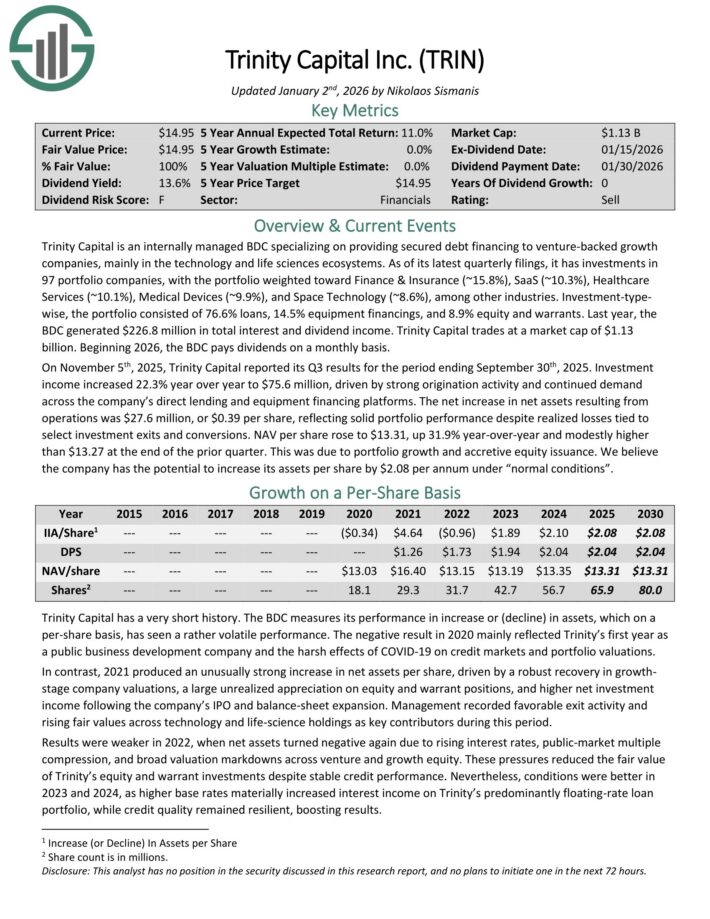
Non-REIT Monthly Dividend Stock #10: Trinity Capital (TRIN)
- Expected Annual Return: 8.5%
Trinity Capital is an internally managed BDC specializing on providing secured debt financing to venture-backed growth companies, mainly in the technology and life sciences ecosystems.
As of its latest quarterly filings, it has investments in 97 portfolio companies, with the portfolio weighted toward Finance & Insurance (~15.8%), SaaS (~10.3%), Healthcare Services (~10.1%), Medical Devices (~9.9%), and Space Technology (~8.6%), among other industries.
The portfolio consisted of 76.6% loans, 14.5% equipment financings, and 8.9% equity and warrants. Last year, the BDC generated $226.8 million in total interest and dividend income.
On November 5th, 2025, Trinity Capital reported its Q3 results for the period ending September 30th, 2025. Investment income increased 22.3% year over year to $75.6 million, driven by strong origination activity and continued demand across the company’s direct lending and equipment financing platforms.
The net increase in net assets resulting from operations was $27.6 million, or $0.39 per share, reflecting solid portfolio performance despite realized losses tied to select investment exits and conversions.
NAV per share rose to $13.31, up 31.9% year-over-year and modestly higher than $13.27 at the end of the prior quarter. This was due to portfolio growth and accretive equity issuance.
Click here to download our most recent Sure Analysis report on TRIN (preview of page 1 of 3 shown below):
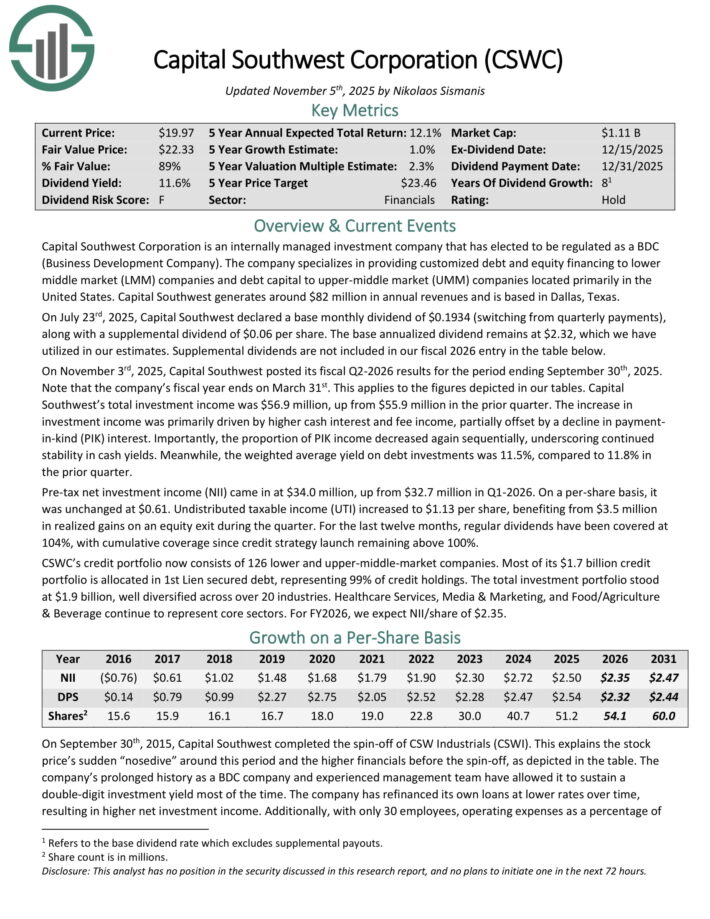
Non-REIT Monthly Dividend Stock #9: Capital Southwest Corp. (CSWC)
- Expected Annual Return: 8.6%
Capital Southwest Corporation is an internally managed investment company that has elected to be regulated as a BDC.
The company specializes in providing customized debt and equity financing to lower middle market (LMM) companies and debt capital to upper-middle market (UMM) companies located primarily in the United States. Capital Southwest generates around $82 million in annual revenue.
On November 3rd, 2025, Capital Southwest posted its fiscal Q2-2026 results for the period ending September 30th, 2025. Total investment income was $56.9 million, up from $55.9 million in the prior quarter.
The increase in investment income was primarily driven by higher cash interest and fee income, partially offset by a decline in payment-in-kind (PIK) interest.
The proportion of PIK income decreased again sequentially, underscoring continued stability in cash yields. Meanwhile, the weighted average yield on debt investments was 11.5%, compared to 11.8% in the prior quarter.
Pre-tax net investment income (NII) came in at $34.0 million, up from $32.7 million in Q1-2026. On a per-share basis, it was unchanged at $0.61. Undistributed taxable income (UTI) increased to $1.13 per share, benefiting from $3.5 million in realized gains on an equity exit during the quarter.
Click here to download our most recent Sure Analysis report on CSWC (preview of page 1 of 3 shown below):
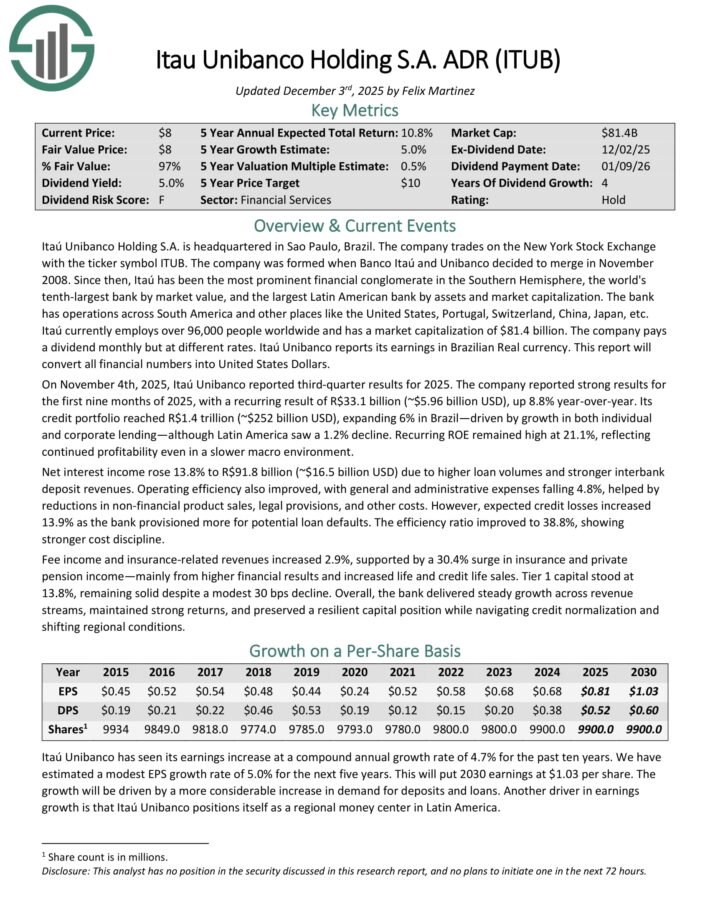
Non-REIT Monthly Dividend Stock #8: Itau Unibanco (ITUB)
- Expected Annual Return: 8.6%
Itaú Unibanco Holding S.A. is headquartered in Sao Paulo, Brazil. It is the world’s tenth-largest bank by market value, and the largest Latin American bank by assets and market capitalization.
The bank has operations across South America and other places like the United States, Portugal, Switzerland, China, Japan, etc.
Itaú currently employs over 96,000 people worldwide and has a market capitalization of $81.4 billion.
On November 4th, 2025, Itaú Unibanco reported third-quarter results for 2025. The company reported strong results for the first nine months of 2025, with a recurring result of R$33.1 billion (~$5.96 billion USD), up 8.8% year-over-year.
Its credit portfolio reached R$1.4 trillion (~$252 billion USD), expanding 6% in Brazil—driven by growth in both individual and corporate lending—although Latin America saw a 1.2% decline.
Recurring ROE remained high at 21.1%, reflecting continued profitability even in a slower macro environment.
Net interest income rose 13.8% to R$91.8 billion (~$16.5 billion USD) due to higher loan volumes and stronger interbank deposit revenues.
Operating efficiency also improved, with general and administrative expenses falling 4.8%, helped by reductions in non-financial product sales, legal provisions, and other costs.
Click here to download our most recent Sure Analysis report on ITUB (preview of page 1 of 3 shown below):
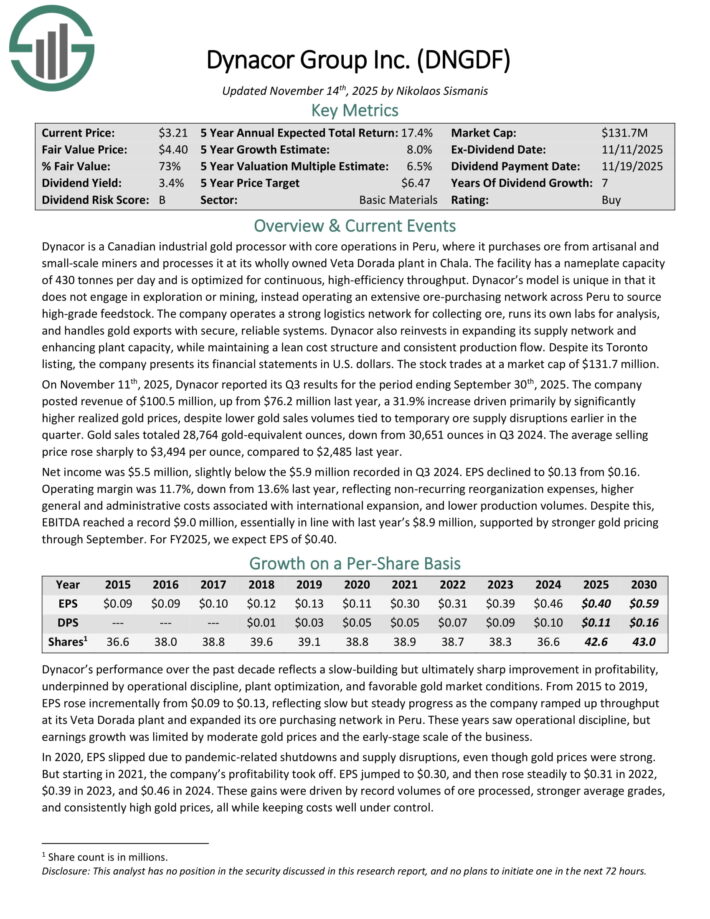
Non-REIT Monthly Dividend Stock #7: Dynacor Group (DNGDF)
- Expected Annual Return: 9.8%
Dynacor is a Canadian industrial gold processor with core operations in Peru, where it purchases ore from artisanal and small-scale miners and processes it at its wholly owned Veta Dorada plant in Chala.
The facility has a nameplate capacity of 430 tonnes per day and is optimized for continuous, high-efficiency throughput.
Dynacor’s model is unique in that it does not engage in exploration or mining, instead operating an extensive ore purchasing network across Peru to source high-grade feedstock.
The company operates a strong logistics network for collecting ore, runs its own labs for analysis, and handles gold exports with secure, reliable systems.
Dynacor also reinvests in expanding its supply network and enhancing plant capacity, while maintaining a lean cost structure and consistent production flow.
On November 11th, 2025, Dynacor reported its Q3 results. The company posted revenue of $100.5 million, up from $76.2 million last year, a 31.9% increase driven primarily by significantly higher realized gold prices, despite lower gold sales volumes tied to temporary ore supply disruptions earlier in the quarter.
Gold sales totaled 28,764 gold-equivalent ounces, down from 30,651 ounces in Q3 2024. The average selling price rose sharply to $3,494 per ounce, compared to $2,485 last year.
Net income was $5.5 million, slightly below the $5.9 million recorded in Q3 2024. EPS declined to $0.13 from $0.16. Operating margin was 11.7%, down from 13.6% last year, reflecting non-recurring reorganization expenses, higher general and administrative costs associated with international expansion, and lower production volumes.
Click here to download our most recent Sure Analysis report on DNGDF (preview of page 1 of 3 shown below):
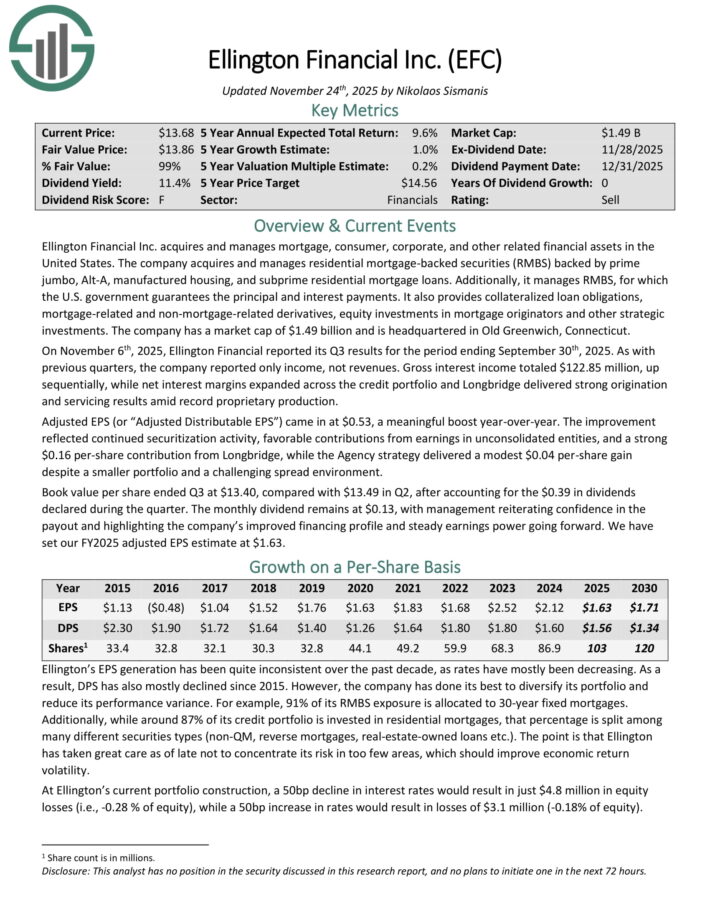
Non-REIT Monthly Dividend Stock #6: Ellington Financial (EFC)
- Expected Annual Return: 10.9%
Ellington Financial Inc. acquires and manages mortgage, consumer, corporate, and other related financial assets in the United States.
The company acquires and manages residential mortgage–backed securities (RMBS) backed by prime jumbo, Alt–A, manufactured housing, and subprime residential mortgage loans.
Additionally, it manages RMBS, for which the U.S. government guarantees the principal and interest payments. It also provides collateralized loan obligations, mortgage–related and non–mortgage–related derivatives, equity investments in mortgage originators and other strategic investments.
On November 6th, 2025, Ellington Financial reported its Q3 results. As with previous quarters, the company reported only income, not revenues.
Gross interest income totaled $122.85 million, up sequentially, while net interest margins expanded across the credit portfolio and Longbridge delivered strong origination and servicing results amid record proprietary production. Adjusted EPS came in at $0.53, a meaningful boost year-over-year.
The improvement reflected continued securitization activity, favorable contributions from earnings in unconsolidated entities, and a strong $0.16 per-share contribution from Longbridge, while the Agency strategy delivered a modest $0.04 per-share gain despite a smaller portfolio and a challenging spread environment.
Book value per share ended Q3 at $13.40, compared with $13.49 in Q2.
Click here to download our most recent Sure Analysis report on Ellington Financial (EFC) (preview of page 1 of 3 shown below):
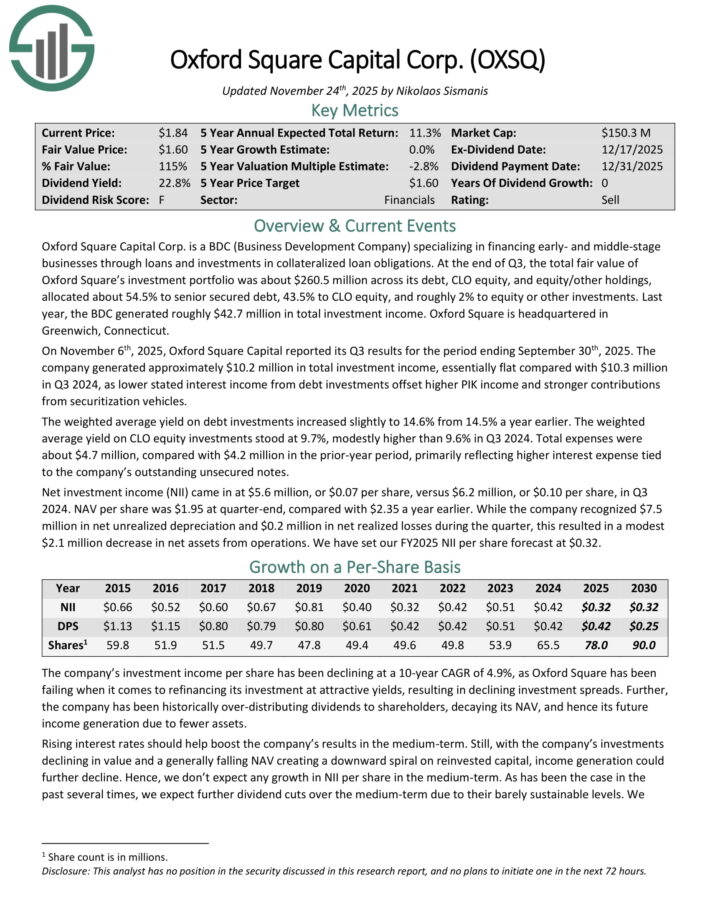
Non-REIT Monthly Dividend Stock #5: Oxford Square Capital (OXSQ)
- Expected Annual Return: 11.0%
Oxford Square Capital Corp. is a BDC (Business Development Company) specializing in financing early- and middle-stage businesses through loans and investments in collateralized loan obligations.
At the end of Q3, the total fair value of Oxford Square’s investment portfolio was about $260.5 million across its debt, CLO equity, and equity/other holdings, allocated about 54.5% to senior secured debt, 43.5% to CLO equity, and roughly 2% to equity or other investments. Last year, the BDC generated roughly $42.7 million in total investment income.
On November 6th, 2025, Oxford Square Capital reported its Q3. The company generated approximately $10.2 million in total investment income, essentially flat compared with $10.3 million in Q3 2024, as lower stated interest income from debt investments offset higher PIK income and stronger contributions from securitization vehicles.
The weighted average yield on debt investments increased slightly to 14.6% from 14.5% a year earlier. The weighted average yield on CLO equity investments stood at 9.7%, modestly higher than 9.6% in Q3 2024.
Total expenses were about $4.7 million, compared with $4.2 million in the prior-year period, primarily reflecting higher interest expense tied to the company’s outstanding unsecured notes.
Net investment income (NII) came in at $5.6 million, or $0.07 per share, versus $6.2 million, or $0.10 per share, in Q3 2024.
Click here to download our most recent Sure Analysis report on OXSQ (preview of page 1 of 3 shown below):
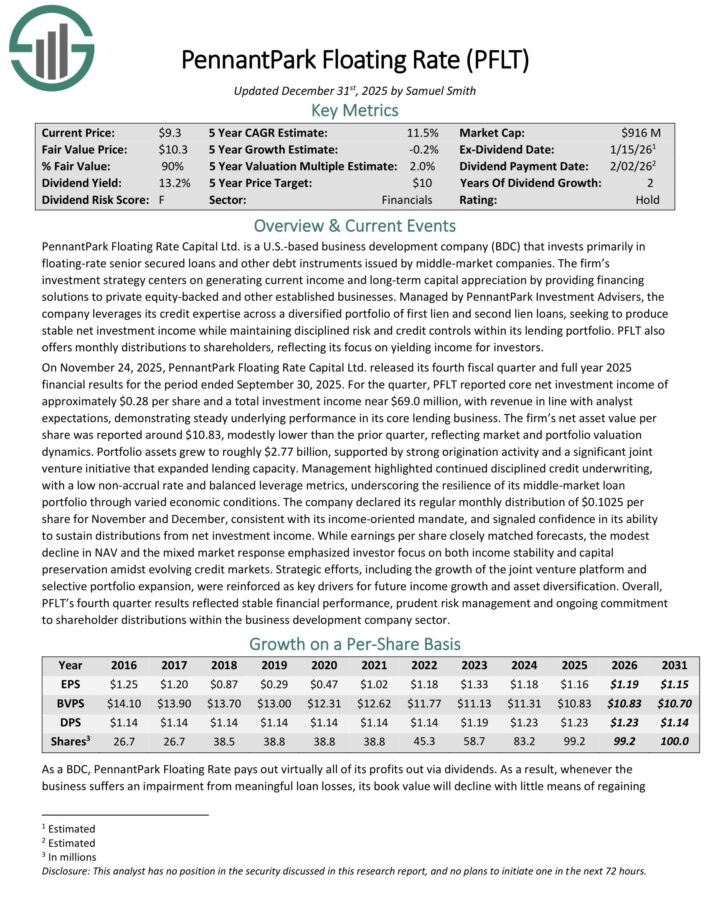
Non-REIT Monthly Dividend Stock #4: PennantPark Floating Rate Capital (PFLT)
- Expected Annual Return: 11.3%
PennantPark Floating Rate Capital Ltd. is a business development company that seeks to make secondary direct, debt, equity, and loan investments.
The fund also aims to invest through floating rate loans in private or thinly traded or small market-cap, public middle market companies, equity securities, preferred stock, common stock, warrants or options received in connection with debt investments or through direct investments.
On November 24, 2025, PennantPark Floating Rate Capital Ltd. released its fourth fiscal quarter and full year 2025 financial results for the period ended September 30, 2025.
For the quarter, PFLT reported core net investment income of approximately $0.28 per share and a total investment income near $69.0 million, with revenue in line with analyst expectations, demonstrating steady underlying performance in its core lending business.
The firm’s net asset value per share was reported around $10.83, modestly lower than the prior quarter, reflecting market and portfolio valuation dynamics.
Portfolio assets grew to roughly $2.77 billion, supported by strong origination activity and a significant joint venture initiative that expanded lending capacity.
Click here to download our most recent Sure Analysis report on PFLT (preview of page 1 of 3 shown below):
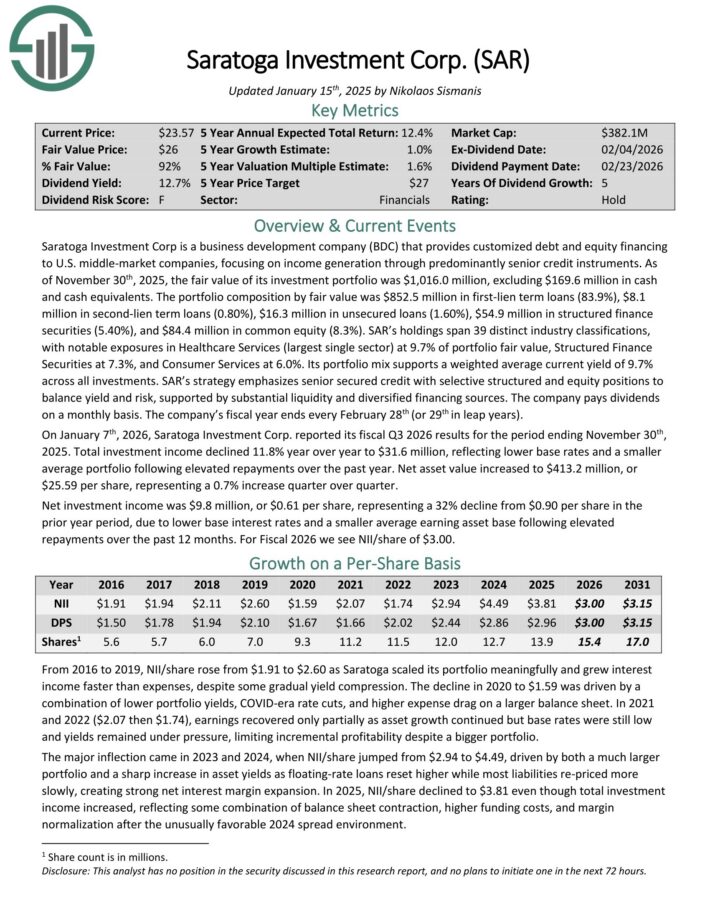
Non-REIT Monthly Dividend Stock #3: Saratoga Investment Corp. (SAR)
- Expected Annual Return: 12.7%
Saratoga Investment Corp is a business development company (BDC) that provides customized debt and equity financing to U.S. middle-market companies, focusing on income generation through predominantly senior credit instruments.
As of November 30th, 2025, the fair value of its investment portfolio was $1,016.0 million, excluding $169.6 million in cash and cash equivalents.
The portfolio composition by fair value was $852.5 million in first-lien term loans (83.9%), $8.1 million in second-lien term loans (0.80%), $16.3 million in unsecured loans (1.60%), $54.9 million in structured finance securities (5.40%), and $84.4 million in common equity (8.3%).
SAR’s holdings span 39 distinct industry classifications, with notable exposures in Healthcare Services (largest single sector) at 9.7% of portfolio fair value, Structured Finance Securities at 7.3%, and Consumer Services at 6.0%.
On January 7th, 2026, Saratoga Investment Corp. reported its fiscal Q3 2026 results for the period ending November 30th, 2025. Total investment income declined 11.8% year over year to $31.6 million, reflecting lower base rates and a smaller average portfolio following elevated repayments over the past year.
Net asset value increased to $413.2 million, or $25.59 per share, representing a 0.7% increase quarter over quarter. Net investment income was $9.8 million, or $0.61 per share, representing a 32% decline from $0.90 per share in the prior year period, due to lower base interest rates and a smaller average earning asset base following elevated repayments over the past 12 months.
Click here to download our most recent Sure Analysis report on SAR (preview of page 1 of 3 shown below):
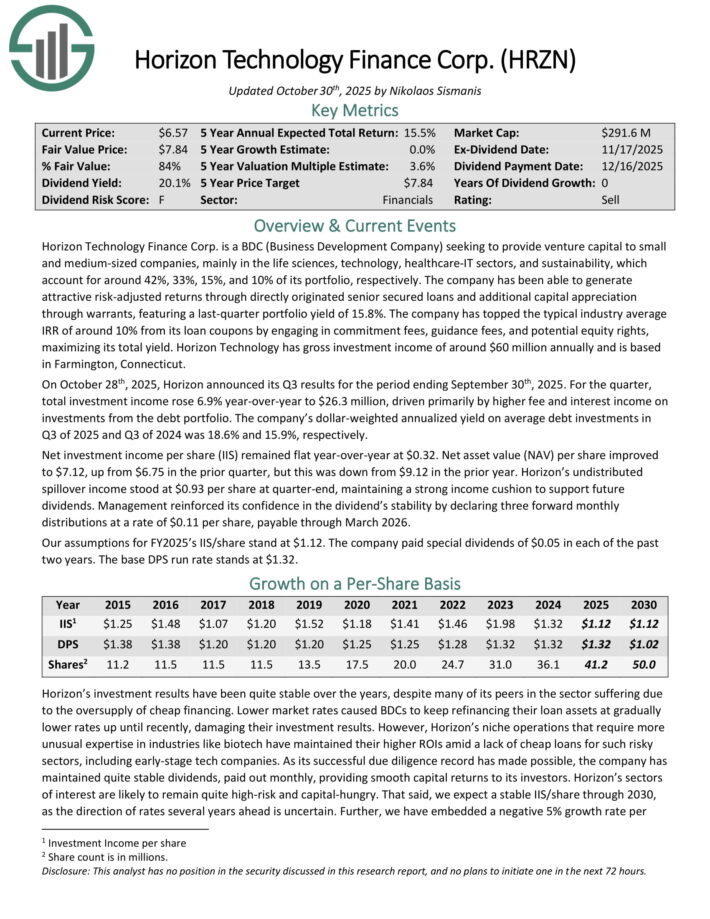
Non-REIT Monthly Dividend Stock #2: Horizon Technology Finance Corp. (HRZN)
- Expected Annual Return: 15.1%
Horizon Technology Finance Corp. is a BDC that provides venture capital to small and medium–sized companies in the technology, life sciences, and healthcare–IT sectors.
The company has generated attractive risk–adjusted returns through directly originated senior secured loans and additional capital appreciation through warrants.
Horizon Technology Finance Corp. is a BDC that provides venture capital to small and medium–sized companies in the technology, life sciences, and healthcare–IT sectors.
On October 28th, 2025, Horizon announced its Q3 results. For the quarter, total investment income rose 6.9% year-over-year to $26.3 million, driven primarily by higher fee and interest income on investments from the debt portfolio.
The company’s dollar-weighted annualized yield on average debt investments in Q3 of 2025 and Q3 of 2024 was 18.6% and 15.9%, respectively.
Net investment income per share (IIS) remained flat year-over-year at $0.32. Net asset value (NAV) per share improved to $7.12, up from $6.75 in the prior quarter, but this was down from $9.12 in the prior year.
Horizon’s undistributed spillover income stood at $0.93 per share at quarter-end, maintaining a strong income cushion to support future dividends.
Click here to download our most recent Sure Analysis report on HRZN (preview of page 1 of 3 shown below):
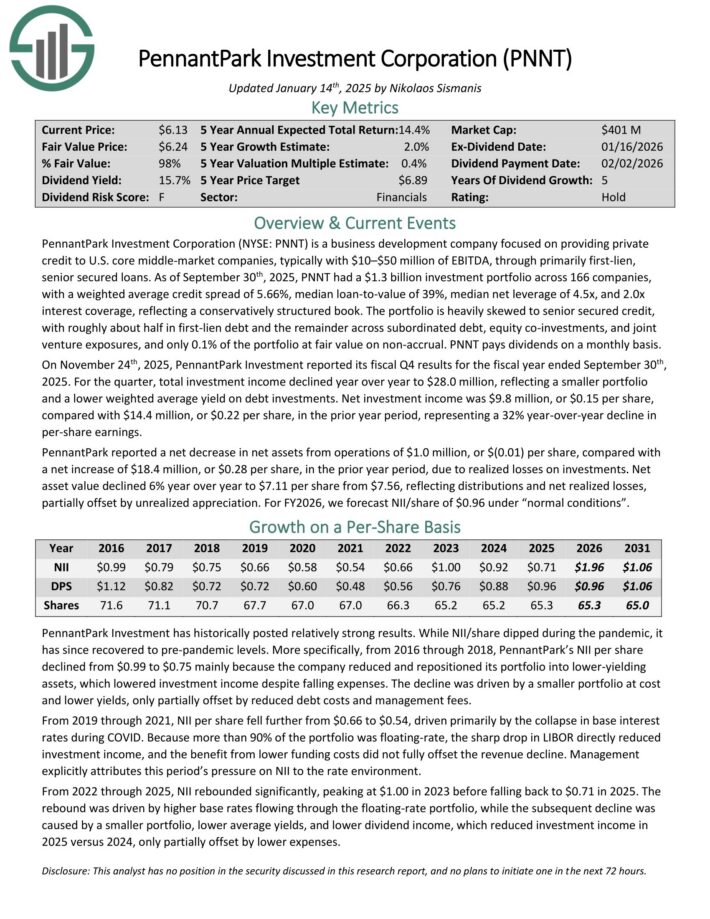
Non-REIT Monthly Dividend Stock #1: PennantPark Investment Corporation (PNNT)
- Expected Annual Return: 15.5%
PennantPark Investment Corporation is a business development company focused on providing private credit to U.S. core middle-market companies, typically with $10–$50 million of EBITDA, through primarily first-lien, senior secured loans.
As of September 30th, 2025, PNNT had a $1.3 billion investment portfolio across 166 companies, with a weighted average credit spread of 5.66%, median loan-to-value of 39%, median net leverage of 4.5x, and 2.0x interest coverage, reflecting a conservatively structured book.
The portfolio is heavily skewed to senior secured credit, with roughly about half in first-lien debt and the remainder across subordinated debt, equity co-investments, and joint venture exposures, and only 0.1% of the portfolio at fair value on non-accrual. PNNT pays dividends on a monthly basis.
On November 24th, 2025, PennantPark Investment reported its fiscal Q4 results for the fiscal year ended September 30th, 2025. For the quarter, total investment income declined year over year to $28.0 million, reflecting a smaller portfolio and a lower weighted average yield on debt investments.
Net investment income was $9.8 million, or $0.15 per share, compared with $14.4 million, or $0.22 per share, in the prior year period, representing a 32% year-over-year decline in per-share earnings.
PennantPark reported a net decrease in net assets from operations of $1.0 million, or $(0.01) per share, compared with a net increase of $18.4 million, or $0.28 per share, in the prior year period, due to realized losses on investments.
Net asset value declined 6% year over year to $7.11 per share from $7.56, reflecting distributions and net realized losses, partially offset by unrealized appreciation.
Click here to download our most recent Sure Analysis report on PNNT (preview of page 1 of 3 shown below):
Further Reading
If you are interested in finding high-quality dividend growth stocks and/or other high-yield securities and income securities, the following Sure Dividend resources will be useful:
Monthly Dividend Stock Individual Security Research
Other Sure Dividend Resources
- Dividend Kings: 50+ years of rising dividends
- Dividend Champions: 25+ years of rising dividends
- Dividend Aristocrats: 25+ years of rising dividends and in the S&P 500