Published on June 2nd, 2026 by Bob Ciura
Monthly dividend stocks are securities that pay a dividend every month instead of quarterly or annually.
Monthly dividend stocks have instant appeal for many income investors. Stocks that pay their dividends each month offer more frequent payouts than traditional quarterly or semi-annual dividend payers.
For this reason, we created a full list of over 100 monthly dividend stocks.
You can download our full Excel spreadsheet of all monthly dividend stocks (along with metrics that matter like dividend yield and payout ratio) by clicking on the link below:

In this research report, we discuss the prospects of 10 undervalued monthly dividend stocks, which are currently trading at P/E ratios under 10.
International stocks were excluded from this report.
We have ranked the stocks by P/E ratio, from lowest to highest. For REITs, we use P/FFO in place of the P/E ratio. And for MLPs, we use P/DCF (which is distributable cash flows).
These are comparable metrics similar to earnings for common stocks.
These 10 dividend stocks have not been screened for dividend safety. Instead, these are the 10 most undervalued monthly dividend stocks in the Sure Analysis Research Database.
Table Of Contents
You can instantly jump to an individual section of the article by utilizing the links below:
- Undervalued Monthly Dividend Stock #10: Prospect Capital (PSEC)
- Undervalued Monthly Dividend Stock #9: Orchid Island Capital (ORC)
- Undervalued Monthly Dividend Stock #8: Oxford Square Capital (OXSQ)
- Undervalued Monthly Dividend Stock #7: Petrus Resources Ltd. (PTRUF)
- Undervalued Monthly Dividend Stock #6: PennantPark Investment Corp. (PNNT)
- Undervalued Monthly Dividend Stock #5: True North Commercial REIT (TUERF)
- Undervalued Monthly Dividend Stock #4: Invesco Mortgage Capital (IVR)
- Undervalued Monthly Dividend Stock #3: CION Investment Corp. (CION)
- Undervalued Monthly Dividend Stock #2: Surge Energy (ZPTAF)
- Undervalued Monthly Dividend Stock #1: BCP Investment Corporation (BCIC)
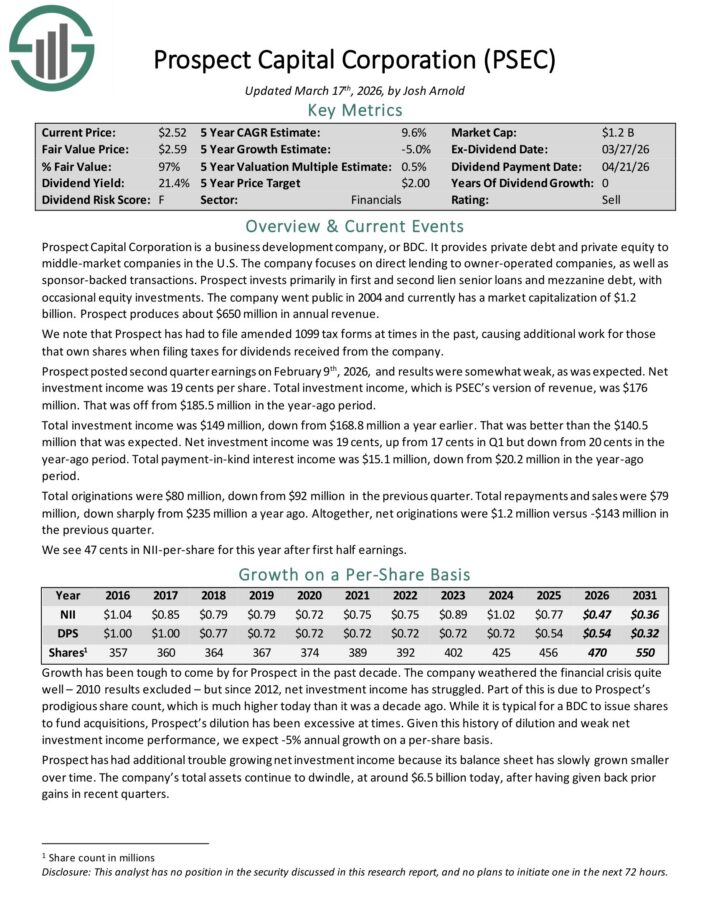
Undervalued Monthly Dividend Stock #10: Prospect Capital (PSEC)
- P/E Ratio: 5.3
Prospect Capital Corporation is a Business Development Company, or BDC, that provides private debt and private equity to middle–market companies in the U.S.
The company focuses on direct lending to owner–operated companies, as well as sponsor–backed transactions. Prospect invests primarily in first and second lien senior loans and mezzanine debt, with occasional equity investments.
Prospect posted second quarter earnings on February 9th, 2026, and results were somewhat weak. Net investment income was 19 cents per share.
Total investment income, which is PSEC’s version of revenue, was $176 million. That was off from $185.5 million in the year-ago period.
Total investment income was $149 million, down from $168.8 million a year earlier. That was better than the $140.5 million that was expected.
Net investment income was 19 cents, up from 17 cents in Q1 but down from 20 cents in the year-ago period. Total payment-in-kind interest income was $15.1 million, down from $20.2 million in the year-ago period.
Total originations were $80 million, down from $92 million in the previous quarter. Total repayments and sales were $79 million, down sharply from $235 million a year ago.
Altogether, net originations were $1.2 million versus -$143 million in the previous quarter.
For 2026, we see 47 cents in NII-per-share for this year after first half earnings.
Click here to download our most recent Sure Analysis report on PSEC (preview of page 1 of 3 shown below):
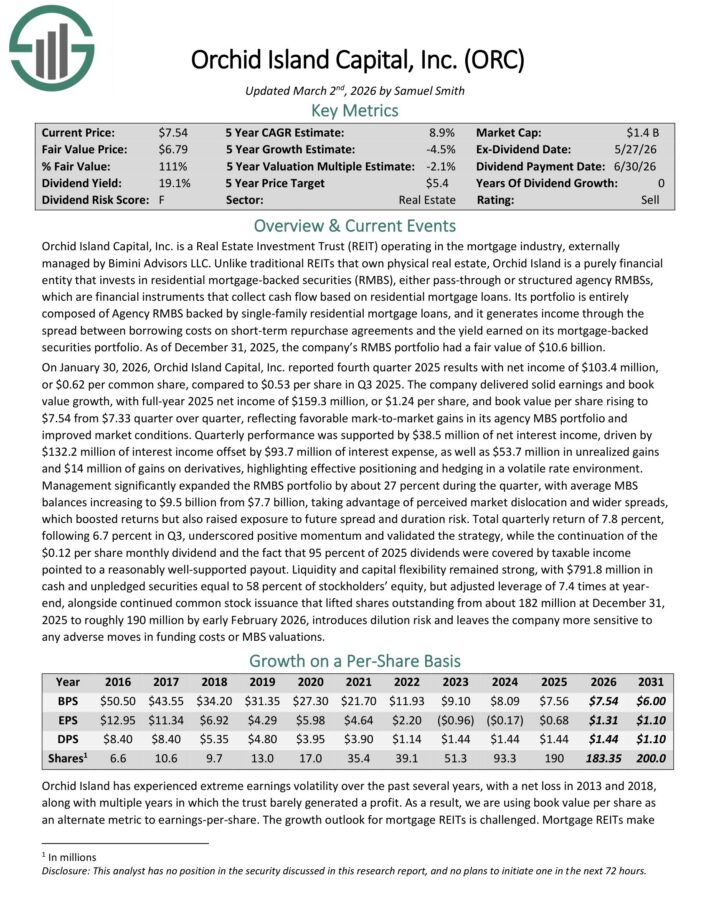
Undervalued Monthly Dividend Stock #9: Orchid Island Capital (ORC)
- P/E Ratio: 5.2
Orchid Island Capital, Inc. is a Real Estate Investment Trust (REIT) operating in the mortgage industry, externally managed by Bimini Advisors LLC.
Orchid Island is a purely financial entity that invests in residential mortgage-backed securities (RMBS), either pass-through or structured agency RMBSs, which are financial instruments that collect cash flow based on residential mortgage loans.
Its portfolio is entirely composed of Agency RMBS backed by single-family residential mortgage loans.
On January 30, 2026, Orchid Island Capital, Inc. reported fourth quarter 2025 results with net income of $103.4 million, or $0.62 per common share, compared to $0.53 per share in Q3 2025.
The company delivered solid earnings and book value growth, with full-year 2025 net income of $159.3 million, or $1.24 per share, and book value per share rising to $7.54 from $7.33 quarter over quarter, reflecting favorable mark-to-market gains in its agency MBS portfolio and improved market conditions.
Quarterly performance was supported by $38.5 million of net interest income, driven by $132.2 million of interest income offset by $93.7 million of interest expense, as well as $53.7 million in unrealized gains and $14 million of gains on derivatives.
Management significantly expanded the RMBS portfolio by about 27 percent during the quarter, with average MBS balances increasing to $9.5 billion from $7.7 billion, taking advantage of perceived market dislocation and wider spreads.
Click here to download our most recent Sure Analysis report on ORC (preview of page 1 of 3 shown below):
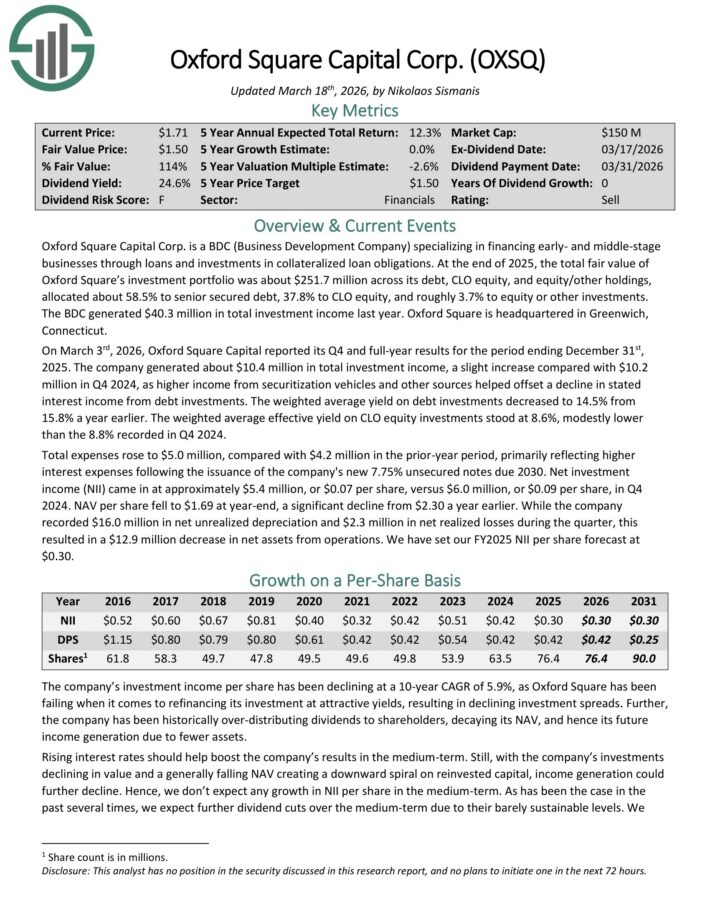
Undervalued Monthly Dividend Stock #8: Oxford Square Capital (OXSQ)
- P/E Ratio: 4.7
Oxford Square Capital Corp. is a BDC (Business Development Company) specializing in financing early- and middle-stage businesses through loans and investments in collateralized loan obligations.
At the end of 2025, the total fair value of Oxford Square’s investment portfolio was about $251.7 million across its debt, CLO equity, and equity/other holdings, allocated about 58.5% to senior secured debt, 37.8% to CLO equity, and roughly 3.7% to equity or other investments.
On March 3rd, 2026, Oxford Square Capital reported its Q4 and full-year results for the period ending December 31st, 2025.
The company generated about $10.4 million in total investment income, a slight increase compared with $10.2 million in Q4 2024, as higher income from securitization vehicles and other sources helped offset a decline in stated interest income from debt investments.
The weighted average yield on debt investments decreased to 14.5% from 15.8% a year earlier. The weighted average effective yield on CLO equity investments stood at 8.6%, modestly lower than the 8.8% recorded in Q4 2024.
Total expenses rose to $5.0 million, compared with $4.2 million in the prior-year period, primarily reflecting higher interest expenses following the issuance of the company’s new 7.75% unsecured notes due 2030.
Net investment income (NII) came in at approximately $5.4 million, or $0.07 per share, versus $6.0 million, or $0.09 per share, in Q4 2024. NAV per share fell to $1.69 at year-end, a significant decline from $2.30 a year earlier..
Click here to download our most recent Sure Analysis report on OXSQ (preview of page 1 of 3 shown below):
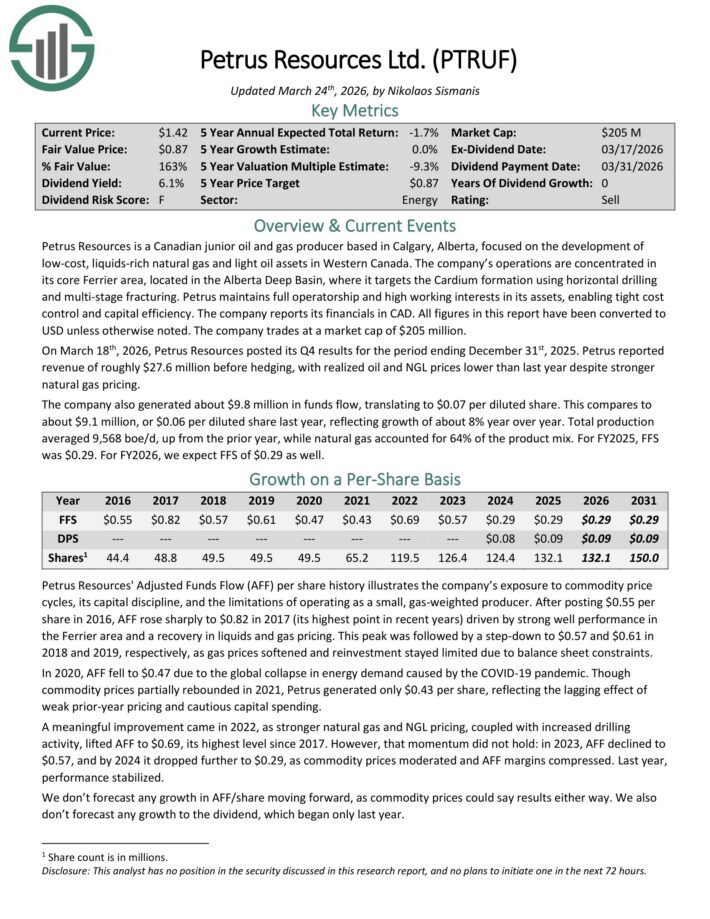
Undervalued Monthly Dividend Stock #7: Petrus Resources Ltd. (PTRUF)
- P/E Ratio: 4.4
Petrus Resources is a Canadian junior oil and gas producer based in Calgary, Alberta, focused on the development of low-cost, liquids-rich natural gas and light oil assets in Western Canada.
The company’s operations are concentrated in its core Ferrier area, located in the Alberta Deep Basin, where it targets the Cardium formation using horizontal drilling and multi-stage fracturing.
Petrus maintains full operatorship and high working interests in its assets, enabling tight cost control and capital efficiency. The company reports its financials in CAD.
On March 18th, 2026, Petrus Resources posted its Q4 results for the period ending December 31st, 2025. Petrus reported revenue of roughly $27.6 million before hedging, with realized oil and NGL prices lower than last year despite stronger natural gas pricing.
The company also generated about $9.8 million in funds flow, translating to $0.07 per diluted share. This compares to about $9.1 million, or $0.06 per diluted share last year, reflecting growth of about 8% year over year.
Total production averaged 9,568 boe/d, up from the prior year, while natural gas accounted for 64% of the product mix. For FY2025, FFS was $0.29.
Click here to download our most recent Sure Analysis report on PTRUF (preview of page 1 of 3 shown below):
Undervalued Monthly Dividend Stock #6: PennantPark Investment Corp. (PNNT)
- P/E Ratio: 4.1
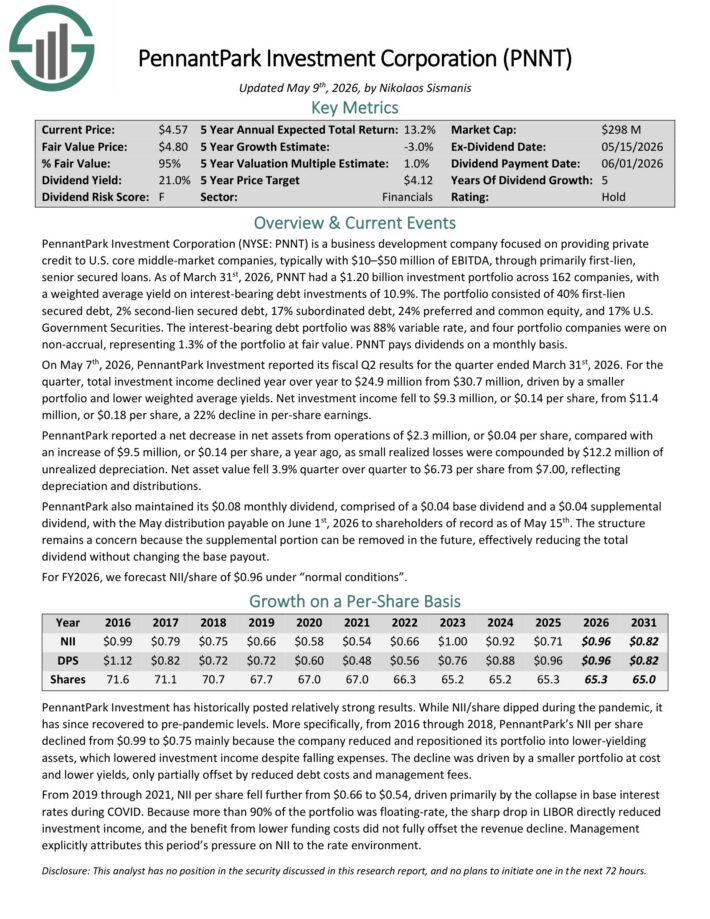
PennantPark Investment Corporation is a business development company focused on providing private credit to U.S. core middle-market companies, typically with $10–$50 million of EBITDA, through primarily first-lien, senior secured loans.
As of March 31st, 2026, PNNT had a $1.20 billion investment portfolio across 162 companies, with a weighted average yield on interest-bearing debt investments of 10.9%.
The portfolio consisted of 40% first-lien secured debt, 2% second-lien secured debt, 17% subordinated debt, 24% preferred and common equity, and 17% U.S. Government Securities.
The interest-bearing debt portfolio was 88% variable rate, and four portfolio companies were on non-accrual, representing 1.3% of the portfolio at fair value.
On May 7th, 2026, PennantPark Investment reported its fiscal Q2 results. For the quarter, total investment income declined year over year to $24.9 million from $30.7 million, driven by a smaller portfolio and lower weighted average yields.
Net investment income fell to $9.3 million, or $0.14 per share, from $11.4 million, or $0.18 per share, a 22% decline in per-share earnings.
PennantPark reported a net decrease in net assets from operations of $2.3 million, or $0.04 per share, compared with an increase of $9.5 million, or $0.14 per share, a year ago.
Click here to download our most recent Sure Analysis report on PNNT (preview of page 1 of 3 shown below):
Undervalued Monthly Dividend Stock #5: True North Commercial REIT (TUERF)
- P/E Ratio: 4.0
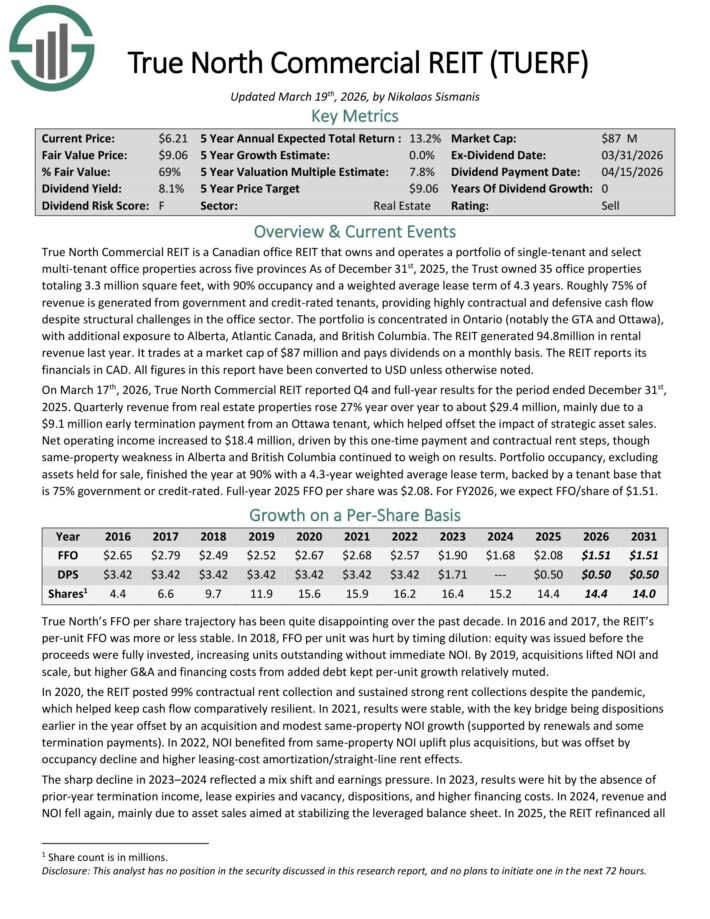
True North Commercial REIT is a Canadian office REIT that owns and operates a portfolio of single-tenant and select multi-tenant office properties across five provinces.
As of December 31st, 2025, the Trust owned 35 office properties totaling 3.3 million square feet, with 90% occupancy and a weighted average lease term of 4.3 years.
Roughly 75% of revenue is generated from government and credit-rated tenants, providing highly contractual and defensive cash flow despite structural challenges in the office sector.
The portfolio is concentrated in Ontario (notably the GTA and Ottawa), with additional exposure to Alberta, Atlantic Canada, and British Columbia.
On March 17th, 2026, True North Commercial REIT reported Q4 and full-year results. Quarterly revenue from real estate properties rose 27% year over year to about $29.4 million, mainly due to a $9.1 million early termination payment from an Ottawa tenant, which helped offset the impact of strategic asset sales.
Net operating income increased to $18.4 million, driven by this one-time payment and contractual rent steps, though same-property weakness in Alberta and British Columbia continued to weigh on results.
Portfolio occupancy, excluding assets held for sale, finished the year at 90% with a 4.3-year weighted average lease term, backed by a tenant base that is 75% government or credit-rated.
Full-year 2025 FFO per share was $2.08. For FY2026, we expect FFO/share of $1.51.
Click here to download our most recent Sure Analysis report on TUERF (preview of page 1 of 3 shown below):
Undervalued Monthly Dividend Stock #4: Invesco Mortgage Capital (IVR)
- P/E Ratio: 3.9
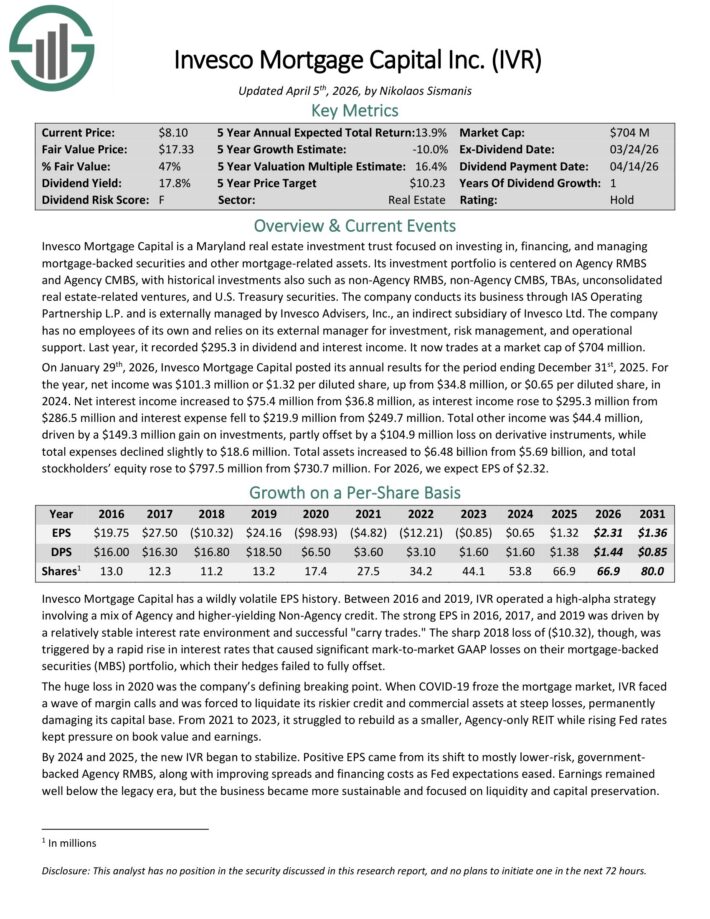
Invesco Mortgage Capital is a Maryland real estate investment trust focused on investing in, financing, and managing mortgage-backed securities and other mortgage-related assets.
Its investment portfolio is centered on Agency RMBS and Agency CMBS, with historical investments also such as non-Agency RMBS, non-Agency CMBS, TBAs, unconsolidated real estate-related ventures, and U.S. Treasury securities.
The company conducts its business through IAS Operating Partnership L.P. and is externally managed by Invesco Advisers, Inc., an indirect subsidiary of Invesco Ltd.
The company has no employees of its own and relies on its external manager for investment, risk management, and operational support. Last year, it recorded $295.3 in dividend and interest income.
On January 29th, 2026, Invesco Mortgage Capital posted its annual results for the period ending December 31st, 2025. For the year, net income was $101.3 million or $1.32 per diluted share, up from $34.8 million, or $0.65 per diluted share, in 2024.
Net interest income increased to $75.4 million from $36.8 million, as interest income rose to $295.3 million from $286.5 million and interest expense fell to $219.9 million from $249.7 million.
Total other income was $44.4 million, driven by a $149.3 million gain on investments, partly offset by a $104.9 million loss on derivative instruments, while total expenses declined slightly to $18.6 million.
Total assets increased to $6.48 billion from $5.69 billion, and total stockholders’ equity rose to $797.5 million from $730.7 million.
For 2026, we expect EPS of $2.32.
Click here to download our most recent Sure Analysis report on IVR (preview of page 1 of 3 shown below):
Undervalued Monthly Dividend Stock #3: CION Investment Corp. (CION)
- P/E Ratio: 3.9
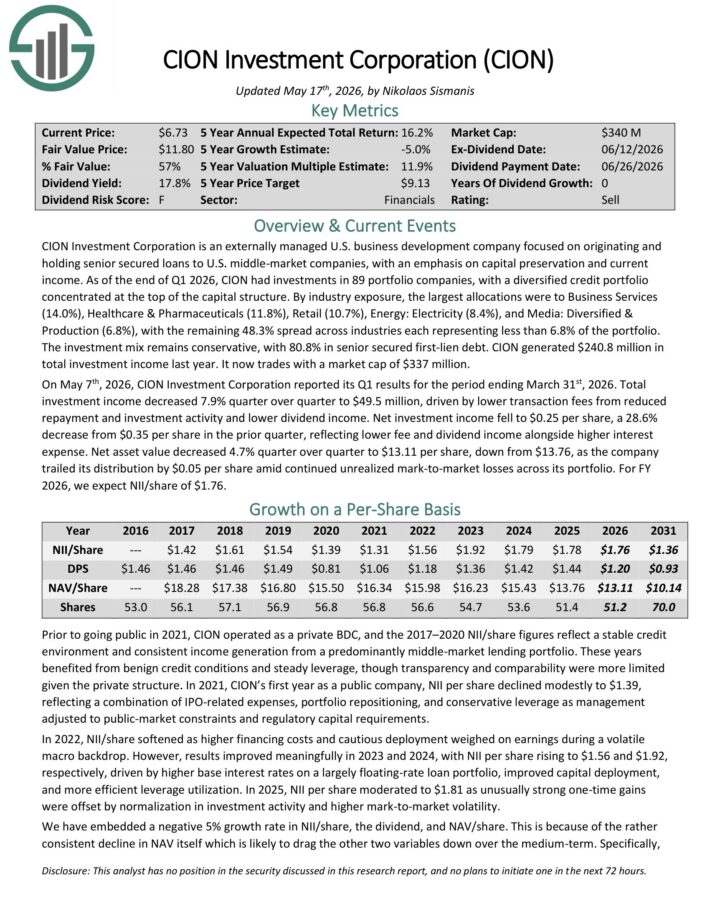
CION Investment Corporation is an externally managed U.S. business development company focused on originating and holding senior secured loans to U.S. middle-market companies, with an emphasis on capital preservation and current income.
As of the end of Q1 2026, CION had investments in 89 portfolio companies, with a diversified credit portfolio concentrated at the top of the capital structure.
By industry exposure, the largest allocations were to Business Services (14.0%), Healthcare & Pharmaceuticals (11.8%), Retail (10.7%), Energy: Electricity (8.4%), and Media: Diversified & Production (6.8%).
The remaining 48.3% is spread across industries each representing less than 6.8% of the portfolio. The investment mix remains conservative, with 80.8% in senior secured first-lien debt.
On May 7th, 2026, CION Investment Corporation reported its Q1 results. Total investment income decreased 7.9% quarter over quarter to $49.5 million, driven by lower transaction fees from reduced repayment and investment activity and lower dividend income.
Net investment income fell to $0.25 per share, a 28.6% decrease from $0.35 per share in the prior quarter, reflecting lower fee and dividend income alongside higher interest expense. Net asset value decreased 4.7% quarter over quarter to $13.11 per share, down from $13.76.
Click here to download our most recent Sure Analysis report on CION (preview of page 1 of 3 shown below):
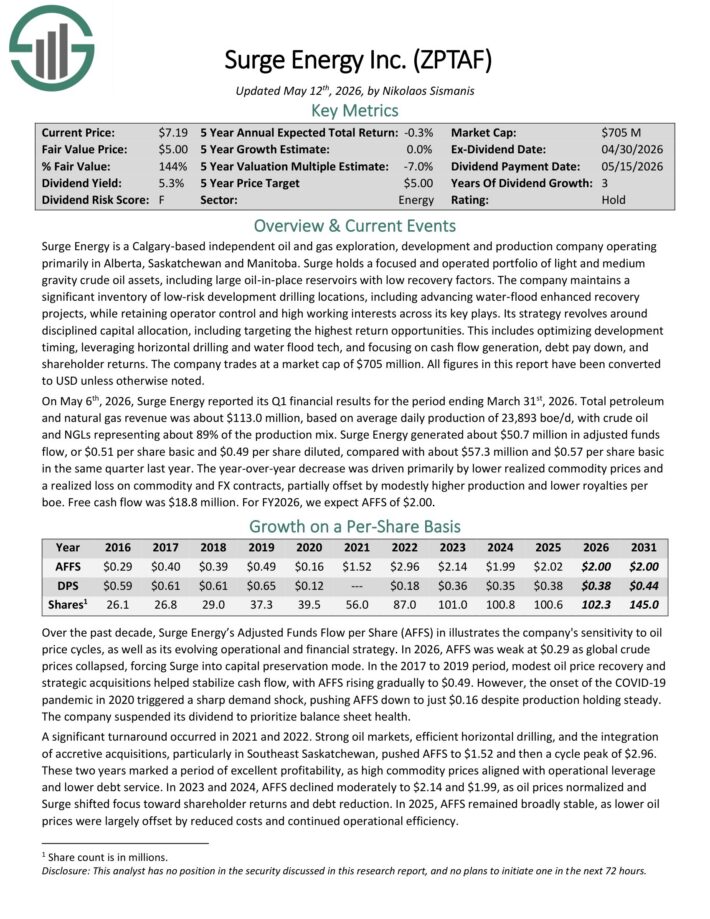
Undervalued Monthly Dividend Stock #2: Surge Energy (ZPTAF)
- P/E Ratio: 3.6
Surge Energy is a Calgary‑based independent oil and gas exploration, development and production company operating primarily in Alberta, Saskatchewan and Manitoba.
Surge holds a focused and operated portfolio of light and medium gravity crude oil assets, including large oil‑in‑place reservoirs with low recovery factors.
On May 6th, 2026, Surge Energy reported its Q1 financial results. Total petroleum and natural gas revenue was about $113.0 million, based on average daily production of 23,893 boe/d, with crude oil and NGLs representing about 89% of the production mix.
Surge Energy generated about $50.7 million in adjusted funds flow, or $0.51 per share basic and $0.49 per share diluted, compared with about $57.3 million and $0.57 per share basic in the same quarter last year.
The year-over-year decrease was driven primarily by lower realized commodity prices and a realized loss on commodity and FX contracts, partially offset by modestly higher production and lower royalties per boe.
Free cash flow was $18.8 million.
Click here to download our most recent Sure Analysis report on ZPTAF (preview of page 1 of 3 shown below):
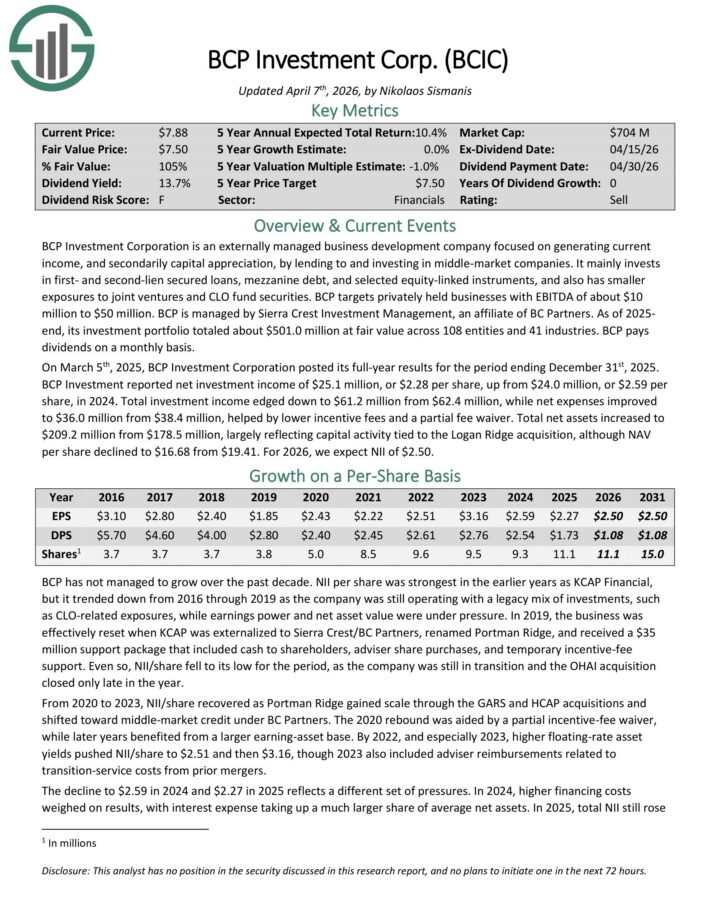
Undervalued Monthly Dividend Stock #1: BCP Investment Corporation (BCIC)
- P/E Ratio: 3.1
BCP Investment Corporation is an externally managed business development company focused on generating current income, and secondarily capital appreciation, by lending to and investing in middle-market companies.
It mainly invests in first- and second-lien secured loans, mezzanine debt, and selected equity-linked instruments, and also has smaller exposures to joint ventures and CLO fund securities.
BCP targets privately held businesses with EBITDA of about $10 million to $50 million. BCP is managed by Sierra Crest Investment Management, an affiliate of BC Partners.
As of 2025 end, its investment portfolio totaled about $501.0 million at fair value across 108 entities and 41 industries.
On March 5th, 2025, BCP Investment Corporation posted its full-year results for the period ending December 31st, 2025. BCP Investment reported net investment income of $25.1 million, or $2.28 per share, up from $24.0 million, or $2.59 per share, in 2024.
Total investment income edged down to $61.2 million from $62.4 million, while net expenses improved to $36.0 million from $38.4 million, helped by lower incentive fees and a partial fee waiver.
Total net assets increased to $209.2 million from $178.5 million, largely reflecting capital activity tied to the Logan Ridge acquisition, although NAV per share declined to $16.68 from $19.41.
For 2026, we expect NII of $2.50.
Click here to download our most recent Sure Analysis report on BCIC (preview of page 1 of 3 shown below):
Further Reading
If you are interested in finding high-quality dividend growth stocks and/or other high-yield securities and income securities, the following Sure Dividend resources will be useful:
Monthly Dividend Stock Individual Security Research
Other Sure Dividend Resources
- Dividend Kings: 50+ years of rising dividends
- Dividend Champions: 25+ years of rising dividends
- Dividend Aristocrats: 25+ years of rising dividends and in the S&P 500