Updated on August 9th, 2026 by Nikolaos Sismanis
Real Estate Investment Trusts (REITs) make compelling income investments.
That’s because they are legally required to distribute 90%+ of their income to investors. That often translates to high dividend yields.
Some REITs have much higher dividend yields than others.
This research report analyzes the 10 highest-yielding REITs we cover in the Sure Analysis Research Database.
Not all high-yielding stocks are automatic buys. Investors should carefully assess the fundamentals to ensure that high yields are sustainable.
Dividend safety, valuation, management, balance sheet health, and growth are also very important factors.
We urge investors to use the analysis below as a starting point for high-yield REITs. Be sure to do significant due diligence before buying into any security, especially high-yield securities.
Many (but not all) high-yield securities have a significant risk of a dividend reduction and/or deteriorating business results.
Table of Contents
You can instantly jump to any specific section of the article by using the links below:
- High-Yield REIT No. 10: BTB Real Estate Investment Trust (BTBIF)
- High-Yield REIT No. 9: Nexus Industrial REIT (EFRTF)
- High-Yield REIT No. 8: NexPoint Residential Trust (NXRT)
- High-Yield REIT No. 7: Gladstone Commercial Corp. (GOOD)
- High-Yield REIT No. 6: Community Healthcare Trust (CHCT)
- High-Yield REIT No. 5: Innovative Industrial Properties (IIPR)
- High-Yield REIT No. 4: AGNC Investment Corp. (AGNC)
- High-Yield REIT No. 3: Dynex Capital (DX)
- High-Yield REIT No. 2: ARMOUR Residential REIT (ARR)
- High-Yield REIT No. 1: Orchid Island Capital (ORC)
High-Yield REIT No. 10: BTB Real Estate Investment Trust (BTBIF)
- Dividend Yield: 8.1%
BTB Real Estate Investment Trust owns and manages industrial, suburban office, and necessity-based retail properties across Canada.
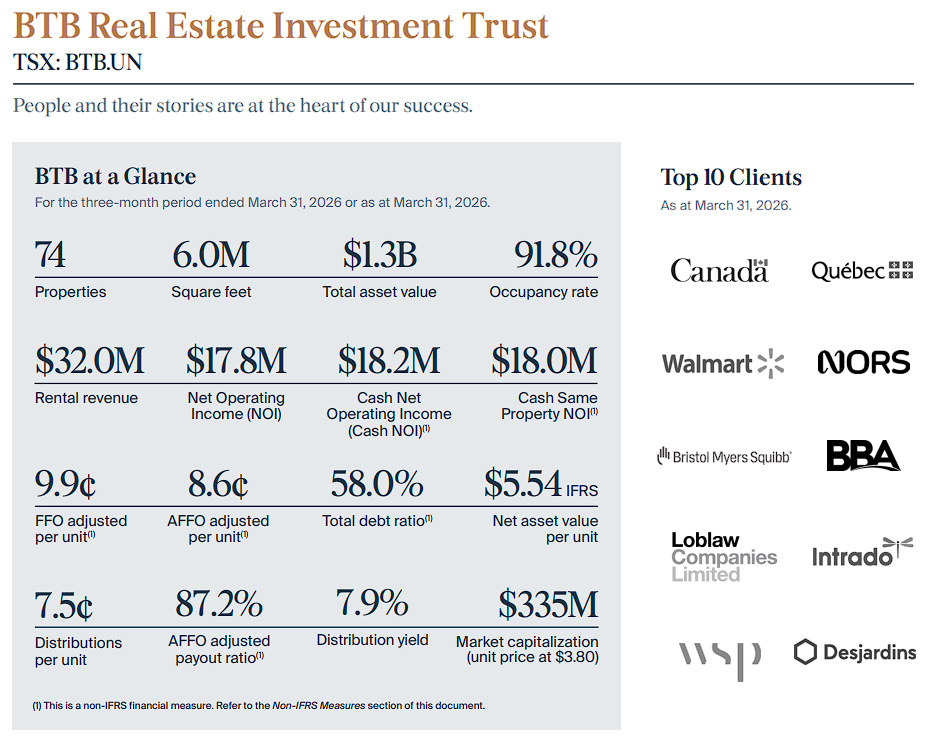
At the end of the first quarter, its portfolio included 74 properties totaling 6.0 million square feet and approximately C$1.3 billion of assets.
Industrial properties represented 38% of portfolio value, suburban offices accounted for 41%, and necessity-based retail made up the remaining 21%.
In the first quarter of 2026, rental revenue declined to C$32.0 million from C$34.4 million, while net operating income fell to C$17.8 million from C$19.8 million.
Adjusted AFFO decreased to C$7.7 million, or C$0.086 per unit, from C$9.2 million, or C$0.103 per unit.
Committed occupancy was 91.8%, while 206,095 square feet of leasing activity produced average renewal-rent growth of 7.2%.
BTB acquired three fully leased industrial properties near Edmonton for C$28.5 million, which should contribute C$2.5 million of annualized NOI and advance its portfolio repositioning.
The REIT subsequently established a C$30 million at-the-market equity program, providing additional capital but creating potential dilution if heavily used.
BTB pays C$0.025 per unit monthly, or C$0.30 annually, and its first-quarter adjusted AFFO payout ratio was 87.2%.
The distribution has remained unchanged since its 2020 reduction.
Elevated leverage and meaningful suburban-office exposure remain the principal risks to the payout.
High-Yield REIT No. 9: Nexus Industrial REIT (EFRTF)
- Dividend Yield: 8.3%
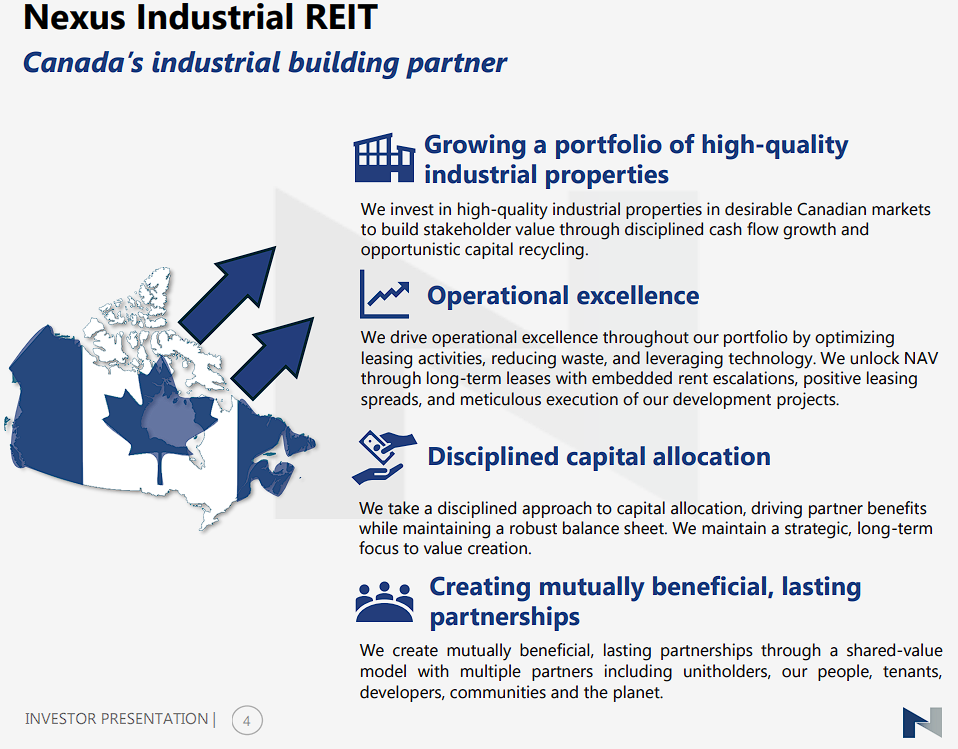
Nexus Industrial REIT is a Canada-focused, pure-play industrial REIT with 88 properties totaling approximately 12.4 million square feet.
Its portfolio spans distribution, logistics, manufacturing, and light-industrial facilities, providing exposure to tenants and markets that can benefit from e-commerce, supply-chain modernization, and limited new industrial supply.
In the first quarter of 2026, property revenue increased to C$46.0 million from C$44.8 million, while net operating income rose 5.4% to C$33.8 million.
Same-property NOI grew 1.0%, and normalized adjusted funds from operations per unit improved to C$0.162 from C$0.154.
Occupancy was 95%, and leasing completed during the quarter produced an average rent spread of 32%.
The most encouraging dividend development was a normalized AFFO payout ratio of 96.6%, the first sub-100% result in 10 quarters.
Coverage is still tight, but management expects the full-year ratio to remain below 100%.
Nexus also strengthened its financing position with an inaugural C$500 million bond offering in April, using the proceeds primarily to repay existing debt.
The units pay monthly distributions, but U.S. investors should remember that the Canadian-dollar payout and the quoted yield can fluctuate with foreign-exchange movements.
High-Yield REIT No. 8: NexPoint Residential Trust (NXRT)
- Dividend Yield: 8.5%
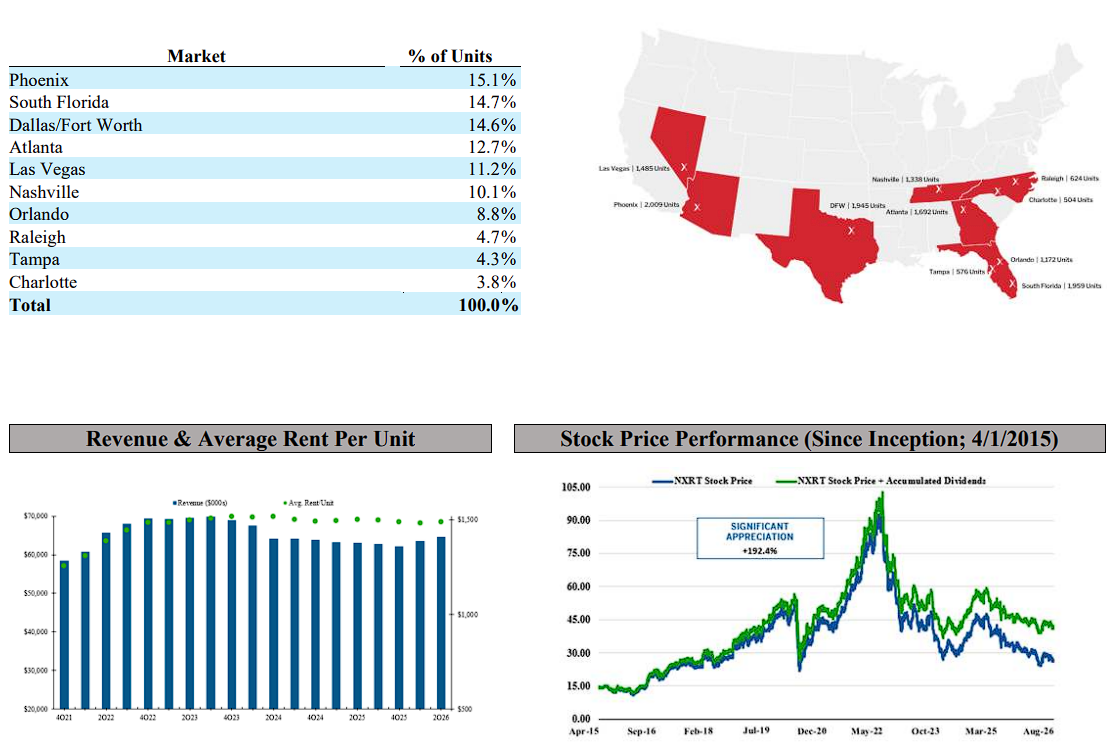
NexPoint Residential Trust owns 36 apartment properties containing 13,305 units, primarily in Sunbelt markets.
Its strategy combines workforce-oriented multifamily housing with targeted renovations that can support higher rents and property values.
This approach offers meaningful upside when rental conditions are favorable, although its external management structure and significant financial leverage raise the risk profile.
First-quarter 2026 revenue edged up to $63.5 million from $63.2 million. However, Core FFO declined to $17.3 million from $19.1 million, while AFFO fell to $19.6 million from $21.6 million.
Same-store revenue decreased 2.2%, same-store NOI declined 2.7%, and average rent was 0.9% lower.
Portfolio occupancy was 93.5%, reflecting the softer operating environment across several Sunbelt apartment markets.
NexPoint continued its value-add program, completing 300 upgrades and leasing 225 renovated units at an average monthly premium of $69, equal to a 19% return on investment.
The REIT also used mortgage proceeds to repay $33 million of credit-facility borrowings.
Its $0.53 quarterly dividend equals $2.12 annually and represents approximately 71% of the midpoint of 2026 AFFO guidance.
NexPoint has raised its dividend for 10 consecutive years, but future growth will depend on stabilizing property operations and managing its debt load effectively.
High-Yield REIT No. 7: Gladstone Commercial Corp. (GOOD)
- Dividend Yield: 9.3%
Gladstone Commercial Corporation owns single-tenant and anchored multi-tenant net-lease properties across the United States.
Management has been steadily repositioning the portfolio toward industrial real estate and away from offices, which should improve the asset mix over time.
At the end of the second quarter, the portfolio included 151 properties totaling 17.7 million square feet and was 98.7% leased.
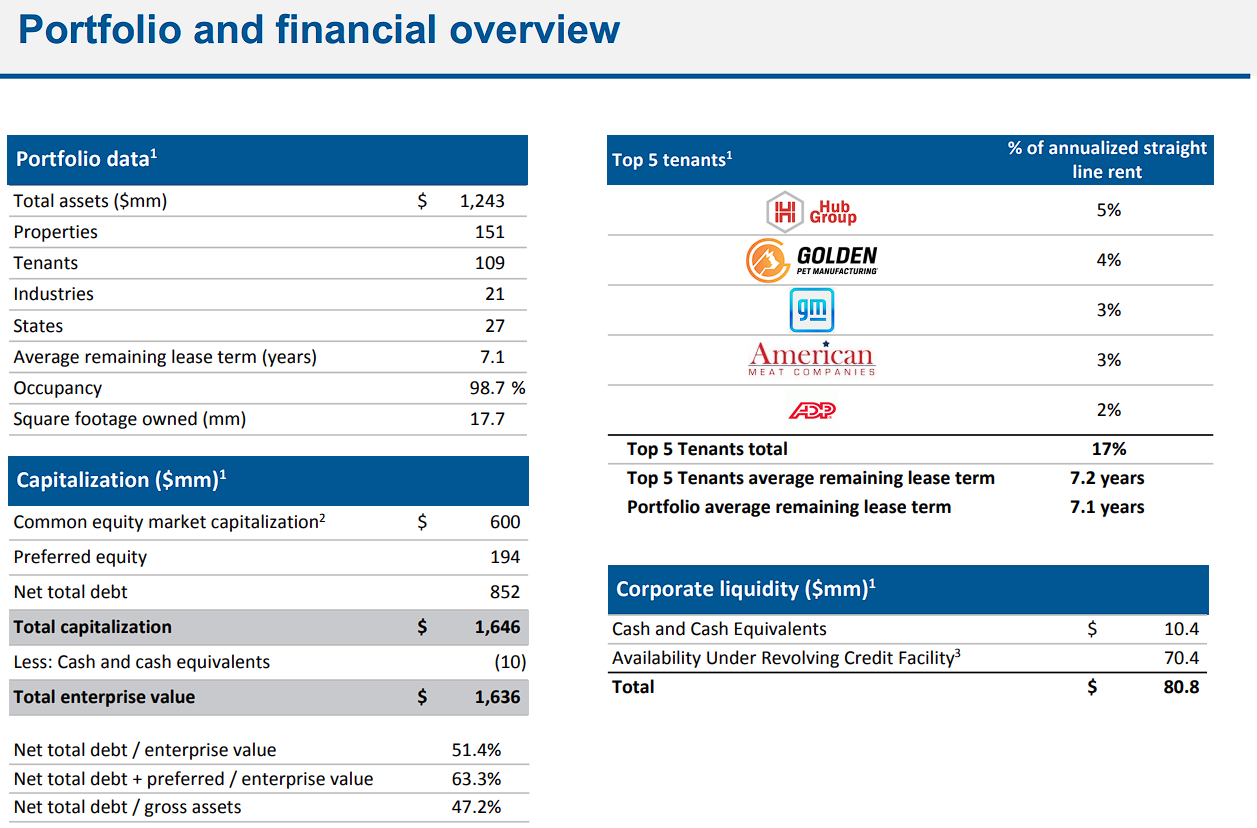
Second-quarter 2026 operating revenue was $44.0 million, up 5.0% sequentially.
Core funds from operations increased to $18.3 million, or $0.38 per diluted share, from $17.0 million, or $0.35, in the prior quarter.
Results benefited from a lease-termination payment, while rent collection remained 100% from April through July.
Portfolio recycling remains central to the investment case.
Gladstone acquired a 153,890-square-foot industrial property for $22.8 million at a 6.76% capitalization rate, sold another asset for $12.9 million, and purchased an additional industrial property after quarter-end for $6.6 million at a 9.16% cap rate.
The REIT pays a $0.10 monthly common dividend, or $1.20 annually.
That distribution represented about 79% of second-quarter Core FFO, and the company has made more than 250 consecutive monthly common-stock distributions.
Still, investors should monitor office exposure, refinancing costs, and acquisition discipline.
High-Yield REIT No. 6: Community Healthcare Trust (CHCT)
- Dividend Yield: 12.3%
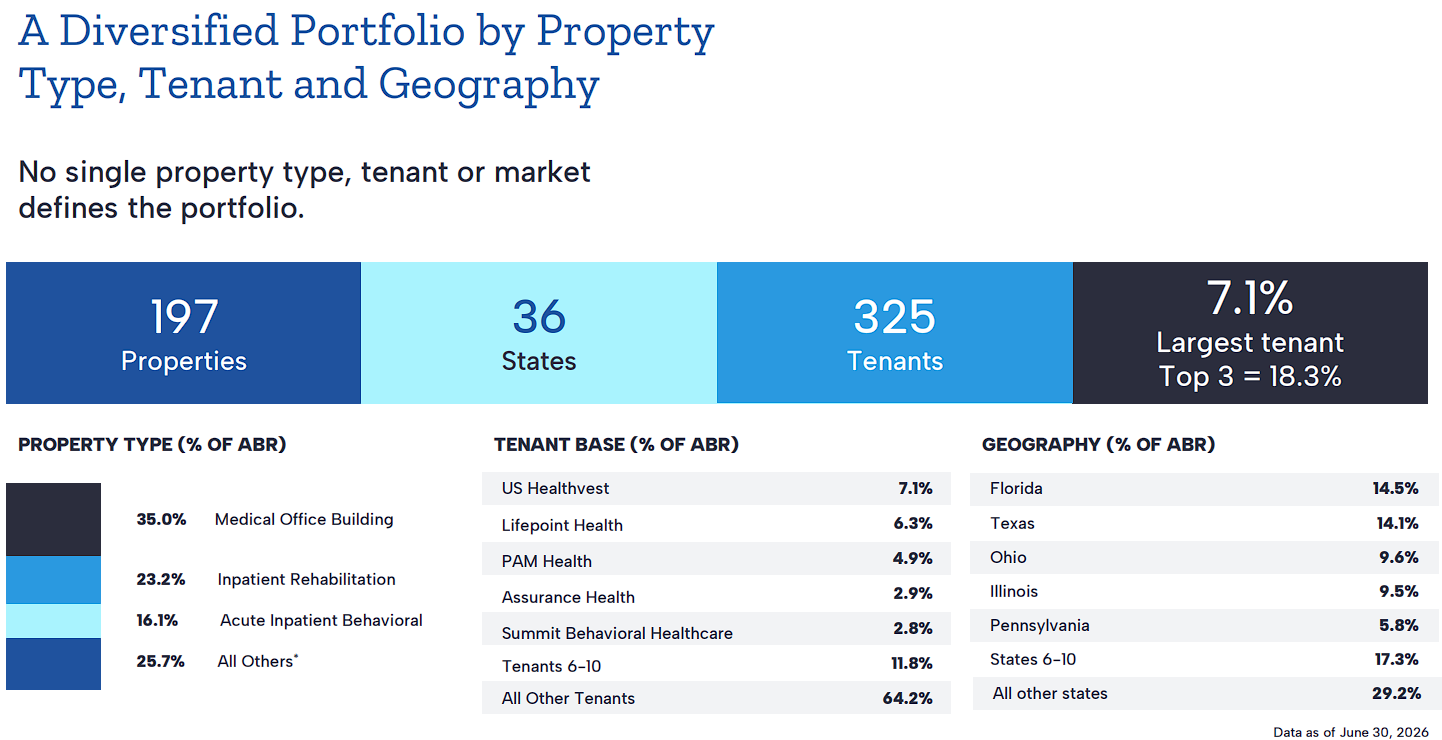
Community Healthcare Trust owns healthcare properties in smaller U.S. markets, including medical office buildings, inpatient rehabilitation facilities, behavioral-health facilities, and specialty centers.
Its portfolio comprised 200 properties across 36 states and about 4.6 million square feet at the end of the first quarter.
For the first quarter of 2026, the REIT reported FFO of $0.49 per share and AFFO of $0.56 per share.
It acquired a Florida inpatient rehabilitation facility for $28.5 million at an expected 9.3% return; the property is fully leased through 2044.
Community Healthcare also sold one property for net proceeds of $5.2 million and had four additional properties under definitive purchase agreements for roughly $99 million.
The company’s growth pipeline offers attractive initial yields, but tenant-credit issues remain important.
A geriatric behavioral-hospital tenant made only a partial rent payment during the quarter, and the potential sale or re-leasing of affected properties remains uncertain.
Community Healthcare raised its quarterly dividend to $0.48, continuing a record of increasing the payout every quarter since its 2015 initial public offering.
The distribution consumed about 86% of first-quarter AFFO.
That coverage is reasonable for a REIT, but the 12.3% yield indicates that investors expect meaningful execution and tenant risks.
High-Yield REIT No. 5: Innovative Industrial Properties (IIPR)
- Dividend Yield: 13.0%
Innovative Industrial Properties is an internally managed specialty REIT serving regulated cannabis operators and, increasingly, life-science real estate.
At the end of the first quarter, it owned 110 properties totaling 8.9 million square feet across 19 states, representing approximately $2.5 billion of investment.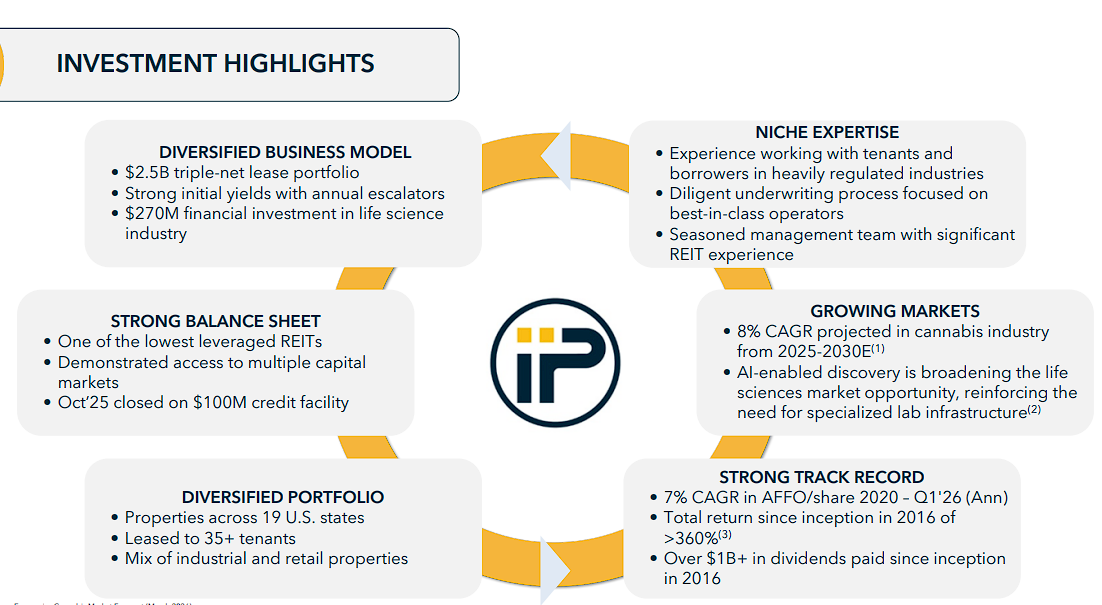
First-quarter 2026 revenue declined 3.8% to $69.0 million, largely because tenant defaults reduced revenue by $6.9 million.
Normalized FFO was $1.78 per share, while AFFO fell to $1.88 from $1.94 a year earlier.
Financial investments in IQHQ generated $5.5 million of interest and dividend income, partly offsetting pressure in the cannabis portfolio.
The REIT repaid $282 million of notes due in 2026, later issued $402.5 million of 6.0% exchangeable notes due in 2029, and used part of the proceeds to repurchase shares.
However, tenant risk remains elevated: Parallel affiliates subsequently defaulted on July obligations tied to two Florida leases that represented roughly 5.2% of annualized contractual rent and other income.
The quarterly dividend is $1.90, slightly above first-quarter AFFO, after seven consecutive years of dividend growth.
The high yield therefore reflects both valuation upside and material uncertainty around rent collection and dividend coverage.
High-Yield REIT No. 4: AGNC Investment Corp. (AGNC)
- Dividend Yield: 13.5%
AGNC Investment Corp. is a mortgage REIT that invests primarily in residential mortgage-backed securities guaranteed by U.S. government-sponsored enterprises or agencies.
It finances these securities with repurchase agreements and hedges much of its interest-rate exposure.
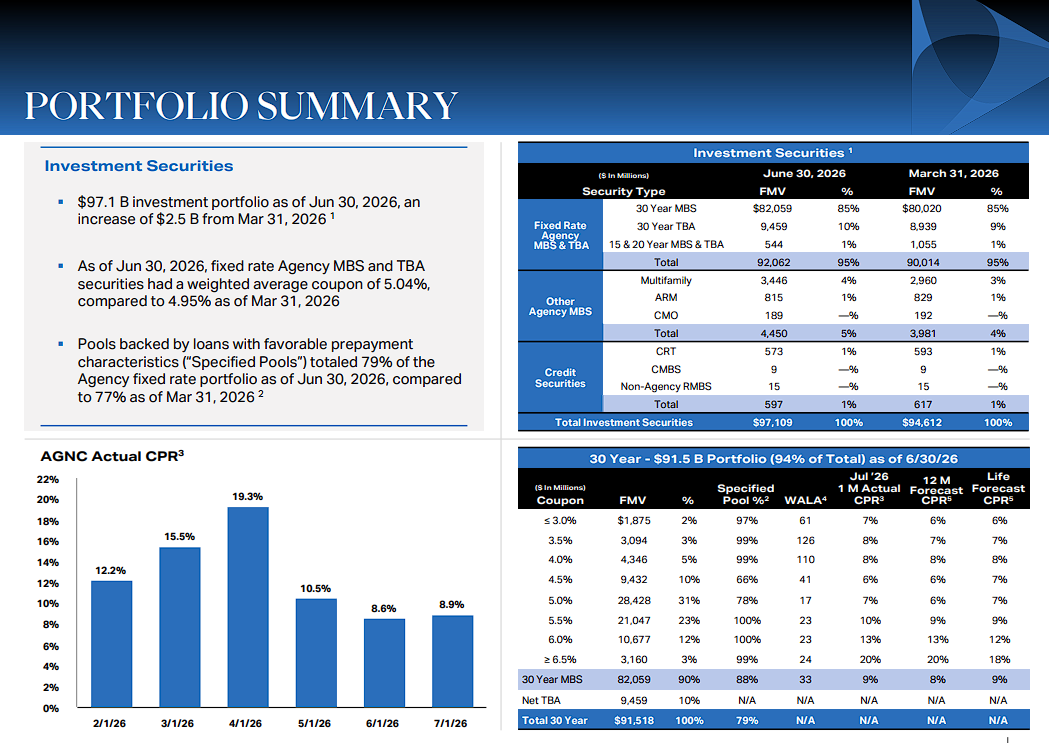
This model can produce substantial income, but results depend heavily on borrowing costs, mortgage spreads, prepayments, leverage, and book-value changes.
In the second quarter of 2026, AGNC generated comprehensive income of $0.52 per share and net spread and dollar-roll income of $0.40 per share.
Tangible net book value increased 2.4% to $8.58 per share, producing a 6.7% economic return for the quarter.
The annualized net interest spread was 2.00%, while the constant prepayment rate remained elevated at 13.0%.
AGNC ended the quarter with 7.4 times tangible at-risk leverage and $7.5 billion of unencumbered cash and Agency securities, equal to 62% of tangible equity.
It also issued 16.2 million common shares through its at-the-market program, raising $167 million and expanding investable capital while diluting existing shareholders.
The company has maintained its $0.12 monthly dividend for more than six years.
Second-quarter net spread income covered the $0.36 of dividends paid, but mortgage REIT earnings and book values can change quickly, so the 13.5% yield should not be viewed as bond-like income.
High-Yield REIT No. 3: Dynex Capital (DX)
- Dividend Yield: 15.9%
Dynex Capital is an internally managed mortgage REIT that invests primarily in Agency residential and commercial mortgage-backed securities.
Nearly all its investment portfolio carries an Agency guarantee, limiting credit risk.
Nevertheless, leverage, funding costs, prepayment behavior, hedging effectiveness, and changes in mortgage-security prices can create substantial earnings and book-value volatility.
Dynex produced a 6.4% total economic return in the second quarter of 2026.
Book value rose by $0.30 to $12.90 per share, while comprehensive income and net income were both $0.80 per common share.
Earnings available for distribution improved to $0.36 per share from $0.31 in the first quarter, reflecting a better earnings environment.
Management expanded the investment portfolio by 11% sequentially to $27.6 billion after purchasing $2.8 billion of mortgage-backed securities.
At the same time, Dynex raised $391 million of common equity and ended the quarter with $1.6 billion of liquidity.
Leverage, including to-be-announced securities, declined to 8.1 times from 8.6 times.
The REIT pays $0.17 per share monthly, or $0.51 for the quarter.
Because second-quarter distributable earnings did not fully cover that amount, dividend coverage remains the central risk despite improving earnings.
Dynex has raised its annual dividend for two consecutive years, but its long-term payout record includes prior reductions.
Deep Dive: Click here to download (for free) our most recent 3-Page Sure Analysis PDF report on Dynex Capital (DX).
High-Yield REIT No. 2: ARMOUR Residential REIT (ARR)
- Dividend Yield: 17.4%
ARMOUR Residential REIT invests mainly in fixed-rate residential mortgage-backed securities issued or guaranteed by U.S. government-sponsored entities.
Credit risk is limited by those guarantees, but the company employs substantial leverage and remains highly sensitive to mortgage spreads, interest-rate volatility, prepayments, financing costs, and the effectiveness of its hedging portfolio.
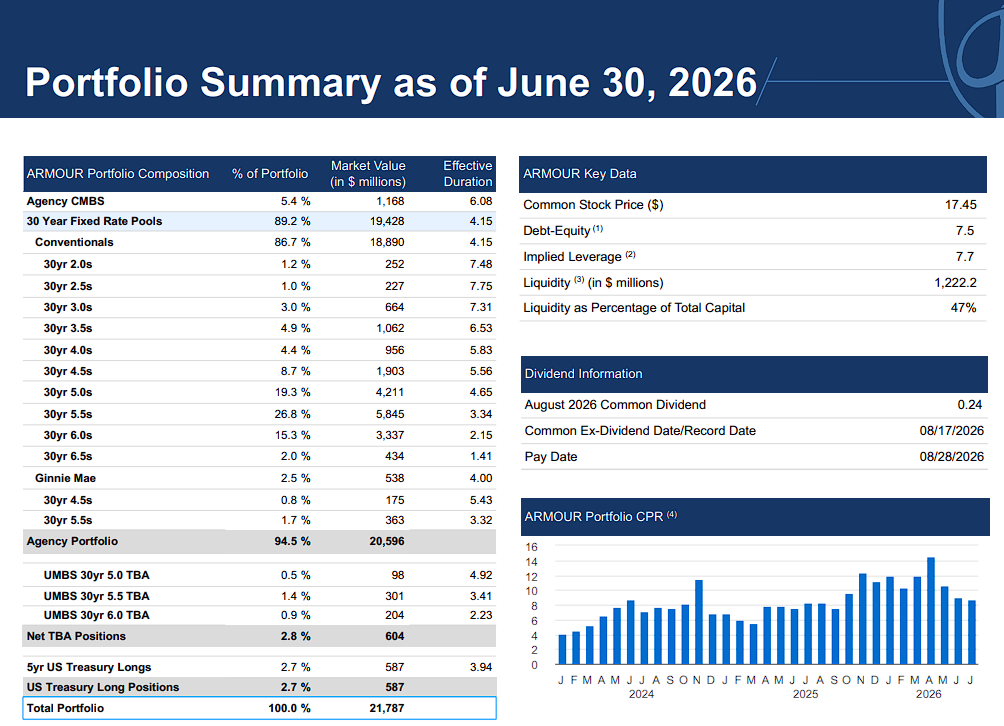
In the second quarter of 2026, ARMOUR reported GAAP net income available to common shareholders of $111.5 million, or $0.86 per share.
Distributable earnings were $93.2 million, or $0.72 per share, matching the $0.72 of monthly dividends declared for the quarter.
Book value increased 0.6% to $17.53 per share, and the REIT generated a 4.8% total economic return.
The investment portfolio was about $21.8 billion, with implied leverage near 7.7 times.
Liquidity remained substantial at roughly $1.2 billion, or 47% of shareholders’ equity.
ARMOUR also raised $218.7 million by issuing about 12.7 million common shares through its at-the-market program, supporting portfolio expansion but increasing the share count.
The company currently pays $0.24 per share each month.
While the latest quarter’s distributable earnings covered the payout, ARMOUR has reduced its dividend multiple times over the long term.
That history, combined with leverage and earnings sensitivity, helps explain the exceptionally high 17.4% yield.
High-Yield REIT No. 1: Orchid Island Capital (ORC)
- Dividend Yield: 18.7%
Orchid Island Capital is an externally managed mortgage REIT that invests in Agency residential mortgage-backed securities.
Its portfolio includes pass-through securities and structured Agency RMBS.
Government guarantees reduce credit risk, but the leveraged business model exposes investors to interest-rate movements, mortgage spreads, prepayment speeds, hedging outcomes, and changes in book value.
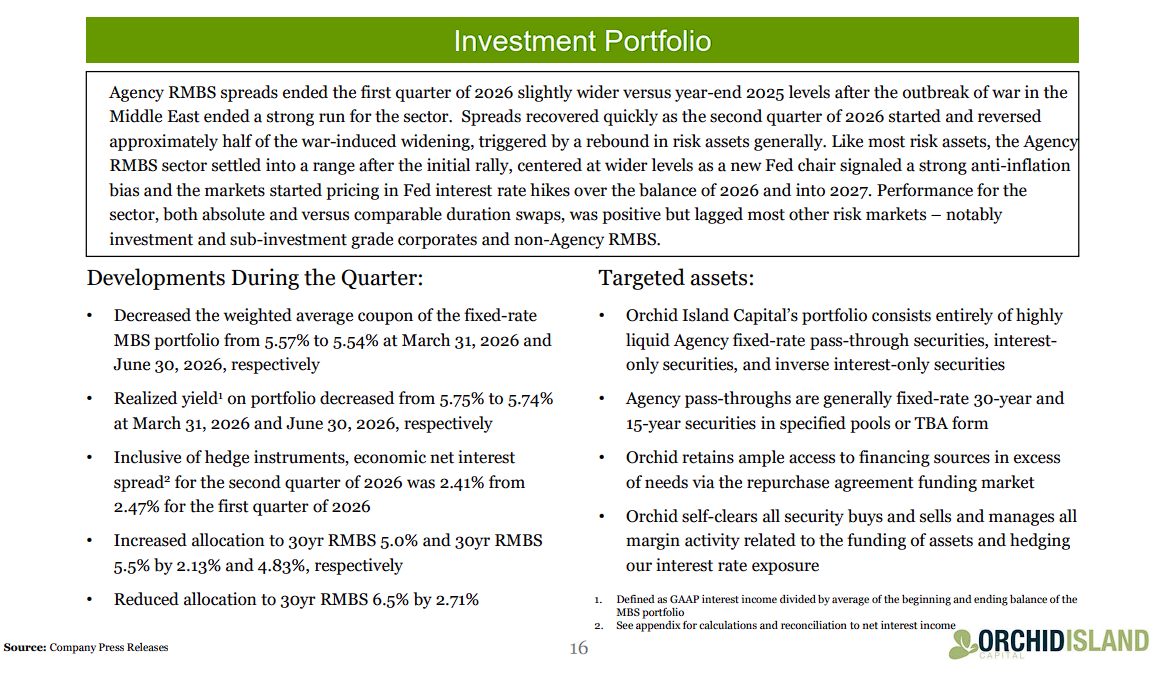
For the second quarter of 2026, Orchid generated net income of $89.2 million, or $0.44 per share.
Net interest income was $60.0 million, or $0.30 per share, and investment and derivative gains totaled $36.0 million.
Book value increased by $0.14 to $7.22 per share, helping produce a 6.2% quarterly total return.
The portfolio reached $11.5 billion, economic leverage was 7.3 times, and the net interest spread was just under 2%.
Orchid issued shares during the first half to expand its capital base, although second-quarter issuance was relatively modest.
Note that management cut the monthly payout by 16.7% in April, from $0.12 to $0.10 per share.
The lower rate has since been maintained, but Orchid has a long history of dividend reductions.
Its 18.7% yield is therefore less a sign of dependable income than a reflection of the market’s expectations for continued earnings, book-value, and payout volatility.
Final Thoughts
The highest-yielding names in our coverage universe offer substantial income potential, but the ranking is dominated by leveraged mortgage REITs and other specialized vehicles.
Those yields can change rapidly when book values, financing costs, portfolio cash flows, or distributions move.
We suggest using this list as a research starting point rather than a buy list.
Property owners such as Nexus, NexPoint, Gladstone Commercial, and Community Healthcare have different risk drivers from mortgage REITs.
Before considering any name, the key checks are dividend coverage, leverage, liquidity, asset quality, and the durability of the cash flows supporting the payout.
If you are interested in finding high-quality dividend growth stocks and/or other high-yield securities and income securities, the following Sure Dividend resources will be useful:
High-Yield Individual Security Research
Other Sure Dividend Resources
- Dividend Kings: 50+ years of rising dividends
- Dividend Aristocrats: 25+ years of rising dividends and in the S&P 500
- Monthly Dividend Stocks: Individual securities that pay out every month