Updated on June 18th, 2026 by Bob Ciura
DRIP stands for Dividend Reinvestment Plan. When an investor is enrolled in DRIP stocks, it means that incoming dividend payments are used to purchase more shares of the issuing company – automatically.
Many businesses offer DRIPs that require the investors to pay fees. Obviously, paying fees is a negative for investors. As a general rule, investors are better off avoiding DRIP stocks that charge fees.
Fortunately, many companies offer no-fee DRIP stocks. These allow investors to use their hard-earned dividends to build even larger positions in their favorite high-quality, dividend-paying companies – for free.
The Dividend Champions are a group of quality dividend stocks that have raised their dividends for at least 25 consecutive years.
You can download your free copy of the Dividend Champions list, along with relevant financial metrics like price-to-earnings ratios, dividend yields, and payout ratios, by clicking on the link below:
Think about the powerful combination of DRIPs and Dividend Champions…
You are reinvesting dividends into a company that pays higher dividends every year. This means that every year you get more shares – and each share is paying you more dividend income than the previous year.
This makes a powerful (and cost-effective) compounding machine.
This article takes a look at the top 15 Dividend Champions that are no-fee DRIP stocks, ranked in order of expected total returns from lowest to highest.
The updated list for 2026 includes our top 15 Dividend Champions, ranked by expected returns according to the Sure Analysis Research Database, that offer no-fee DRIPs to shareholders.
You can skip to analysis of any individual Dividend Champion below:
- #15: Arrow Financial (AROW)
- #14: American States Water (AWR)
- #13: Northwest Natural Holding (NWN)
- #12: Illinois Tool Works (ITW)
- #11: New Jersey Resources (NJR)
- #10: Nordson Corp. (NDSN)
- #9: Realty Income (O)
- #8: RPM International (RPM)
- #7: National Fuel Gas (NFG)
- #6: Hormel Foods (HRL)
- #5: Tompkins Financial (TMP)
- #4: A.O. Smith (AOS)
- #3: Abbott Laboratories (ABT)
- #2: Sanofi (SNY)
- #1: S&P Global (SPGI)
Additionally, please see the video below for more coverage.
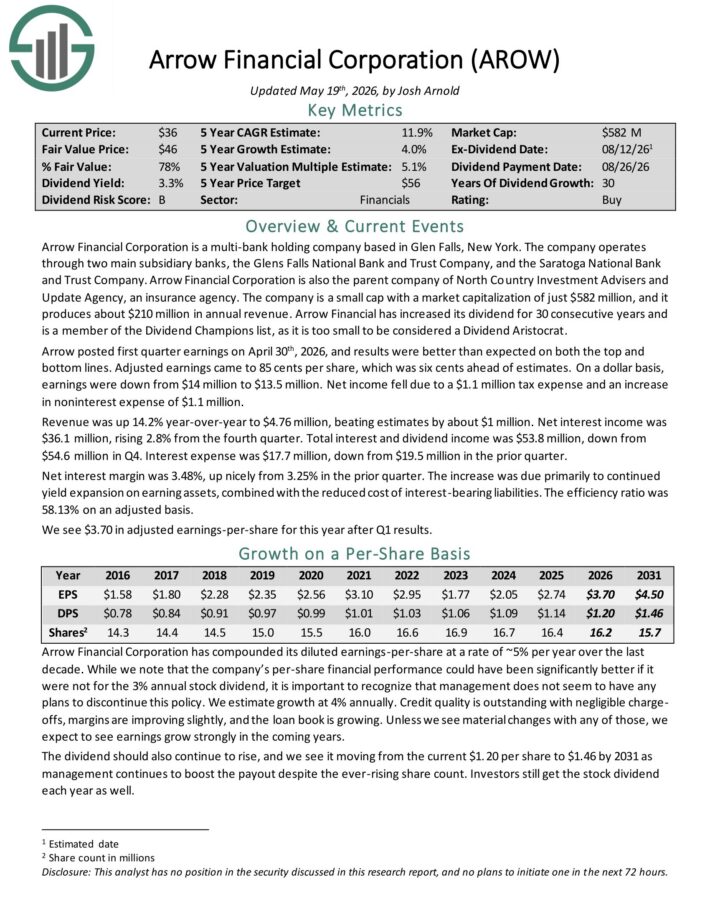
#15: Arrow Financial Corporation (AROW)
- 5-year expected annual returns: 10.2%
Arrow Financial Corporation is a multi-bank holding company based in Glen Falls, New York. The company operates through two main subsidiary banks, the Glens Falls National Bank and Trust Company, and the Saratoga National Bank and Trust Company.
Arrow Financial Corporation is also the parent company of North Country Investment Advisers and Update Agency, an insurance agency. The company is a small cap, and it produces about $163 million in annual revenue.
Arrow posted first quarter earnings on April 30th, 2026, and results were better than expected on both the top and bottom lines. Adjusted earnings came to 85 cents per share, which was six cents ahead of estimates.
On a dollar basis, earnings were down from $14 million to $13.5 million. Net income fell due to a $1.1 million tax expense and an increase in non-interest expense of $1.1 million.
Revenue was up 14.2% year-over-year to $4.76 million, beating estimates by about $1 million. Net interest income was $36.1 million, rising 2.8% from the fourth quarter.
Total interest and dividend income was $53.8 million, down from $54.6 million in Q4. Interest expense was $17.7 million, down from $19.5 million in the prior quarter.
Net interest margin was 3.48%, up nicely from 3.25% in the prior quarter. The increase was due primarily to continued yield expansion on earning assets, combined with the reduced cost of interest-bearing liabilities.
The efficiency ratio was 58.13% on an adjusted basis.
Click here to download our most recent Sure Analysis report on AROW (preview of page 1 of 3 shown below):
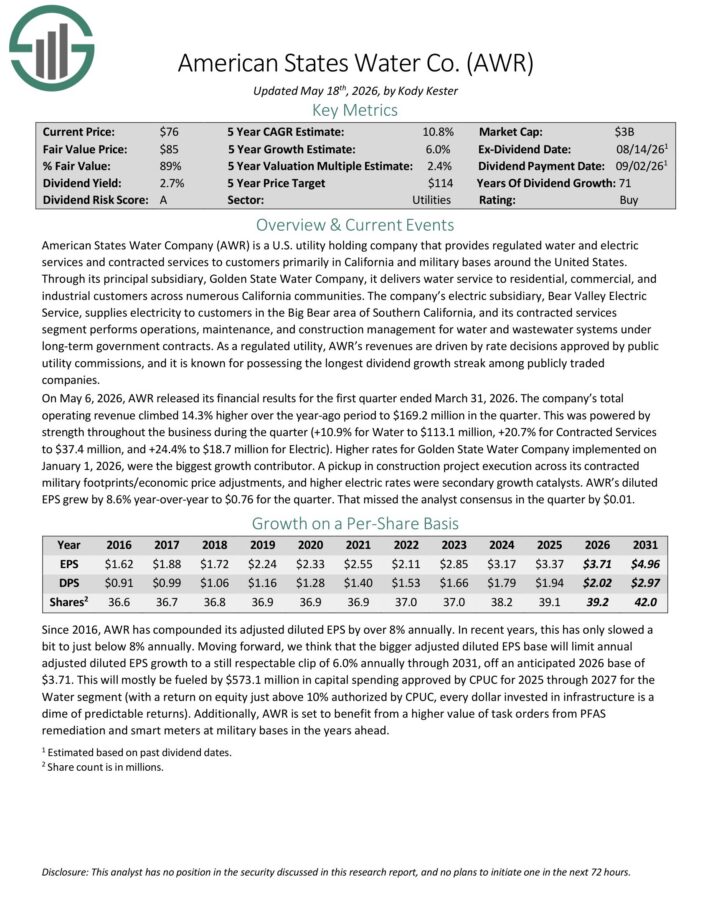
#14: American States Water (AWR)
- 5-year expected annual returns: 10.5%
American States Water Company is a U.S. utility holding company that provides regulated water and electric services and contracted services to customers primarily in California and military bases around the United States.
Through its principal subsidiary, Golden State Water Company, it delivers water service to residential, commercial, and industrial customers across numerous California communities.
The company’s electric subsidiary, Bear Valley Electric Service, supplies electricity to customers in the Big Bear area of Southern California, and its contracted services segment performs operations, maintenance, and construction management for water and wastewater systems under long-term government contracts.
On May 6, 2026, AWR released its financial results for the first quarter ended March 31, 2026. The company’s total operating revenue climbed 14.3% higher over the year-ago period to $169.2 million in the quarter.
This was powered by strength throughout the business during the quarter (+10.9% for Water to $113.1 million, +20.7% for Contracted Services to $37.4 million, and +24.4% to $18.7 million for Electric).
Higher rates for Golden State Water Company implemented on January 1, 2026, were the biggest growth contributor.
AWR’s diluted EPS grew by 8.6% year-over-year to $0.76 for the quarter.
Click here to download our most recent Sure Analysis report on AWR (preview of page 1 of 3 shown below):
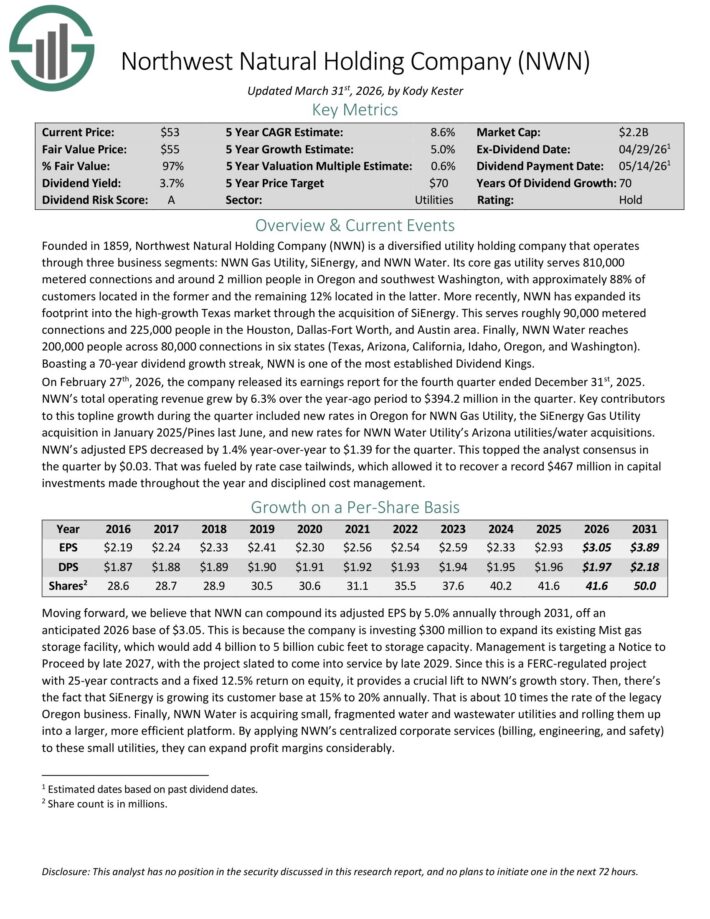
#13: Northwest Natural Holding (NWN)
- 5-year expected annual returns: 10.5%
Northwest Natural Holding Company is a diversified utility holding company that operates through three business segments: NWN Gas Utility, SiEnergy, and NWN Water.
Its core gas utility serves 810,000 metered connections and around 2 million people in Oregon and southwest Washington, with approximately 88% of customers located in the former and the remaining 12% located in the latter.
More recently, NWN has expanded its footprint into the high-growth Texas market through the acquisition of SiEnergy. This serves roughly 90,000 metered connections and 225,000 people in the Houston, Dallas-Fort Worth, and Austin area.
Finally, NWN Water reaches 200,000 people across 80,000 connections in six states (Texas, Arizona, California, Idaho, Oregon, and Washington).
Boasting a 70-year dividend growth streak, NWN is one of the most established Dividend Kings.
On February 27th, 2026, the company released its earnings report for the fourth quarter ended December 31st, 2025. NWN’s total operating revenue grew by 6.3% over the year-ago period to $394.2 million in the quarter.
Key contributors to this topline growth during the quarter included new rates in Oregon for NWN Gas Utility, the SiEnergy Gas Utility acquisition in January 2025/Pines last June, and new rates for NWN Water Utility’s Arizona utilities/water acquisitions.
NWN’s adjusted EPS decreased by 1.4% year-over-year to $1.39 for the quarter.
Click here to download our most recent Sure Analysis report on NWN (preview of page 1 of 3 shown below):
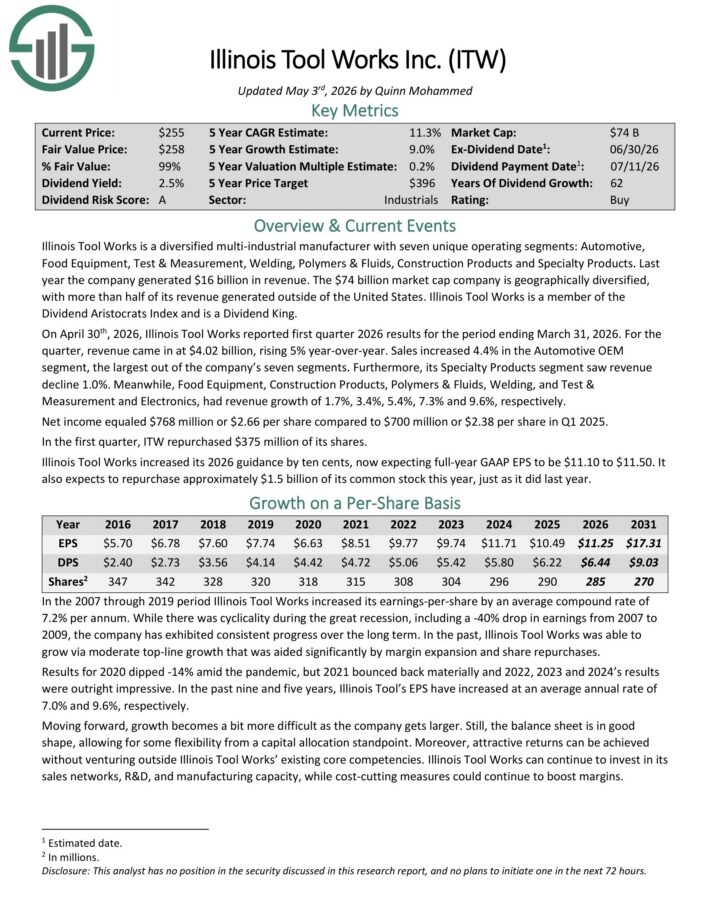
#12: Illinois Tool Works (ITW)
- 5-year expected annual returns: 10.8%
Illinois Tool Works is a diversified multi-industrial manufacturer with seven unique operating segments: Automotive, Food Equipment, Test & Measurement, Welding, Polymers & Fluids, Construction Products and Specialty Products.
Last year the company generated $15.9 billion in revenue. The $72 billion market cap company is geographically diversified, with more than half of its revenue generated outside of the United States.
Illinois Tool Works is a member of the Dividend Aristocrats Index and is a Dividend King.
On April 30th, 2026, Illinois Tool Works reported first quarter 2026 results for the period ending March 31, 2026. For the quarter, revenue came in at $4.02 billion, rising 5% year-over-year.
Sales increased 4.4% in the Automotive OEM segment, the largest out of the company’s seven segments. Furthermore, its Specialty Products segment saw revenue decline 1.0%.
Meanwhile, Food Equipment, Construction Products, Polymers & Fluids, Welding, and Test & Measurement and Electronics, had revenue growth of 1.7%, 3.4%, 5.4%, 7.3% and 9.6%, respectively.
Net income equaled $768 million or $2.66 per share compared to $700 million or $2.38 per share in Q1 2025. In the first quarter, ITW repurchased $375 million of its shares.
Click here to download our most recent Sure Analysis report on ITW (preview of page 1 of 3 shown below):
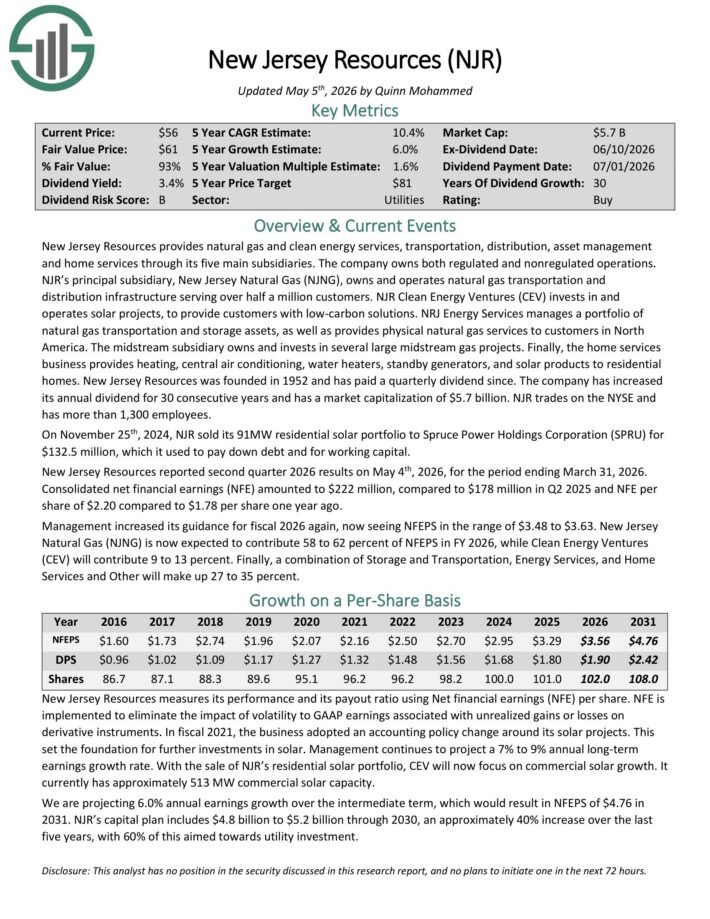
#11: New Jersey Resources (NJR)
- 5-year expected annual returns: 10.9%
New Jersey Resources provides natural gas and clean energy services, transportation, distribution, asset management and home services through its five main subsidiaries.
The company owns both regulated and non-regulated operations. NJR’s principal subsidiary, New Jersey Natural Gas (NJNG), owns and operates natural gas transportation and distribution infrastructure serving over half a million customers.
The company has increased its annual dividend for 30 consecutive years.
New Jersey Resources reported second quarter 2026 results on May 4th, 2026, for the period ending March 31, 2026.
Consolidated net financial earnings (NFE) amounted to $222 million, compared to $178 million in Q2 2025 and NFE per share of $2.20 compared to $1.78 per share one year ago.
Management increased its guidance for fiscal 2026 again, now seeing NFEPS in the range of $3.48 to $3.63.
Click here to download our most recent Sure Analysis report on NJR (preview of page 1 of 3 shown below):
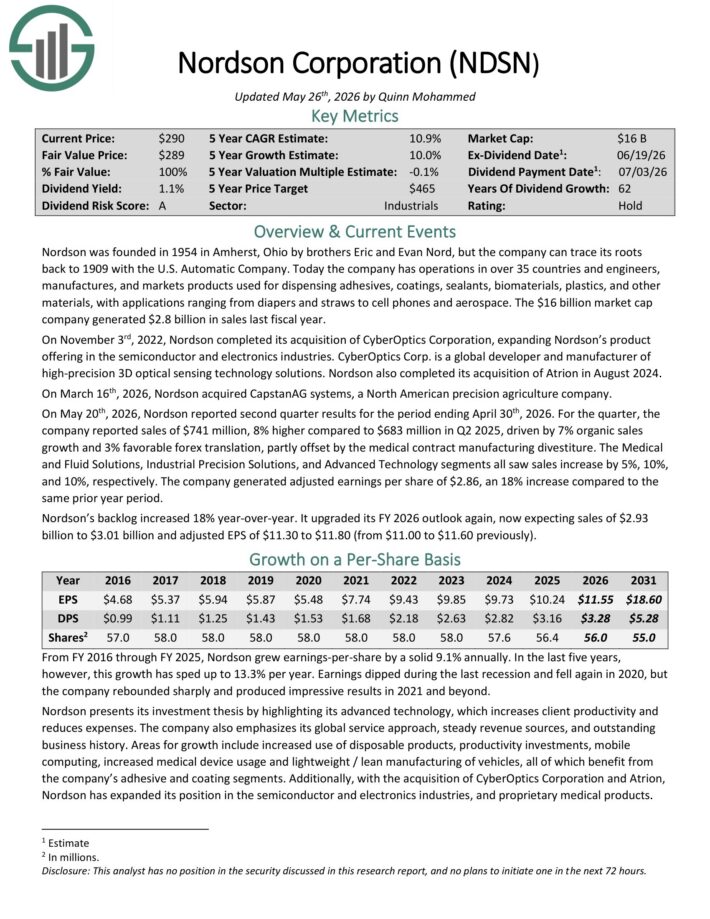
#10: Nordson Corporation (NDSN)
- 5-year expected annual returns: 10.9%
Nordson has operations in over 35 countries and manufactures products used for dispensing adhesives, coatings, sealants, biomaterials, plastics, and other materials.
Applications range from diapers and straws, to cell phones and aerospace. The company generated $2.8 billion in sales last fiscal year.
On May 20th, 2026, Nordson reported second quarter results for the period ending April 30th, 2026. For the quarter, the company reported sales of $741 million, 8% higher compared to $683 million in Q2 2025, driven by 7% organic sales growth and 3% favorable forex translation, partly offset by the medical contract manufacturing divestiture.
The Medical and Fluid Solutions, Industrial Precision Solutions, and Advanced Technology segments all saw sales increase by 5%, 10%, and 10%, respectively.
The company generated adjusted earnings per share of $2.86, an 18% increase compared to the same prior year period.
Nordson’s backlog increased 18% year-over-year. It upgraded its FY 2026 outlook again, now expecting sales of $2.93 billion to $3.01 billion and adjusted EPS of $11.30 to $11.80.
Click here to download our most recent Sure Analysis report on NDSN (preview of page 1 of 3 shown below):
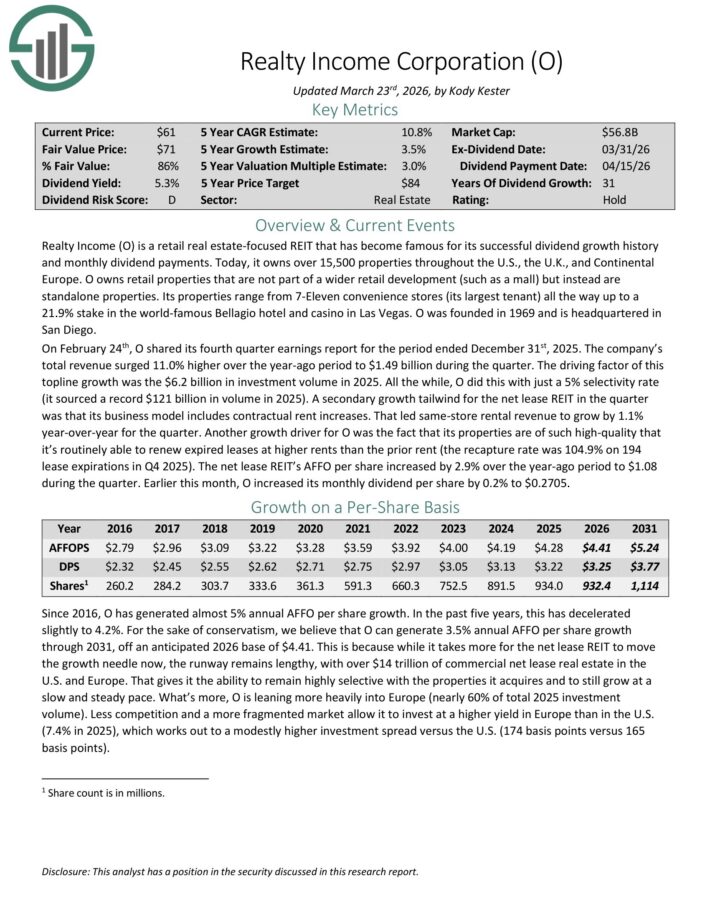
#9: Realty Income (O)
- 5-year expected annual returns: 11.0%
Realty Income is a retail real estate-focused REIT that has become famous for its successful dividend growth history and monthly dividend payments.
Today, it owns over 15,500 properties throughout the U.S., the U.K., and Continental Europe. It owns retail properties that are not part of a wider retail development (such as a mall) but instead are standalone properties.
Its properties range from 7-Eleven convenience stores (its largest tenant) all the way up to a 21.9% stake in the Bellagio hotel and casino in Las Vegas.
On February 24th, O shared its fourth quarter earnings report for the period ended December 31st, 2025. The company’s total revenue surged 11.0% higher over the year-ago period to $1.49 billion during the quarter.
The driving factor of this top-line growth was the $6.2 billion in investment volume in 2025. All the while, the company did this with just a 5% selectivity rate (it sourced a record $121 billion in volume in 2025).
A secondary growth tailwind for the net lease REIT in the quarter was that its business model includes contractual rent increases. That led same-store rental revenue to grow by 1.1% year-over-year for the quarter.
The net lease REIT’s AFFO per share increased by 2.9% over the year-ago period to $1.08 during the quarter.
Click here to download our most recent Sure Analysis report on O (preview of page 1 of 3 shown below):
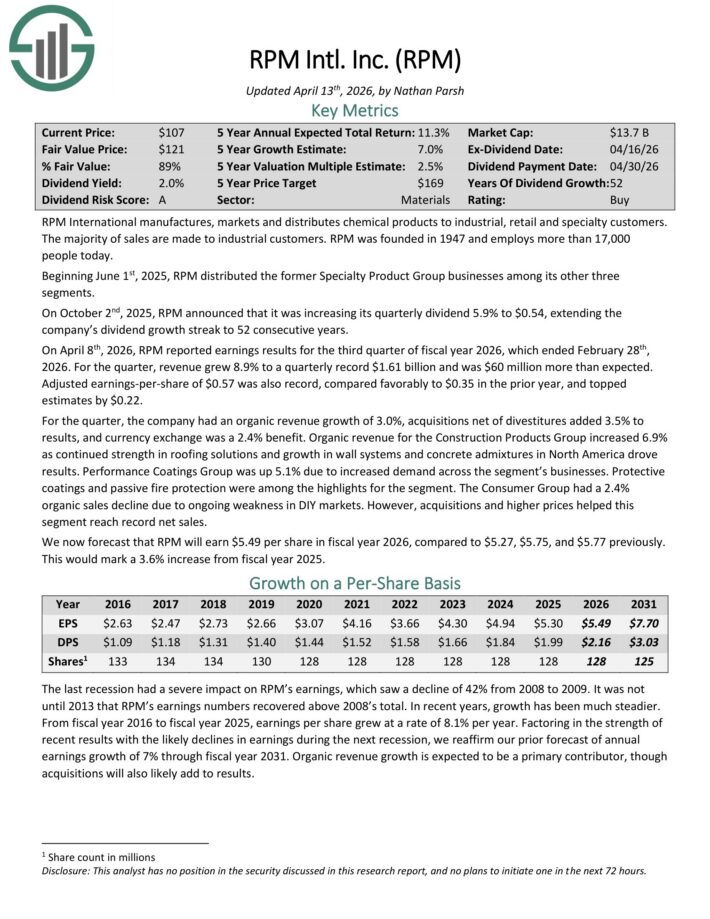
#8: RPM International (RPM)
- 5-year expected annual returns: 11.3%
RPM International manufactures, markets and distributes chemical products to industrial, retail and specialty customers. The majority of sales are made to industrial customers.
On October 2nd, 2025, RPM announced that it was increasing its quarterly dividend 5.9% to $0.54, extending the company’s dividend growth streak to 52 consecutive years.
On April 8th, 2026, RPM reported earnings results for the third quarter of fiscal year 2026. For the quarter, revenue grew 8.9% to a quarterly record $1.61 billion and was $60 million more than expected.
Adjusted earnings-per-share of $0.57 was also record, compared favorably to $0.35 in the prior year, and topped estimates by $0.22.
For the quarter, the company had an organic revenue growth of 3.0%, acquisitions net of divestitures added 3.5% to results, and currency exchange was a 2.4% benefit.
Organic revenue for the Construction Products Group increased 6.9% as continued strength in roofing solutions and growth in wall systems and concrete admixtures in North America drove results.
We now forecast that RPM will earn $5.49 per share in fiscal year 2026. This would mark a 3.6% increase from fiscal year 2025.
Click here to download our most recent Sure Analysis report on RPM (preview of page 1 of 3 shown below):
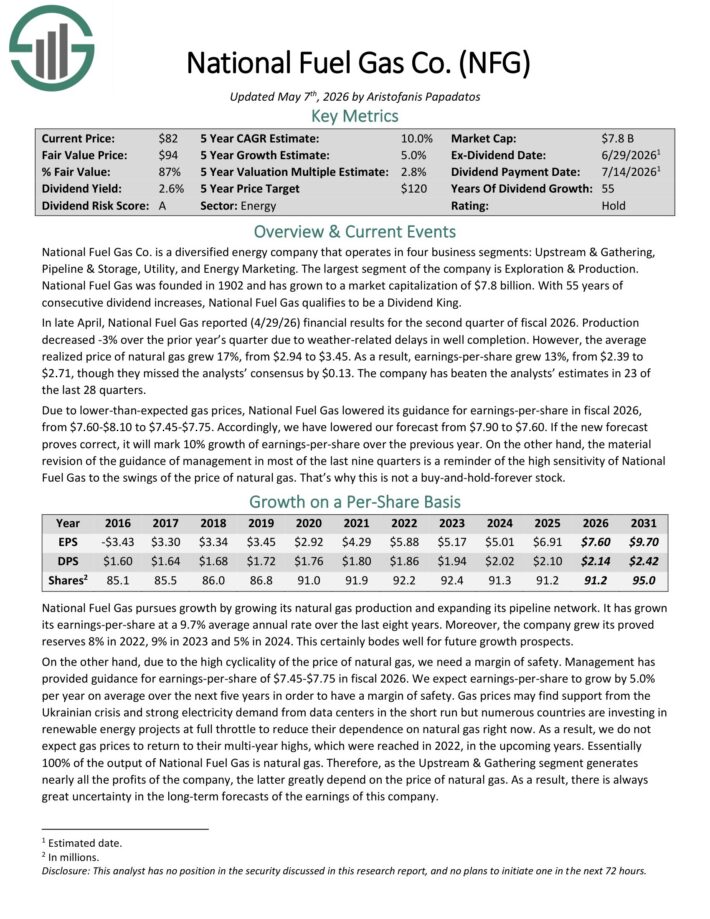
##7: National Fuel Gas (NFG)
- 5-year expected annual returns: 11.6%
National Fuel Gas Co. is a diversified energy company that operates in four business segments: Upstream & Gathering, Pipeline & Storage, Utility, and Energy Marketing.
The largest segment of the company is Exploration & Production. National Fuel Gas was founded in 1902.
In late April, National Fuel Gas reported (4/29/26) financial results for the second quarter of fiscal 2026. Production decreased -3% over the prior year’s quarter due to weather-related delays in well completion.
However, the average realized price of natural gas grew 17%, from $2.94 to $3.45.
As a result, earnings-per-share grew 13%, from $2.39 to $2.71, though they missed the analysts’ consensus by $0.13.
The company has beaten the analysts’ estimates in 23 of the last 28 quarters.
Due to lower-than-expected gas prices, National Fuel Gas lowered its guidance for earnings-per-share in fiscal 2026, from $7.60-$8.10 to $7.45-$7.75. .
Click here to download our most recent Sure Analysis report on NFG (preview of page 1 of 3 shown below):
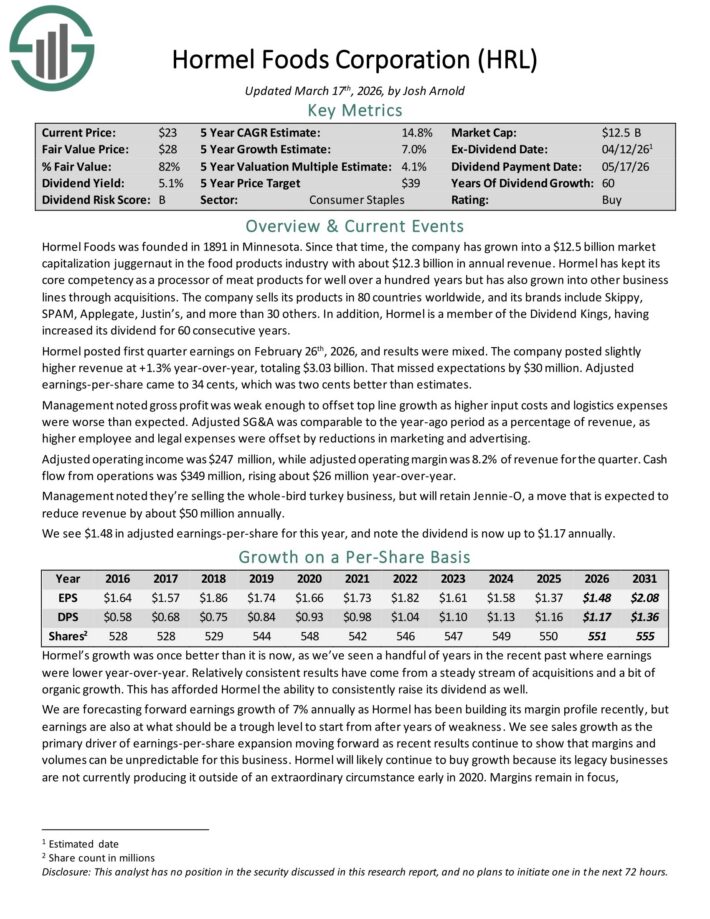
#6: Hormel Foods (HRL)
- 5-year expected annual returns: 12.3%
Hormel Foods was founded in 1891 in Minnesota. Since that time, the company has grown into a juggernaut in the food products industry with about $12.3 billion in annual revenue.
The company sells its products in 80 countries worldwide, and its brands include Skippy, SPAM, Applegate, Justin’s, and more than 30 others.
Hormel posted first quarter earnings on February 26th, 2026, and results were mixed. The company posted slightly higher revenue at +1.3% year-over-year, totaling $3.03 billion. That missed expectations by $30 million.
Adjusted earnings-per-share came to 34 cents, which was two cents better than estimates.
Management noted gross profit was weak enough to offset top line growth as higher input costs and logistics expenses were worse than expected.
Adjusted SG&A was comparable to the year-ago period as a percentage of revenue, as higher employee and legal expenses were offset by reductions in marketing and advertising.
Adjusted operating income was $247 million, while adjusted operating margin was 8.2% of revenue for the quarter. Cash flow from operations was $349 million, rising about $26 million year-over-year.
Click here to download our most recent Sure Analysis report on HRL (preview of page 1 of 3 shown below):
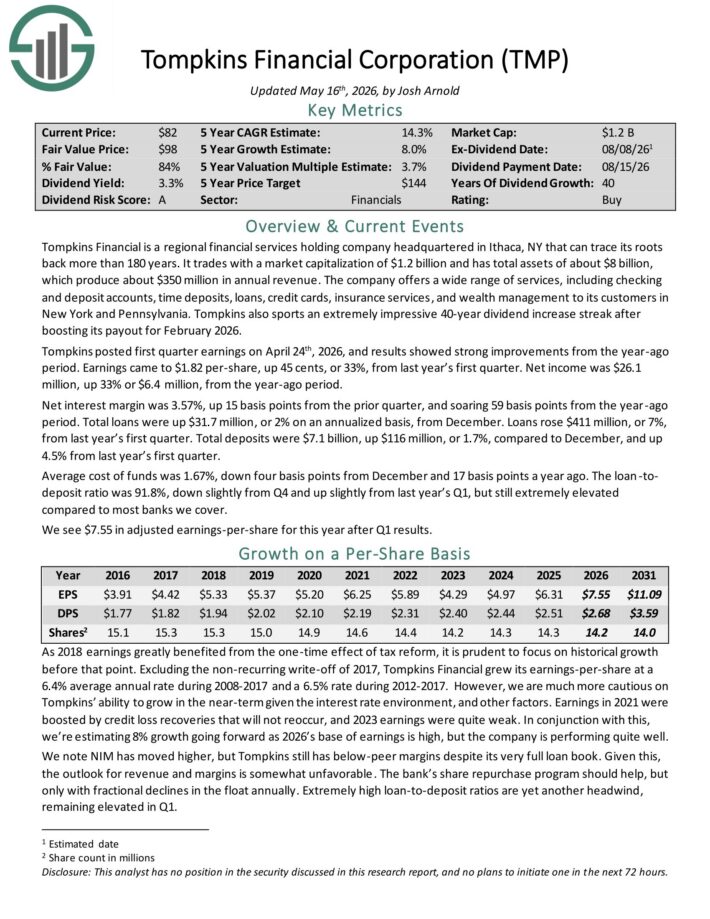
#5: Tompkins Financial (TMP)
- 5-year expected annual returns: 12.7%
Tompkins Financial is a regional financial services holding company headquartered in Ithaca, NY that can trace its roots back more than 180 years. It has total assets of about $8 billion, which produce about $300 million in annual revenue.
The company offers a wide range of services, including checking and deposit accounts, time deposits, loans, credit cards, insurance services, and wealth management to its customers in New York and Pennsylvania.
Tompkins posted first quarter earnings on April 24th, 2026, and results showed strong improvements from the year-ago period.
Earnings came to $1.82 per-share, up 45 cents, or 33%, from last year’s first quarter. Net income was $26.1 million, up 33% or $6.4 million, from the year-ago period.
Net interest margin was 3.57%, up 15 basis points from the prior quarter, and soaring 59 basis points from the year-ago period. Total loans were up $31.7 million, or 2% on an annualized basis, from December.
Loans rose $411 million, or 7%, from last year’s first quarter. Total deposits were $7.1 billion, up $116 million, or 1.7%, compared to December, and up 4.5% from last year’s first quarter.
Average cost of funds was 1.67%, down four basis points from December and 17 basis points a year ago. The loan-to deposit ratio was 91.8%, down slightly from Q4 and up slightly from last year’s Q1, but still extremely elevated compared to most banks we cover.
Click here to download our most recent Sure Analysis report on TMP (preview of page 1 of 3 shown below):
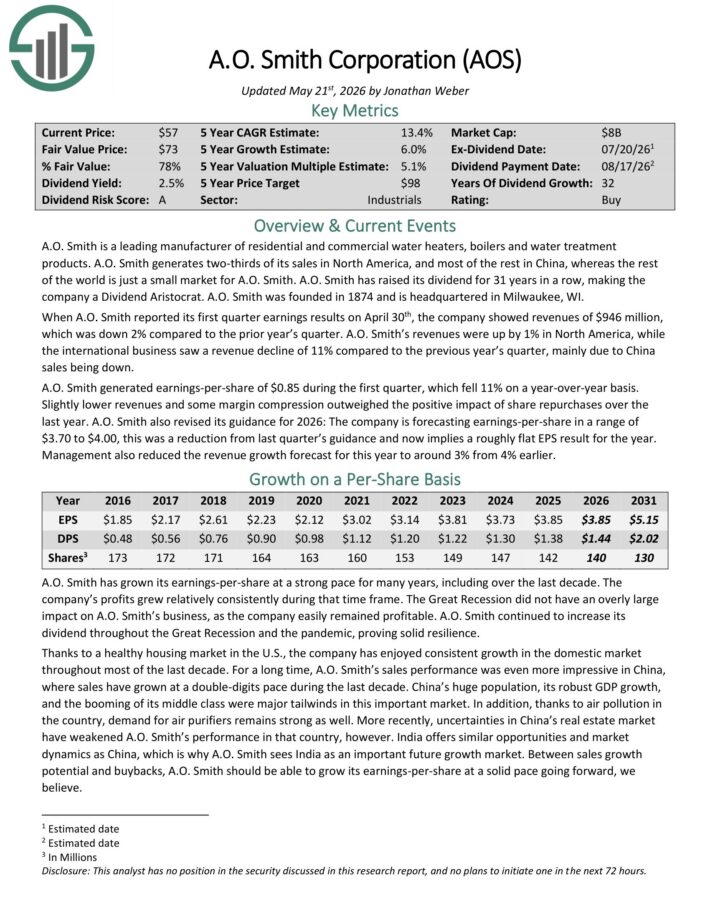
#4: A.O. Smith (AOS)
- 5-year expected annual returns: 12.9%
A.O. Smith is a leading manufacturer of residential and commercial water heaters, boilers and water treatment
products. It generates two-thirds of its sales in North America, and most of the rest in China.
A.O. Smith has raised its dividend for over 30 years in a row, making the company a Dividend Aristocrat. The company was founded in 1874 and is headquartered in Milwaukee, WI.
When A.O. Smith reported its first quarter earnings results on April 30th, the company showed revenues of $946 million, which was down 2% compared to the prior year’s quarter.
Revenues were up by 1% in North America, while the international business saw a revenue decline of 11% compared to the previous year’s quarter, mainly due to China sales being down.
A.O. Smith generated earnings-per-share of $0.85 during the first quarter, which fell 11% on a year-over-year basis.
Slightly lower revenues and some margin compression outweighed the positive impact of share repurchases over the last year.
A.O. Smith also revised its guidance for 2026. The company is forecasting earnings-per-share in a range of $3.70 to $4.00, and now implies a roughly flat EPS result for the year.
Management also reduced the revenue growth forecast for this year to around 3% from 4% earlier.
Click here to download our most recent Sure Analysis report on AOS (preview of page 1 of 3 shown below):
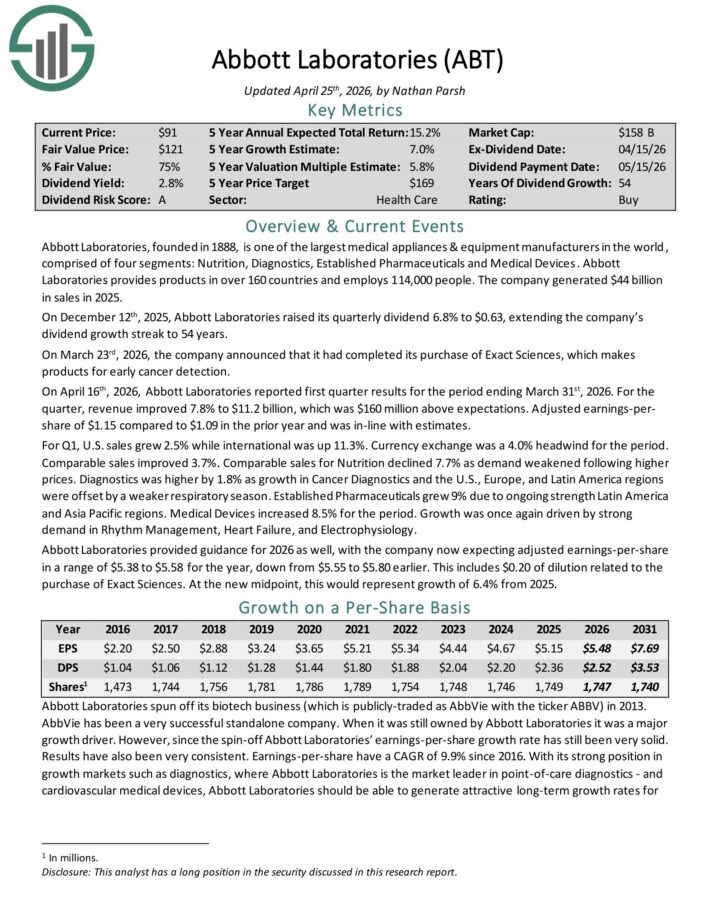
#3: Abbott Laboratories (ABT)
- 5-year expected annual returns: 15.9%
Abbott Laboratories, founded in 1888, is one of the largest medical appliances & equipment manufacturers in the world, comprised of four segments: Nutrition, Diagnostics, Established Pharmaceuticals and Medical Devices.
Abbott Laboratories provides products in over 160 countries and employs 114,000 people. The company generated $44 billion in sales in 2025.
On December 12th, 2025, Abbott Laboratories raised its quarterly dividend 6.8% to $0.63, extending the company’s dividend growth streak to 54 years.
On April 16th, 2026, Abbott Laboratories reported first quarter results for the period ending March 31st, 2026. For the quarter, revenue improved 7.8% to $11.2 billion, which was $160 million above expectations. Adjusted earnings-per-share of $1.15 compared to $1.09 in the prior year and was in-line with estimates.
For Q1, U.S. sales grew 2.5% while international was up 11.3%. Currency exchange was a 4.0% headwind for the period.
Comparable sales improved 3.7%. Comparable sales for Nutrition declined 7.7% as demand weakened following higher prices.
Abbott Laboratories provided guidance for 2026 as well, with the company now expecting adjusted earnings-per-share in a range of $5.38 to $5.58 for the year, down from $5.55 to $5.80 earlier.
At the new midpoint, this would represent growth of 6.4% from 2025.
Click here to download our most recent Sure Analysis report on ABT (preview of page 1 of 3 shown below):
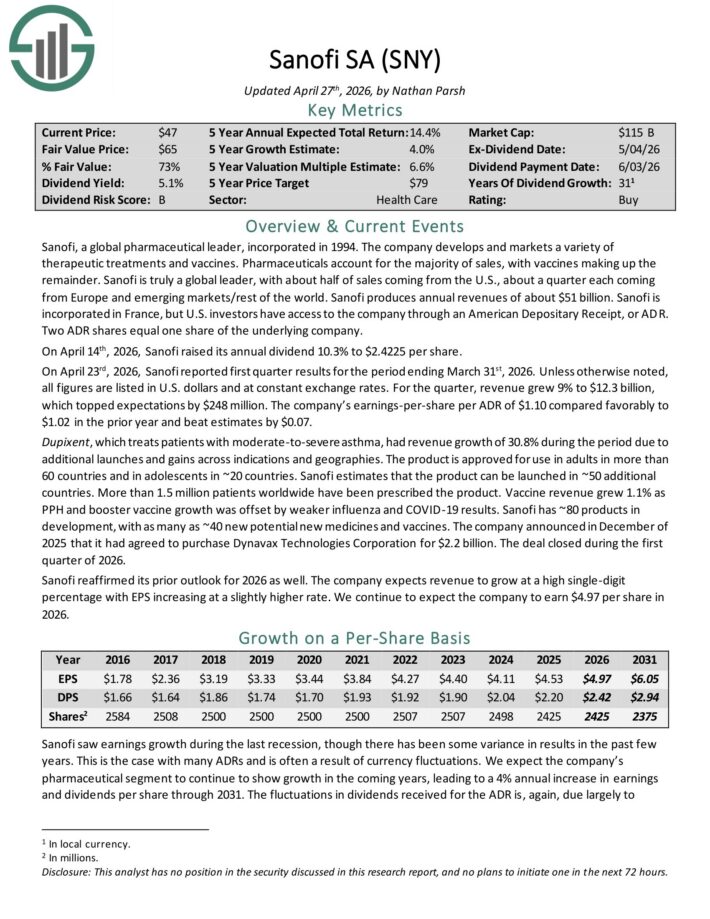
#2: Sanofi (SNY)
- 5-year expected annual returns: 16.8%
Sanofi is a global pharmaceutical leader that develops a variety of therapeutic treatments and vaccines.
Pharmaceuticals account for the majority of sales, with vaccines making up the remainder. Sanofi produces annual revenues of about $51 billion.
Sanofi is incorporated in France, but U.S. investors have access to the company through an American Depositary Receipt, or ADR. Two ADR shares equal one share of the underlying company.
On April 14th, 2026, Sanofi raised its annual dividend 10.3% to $2.4225 per share.
On April 23rd, 2026, Sanofi reported first quarter results for the period ending March 31st, 2026. For the quarter, revenue grew 9% to $12.3 billion, which topped expectations by $248 million.
Earnings-per-share per ADR of $1.10 compared favorably to $1.02 in the prior year and beat estimates by $0.07.
Dupixent, which treats patients with moderate-to-severe asthma, had revenue growth of 30.8% during the period due to additional launches and gains across indications and geographies.
The product is approved for use in adults in more than 60 countries and in adolescents in ~20 countries. Sanofi estimates that the product can be launched in ~50 additional countries.
Click here to download our most recent Sure Analysis report on SNY (preview of page 1 of 3 shown below):
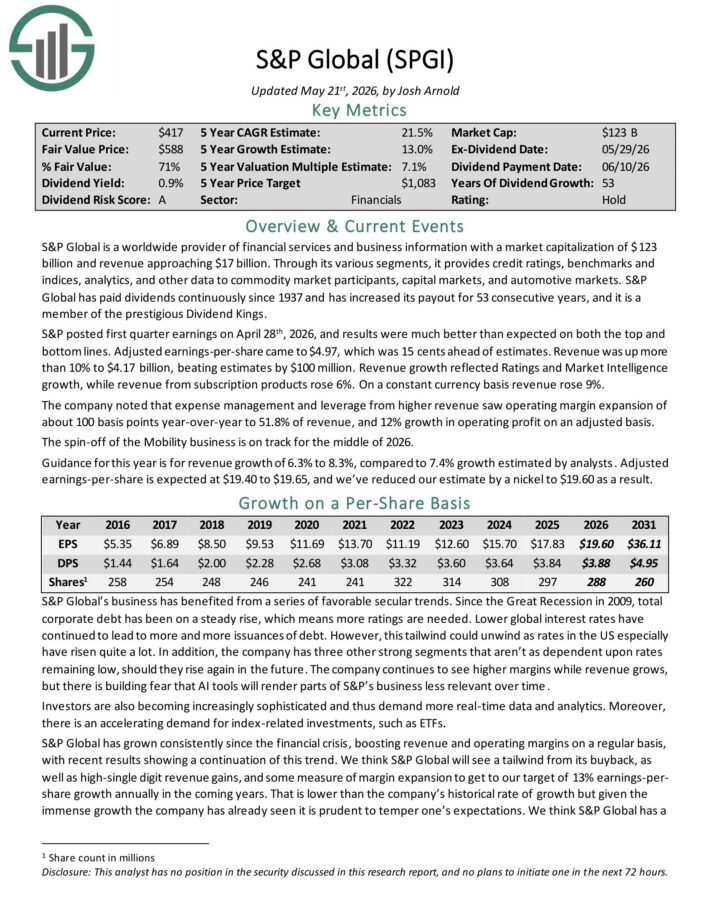
#1: S&P Global (SPGI)
- 5-year expected annual returns: 21.4%
S&P Global is a worldwide provider of financial services and business information with revenue of about $16.5 billion.
Through its various segments, it provides credit ratings, benchmarks and indices, analytics, and other data to commodity market participants, capital markets, and automotive markets.
S&P Global has paid dividends continuously since 1937 and has increased its payout for 53 consecutive years.
S&P posted first quarter earnings on April 28th, 2026, and results were much better than expected on both the top and bottom lines. Adjusted earnings-per-share came to $4.97, which was 15 cents ahead of estimates.
Revenue was up more than 10% to $4.17 billion, beating estimates by $100 million. Revenue growth reflected Ratings and Market Intelligence growth, while revenue from subscription products rose 6%. On a constant currency basis revenue rose 9%.
The company noted that expense management and leverage from higher revenue saw operating margin expansion of about 100 basis points year-over-year to 51.8% of revenue, and 12% growth in operating profit on an adjusted basis.
The spin-off of the Mobility business is on track for the middle of 2026.
Guidance for this year is for revenue growth of 6.3% to 8.3%.
Click here to download our most recent Sure Analysis report on SPGI (preview of page 1 of 3 shown below):
Final Thoughts and Additional Resources
Enrolling in DRIP stocks can be a great way to compound your portfolio income over time. Additional resources are listed below for investors interested in further research for DRIP stocks.
For dividend growth investors interested in DRIP stocks, the 15 companies mentioned in this article are a great place to start. Each business is very shareholder friendly, as evidenced by their long dividend histories and their willingness to offer investors no-fee DRIP stocks.
At Sure Dividend, we often advocate for investing in companies with a high probability of increasing their dividends each and every year.
If that strategy appeals to you, it may be useful to browse through the following databases of dividend growth stocks:
- The Dividend Kings List is even more exclusive than the Dividend Aristocrats. It is comprised of 58 stocks with 50+ years of consecutive dividend increases.
- The High Dividend Stocks List: stocks that appeal to investors interested in the highest yields of 5% or more.
- The Monthly Dividend Stocks List: stocks that pay dividends every month, for 12 dividend payments per year.