Updated on February 26th, 2026 by Nathan Parsh
Each year, we publish an in-depth look at each of the Dividend Aristocrats, an exclusive list of stocks in the S&P 500 Index with 25+ years of consecutive dividend increases. There are just 69 Dividend Aristocrats in the entire S&P 500 Index, indicating difficulty in reaching 25 consecutive annual dividend increases.
To join the Dividend Aristocrats list, a company must have competitive advantages and the ability to increase its dividend each year, even during recessions. As a result, Dividend Aristocrats are an excellent source of dividend growth stocks.
With this in mind, we created a list of all 69 Dividend Aristocrats, with important metrics such as dividend yields and price-to-earnings ratios. You can see the full list of all 69 Dividend Aristocrats by clicking on the link below:

Disclaimer: Sure Dividend is not affiliated with S&P Global in any way. S&P Global owns and maintains The Dividend Aristocrats Index. The information in this article and downloadable spreadsheet is based on Sure Dividend’s own review, summary, and analysis of the S&P 500 Dividend Aristocrats ETF (NOBL) and other sources, and is meant to help individual investors better understand this ETF and the index upon which it is based. None of the information in this article or spreadsheet is official data from S&P Global. Consult S&P Global for official information.
Up next in our annual Dividend Aristocrats In Focus series is S&P Global Inc. (SPGI).
S&P Global has an impressive dividend track record. It has paid a dividend every year since 1937 and raised its dividend for 53 years in a row.
This article will look closely at S&P Global and what makes it such a high-quality dividend growth stock.
Business Overview
S&P Global traces its roots back to 1917 when McGraw Publishing Company and the Hill Publishing Company came together. The company was first named McGraw Hill Financial. In 1957, McGraw Hill introduced the S&P 500, the most widely-recognized index of all large-cap U.S. stocks.
S&P Global offers financial services to the global capital and commodity markets, including credit ratings, benchmarks, analytics, and data. It derives revenue from four operating segments: Ratings, Market Intelligence, Platt’s, and S&P Dow Jones Indices. S&P Global has a highly profitable business model. It is the industry leader in credit ratings and stock market indexes, providing high-profit margins and growth opportunities.
S&P Global has a very strong business model. Today, the S&P 500 is arguably the world’s most widely-known stock market index.
S&P Global benefits from a strong secular trend, namely the steadily growing amount of global debt. This trend has markedly accelerated in the last three years, as nearly all the countries have issued unprecedented amounts of debt in response to the pandemic. Expectations for global debt refinancing are very high in the coming years.
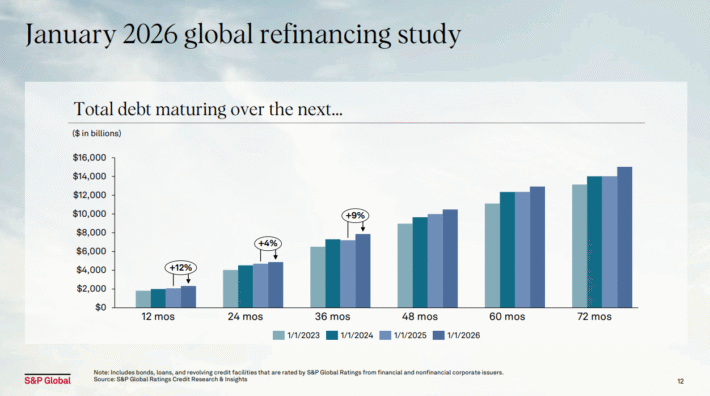
Source: Investor Presentation
In addition, numerous companies have come under pressure, and thus they have issued appreciable amounts of debt. This is a strong tailwind for the business of S&P Global, which has enjoyed a steep increase in its number of debt ratings.
The strength of the business model of S&P Global has been on full display in recent years.
Growth Prospects
S&P Global has exhibited an impressive performance record. It had grown its earnings per share yearly for more than a decade, except for 2022, when the company took a breather due to blowout earnings in previous years.
The exceptional growth rate combined with consistent performance are testaments to the strength of S&P Global’s business model and reliable growth trajectory.
S&P reported fourth quarter and full-year earnings on February 10th, 2026, and results were mixed.
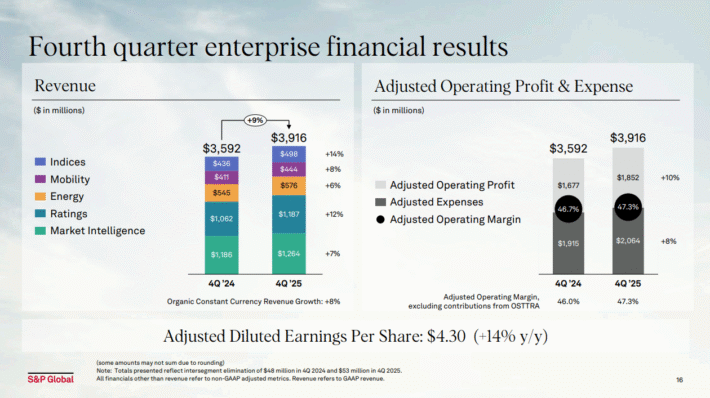
Source: Investor Presentation
For the quarter revenue grew 9.2% year-over-year to $3.92 billion, which was $10 million better than expected. Earnings, however, came to $4.30 per share on an adjusted basis, missing estimates by $0.04.
Management noted top line growth was strong in all divisions, as revenue from subscription products rose 8% year-over-year. Earnings were off from $4.73 per share in Q3, but higher year-over-year from $3.77 in last year’s Q4.
Expenses were $2.51 billion, much higher from Q3 and the year-ago period, which were $2.22 billion and $2.33 billion, respectively. Still, that was good enough for operating margin to expand to 47.3% of revenue from 43.6% a year earlier.
For 2026, the company expects a midpoint of $19.53 in earnings-per-share, which was below consensus of $19.96. However, this would be a 10% increase from 2025. Shares were sharply lower following the announcement as a result.
Competitive Advantages & Recession Performance
S&P Global enjoys multiple competitive advantages. First, it operates in a highly concentrated industry. It is one of only three major credit rating agencies in the U.S., along with Moody’s (MCO) and Fitch Ratings.
Put together, these three companies control over 90% of the global financial debt rating industry, with S&P Global on top. Moreover, there are high barriers to entry in this industry. Specifically, becoming an accepted rating agency would require a great deal of trust from the financial industry and government, which is hard to build quickly, if at all.
Clients pay S&P Global hefty sums for investment research, as S&P Global has built a strong reputation over its many decades of business. These competitive advantages helped the company remain consistently profitable throughout the Great Recession:
- 2007 earnings-per-share of $2.94
- 2008 earnings-per-share of $2.51 (15% decline)
- 2009 earnings-per-share of $2.33 (7% decline)
- 2010 earnings-per-share of $2.65 (14% increase)
S&P Global’s earnings declined in 2008 and 2009, as investors should expect during recessions. A global recession will naturally result in lower demand for financial services as investors exit the markets. With that said, S&P Global quickly bounced back after the recession ended. By 2011, earnings-per-share had hit a new post-recession high.
Valuation & Expected Returns
Based on the expected earnings per share of $19.65 for 2026, the stock has a price-to-earnings ratio of 22.1. S&P Global’s 5-year average price-to-earnings ratio is 31.1, so we are assuming a fair price-to-earnings ratio of 30 times, given the sustained, outstanding performance the company has produced.
If shares were to retreat to a price-to-earnings ratio of 30 over the next five years, investors would see a 6.3% tailwind from multiple expansion over this period. Thanks to its exceptional performance record and consistent performance, S&P Global has almost always traded with a premium valuation, though that is not the case today.
The stock also has a current dividend yield of 0.9%. The dividend is highly secure, with a payout ratio of only 20%.
A potential bull-case breakdown of future returns is as follows:
- 12% earnings-per-share growth
- 6.3% valuation headwind
- 0.7% dividend yield
Total returns could reach 19.5% per year through 2031. While enticing, we rate shares as a hold.
Final Thoughts
S&P Global is a strong business with a long growth runway ahead. There will always be a need for financial rating services while future growth potential is strong in new areas as well, such as data and financial technology. S&P Global will accelerate its growth in these segments via acquisitions.
The dividend yield of 0.9% might not be attractive to income investors, as it trails the S&P 500 current yield of 1.1%, but dividend growth investors should view the stock more favorably.
S&P Global receives a hold recommendation at the current price.
Additionally, the following Sure Dividend databases contain the most reliable dividend growers in our investment universe:
- The Dividend Contenders List: 10-24 consecutive years of dividend increases.
- The Dividend Challengers List: 5-9 consecutive years of dividend increases.
- The Dividend Champions: Dividend stocks with 25+ years of dividend increases, including those that may not qualify as Dividend Aristocrats.
- The Dividend Achievers: dividend stocks with 10+ years of consecutive dividend increases.
- The Dividend Kings: considered to be the ultimate dividend growth stocks, the Dividend Kings list is comprised of stocks with 50+ years of consecutive dividend increases
If you’re looking for stocks with unique dividend characteristics, consider the following Sure Dividend databases:
- The Complete List of Monthly Dividend Stocks: stocks that pay dividends each month, for 12 payments over the year.
- The Blue Chip Stocks List: this database contains stocks that qualify as either Dividend Achievers, Dividend Aristocrats, or Dividend Kings.