Updated on September 29th, 2025 by Bob Ciura
Spreadsheet data updated daily
Micro-cap stocks are publicly-traded companies with market capitalizations between $50 million and $300 million.
These represent the smallest companies in the stock market.
The total number of micro-cap stocks varies depending upon market conditions. Right now there are hundreds of micro-cap stocks, so there are plenty for investors to choose from.
As the smallest stocks, micro-caps could have stronger growth potential over the long run than large-cap stocks or mega-cap stocks.
At the same time, micro-cap stocks carry a number of unique risk factors to consider.
You can download a free spreadsheet of 800+ micro cap stocks right now (along with important financial metrics such as price-to-earnings ratios and dividend yields) by clicking on the link below:

The downloadable micro-cap stocks list above was curated from two leading micro-cap stock ETFs:
- iShares Micro-Cap ETF (IWC)
- First Trust Dow Jones Select Micro-Cap Index Fund (FDM)
This article includes a spreadsheet and table of all of our micro-cap stocks, as well as detailed analysis on our Top 10 micro-cap stocks today.
Keep reading to see the 10 best micro-cap stocks analyzed in detail.
The 10 Best Micro Cap Stocks Today
Now that we’ve defined what a micro-cap stock is, let’s take a look at the 10 best micro-cap stocks, as defined by our Sure Analysis Research Database.
The database ranks total expected annual returns, combining current yield, forecast earnings growth and any change in price from the valuation.
Note: The Sure Analysis Research Database is focused on income producing securities. As a result, we do not track or rank securities that don’t pay dividends. Micro-cap stocks that don’t pay dividends were excluded from the Top 10 rankings below.
We’ve screened the micro-cap stocks with the highest 5-year expected returns and have provided them below, ranked from lowest to highest.
You can instantly jump to any individual stock analysis by using the links below:
- Micro Cap Stock #10: LCNB Corp. (LCNB)
- Micro Cap Stock #9: Eagle Bancorp Montana (EBMT)
- Micro Cap Stock #8: Oxford Square Capital (OXSQ)
- Micro Cap Stock #7: Norwood Financial (NWFL)
- Micro Cap Stock #6: Alpine Income Property Trust (PINE)
- Micro Cap Stock #5: Silvercrest Asset Management Group (SAMG)
- Micro Cap Stock #4: Clipper Realty (CLPR)
- Micro Cap Stock #3: RCI Hospitality Holdings (RICK)
- Micro Cap Stock #2: Horizon Technology Finance (HRZN)
- Micro Cap Stock #1: Ellington Credit Co. (EARN)
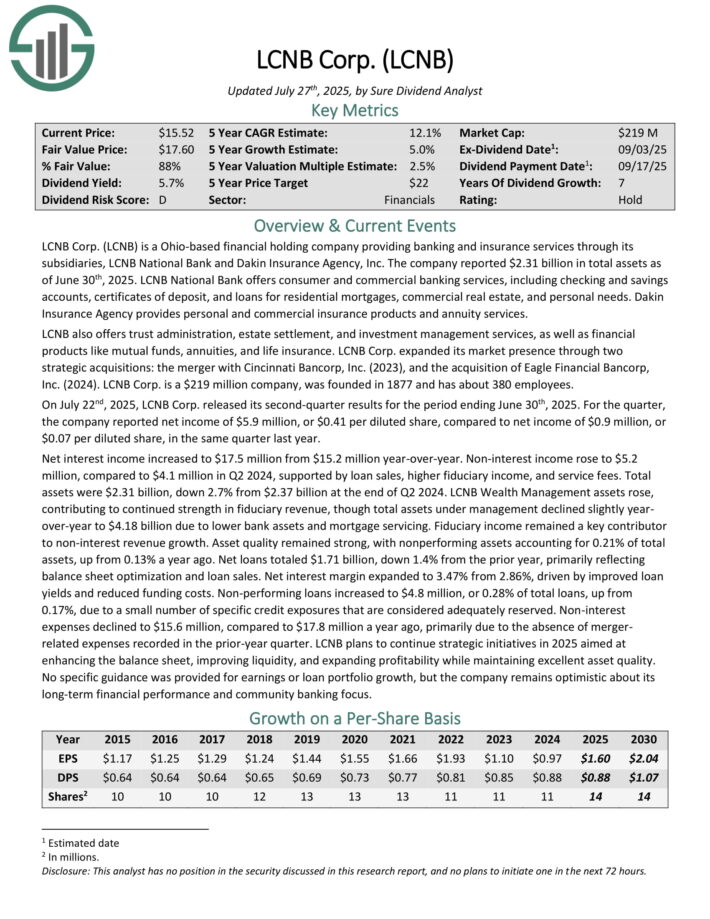
Micro Cap Stock #10: LCNB Corp. (LCNB)
- 5-year expected annual returns: 12.0%
LCNB Corp. is a Ohio-based financial holding company providing banking and insurance services through its subsidiaries, LCNB National Bank and Dakin Insurance Agency, Inc.
The company reported $2.31 billion in total assets as of June 30th, 2025. LCNB National Bank offers consumer and commercial banking services, including checking and savings accounts, certificates of deposit, and loans for residential mortgages, commercial real estate, and personal needs.
Dakin Insurance Agency provides personal and commercial insurance products and annuity services. LCNB also offers trust administration, estate settlement, and investment management services, as well as financial products like mutual funds, annuities, and life insurance.
On July 22nd, 2025, LCNB Corp. released its second-quarter results for the period ending June 30th, 2025. For the quarter, the company reported net income of $5.9 million, or $0.41 per diluted share, compared to net income of $0.9 million, or $0.07 per diluted share, in the same quarter last year.
Net interest income increased to $17.5 million from $15.2 million year-over-year. Non-interest income rose to $5.2 million, compared to $4.1 million in Q2 2024, supported by loan sales, higher fiduciary income, and service fees. Total assets were $2.31 billion, down 2.7% from $2.37 billion at the end of Q2 2024.
Asset quality remained strong, with nonperforming assets accounting for 0.21% of total assets, up from 0.13% a year ago.
LCNB plans to continue strategic initiatives in 2025 aimed at enhancing the balance sheet, improving liquidity, and expanding profitability while maintaining excellent asset quality.
Click here to download our most recent Sure Analysis report on LCNB (preview of page 1 of 3 shown below):
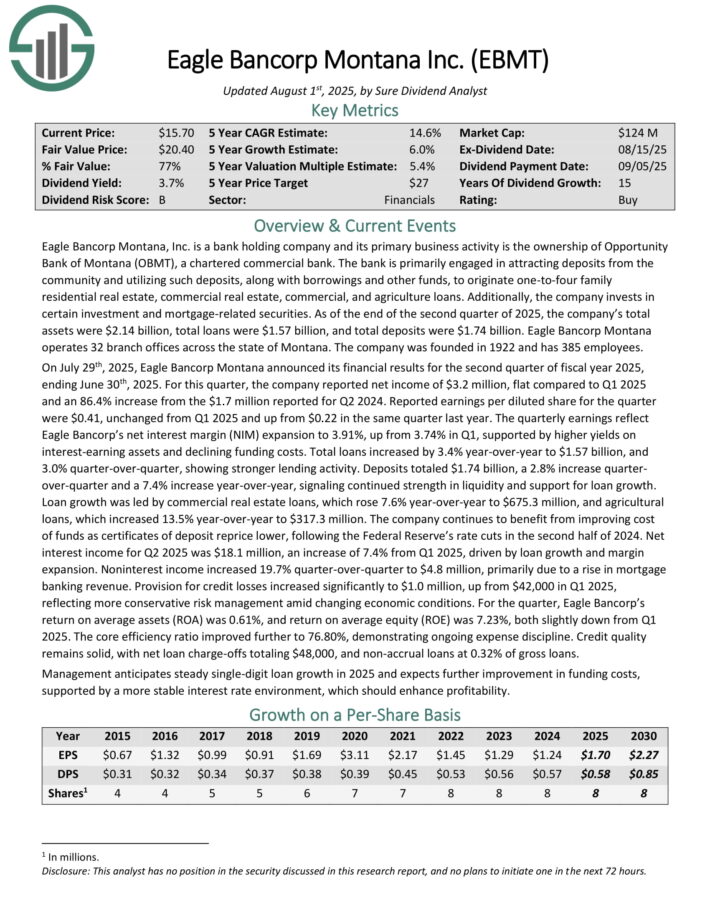
Micro Cap Stock #9: Eagle Bancorp Montana (EBMT)
- 5-year expected annual returns: 12.2%
Eagle Bancorp Montana, Inc. is a bank holding company and its primary business activity is the ownership of Opportunity Bank of Montana (OBMT), a chartered commercial bank.
As of the end of the second quarter of 2025, the company’s total assets were $2.14 billion, total loans were $1.57 billion, and total deposits were $1.74 billion. Eagle Bancorp Montana operates 32 branch offices across the state of Montana. The company was founded in 1922 and has 385 employees.
On July 29th, 2025, Eagle Bancorp Montana announced its financial results for the second quarter of fiscal year 2025, ending June 30th, 2025. For this quarter, the company reported net income of $3.2 million, flat compared to Q1 2025
and an 86.4% increase from the $1.7 million reported for Q2 2024.
The quarterly earnings reflect Eagle Bancorp’s net interest margin (NIM) expansion to 3.91%, up from 3.74% in Q1, supported by higher yields on interest-earning assets and declining funding costs. Total loans increased by 3.4% year-over-year to $1.57 billion, and 3.0% quarter-over-quarter, showing stronger lending activity.
Deposits totaled $1.74 billion, a 2.8% increase quarter-over-quarter and a 7.4% increase year-over-year, signaling continued strength in liquidity and support for loan growth. Loan growth was led by commercial real estate loans, which rose 7.6% year-over-year to $675.3 million, and agricultural loans, which increased 13.5% year-over-year to $317.3 million.
Provision for credit losses increased significantly to $1.0 million, up from $42,000 in Q1 2025, reflecting more conservative risk management amid changing economic conditions. For the quarter, Eagle Bancorp’s return on average assets (ROA) was 0.61%, and return on average equity (ROE) was 7.23%, both slightly down from Q1 2025.
Management anticipates steady single-digit loan growth in 2025 and expects further improvement in funding costs, supported by a more stable interest rate environment, which should enhance profitability.
Click here to download our most recent Sure Analysis report on EBMT (preview of page 1 of 3 shown below):
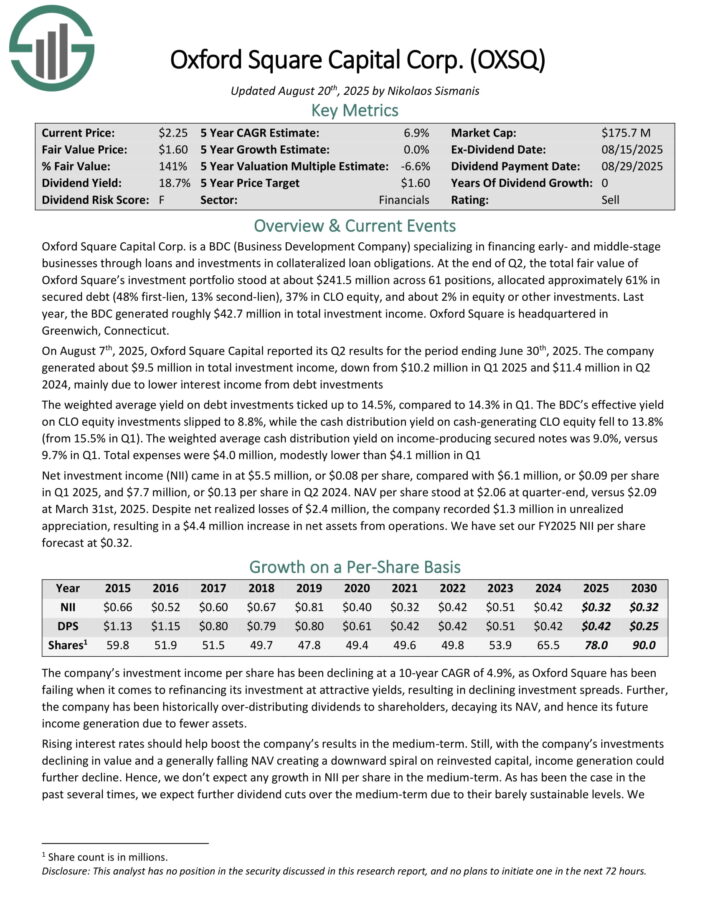
Micro Cap Stock #8: Oxford Square Capital (OXSQ)
- 5-year expected annual returns: 13.0%
Oxford Square Capital Corp. is a BDC (Business Development Company) specializing in financing early- and middle-stage businesses through loans and investments in collateralized loan obligations.
At the end of last quarter, the total fair value of Oxford Square’s investment portfolio stood at about $243.2 million across 61 positions, allocated approximately 61% in secured debt (48% first-lien, 13% second-lien), 38% in CLO equity, and about 1% in equity or other investments. Last year, the BDC generated roughly $42.7 million in total investment income.
On August 7th, 2025, Oxford Square Capital reported its Q2 results for the period ending June 30th, 2025. The company generated about $9.5 million in total investment income, down from $10.2 million in Q1 2025 and $11.4 million in Q2 2024, mainly due to lower interest income from debt investments.
The weighted average yield on debt investments ticked up to 14.5%, compared to 14.3% in Q1. The BDC’s effective yield on CLO equity investments slipped to 8.8%, while the cash distribution yield on cash-generating CLO equity fell to 13.8% (from 15.5% in Q1).
The weighted average cash distribution yield on income-producing secured notes was 9.0%, versus 9.7% in Q1. Total expenses were $4.0 million, modestly lower than $4.1 million in Q1.
Net investment income (NII) came in at $5.5 million, or $0.08 per share, compared with $6.1 million, or $0.09 per share in Q1 2025, and $7.7 million, or $0.13 per share in Q2 2024.
Click here to download our most recent Sure Analysis report on OXSQ (preview of page 1 of 3 shown below):
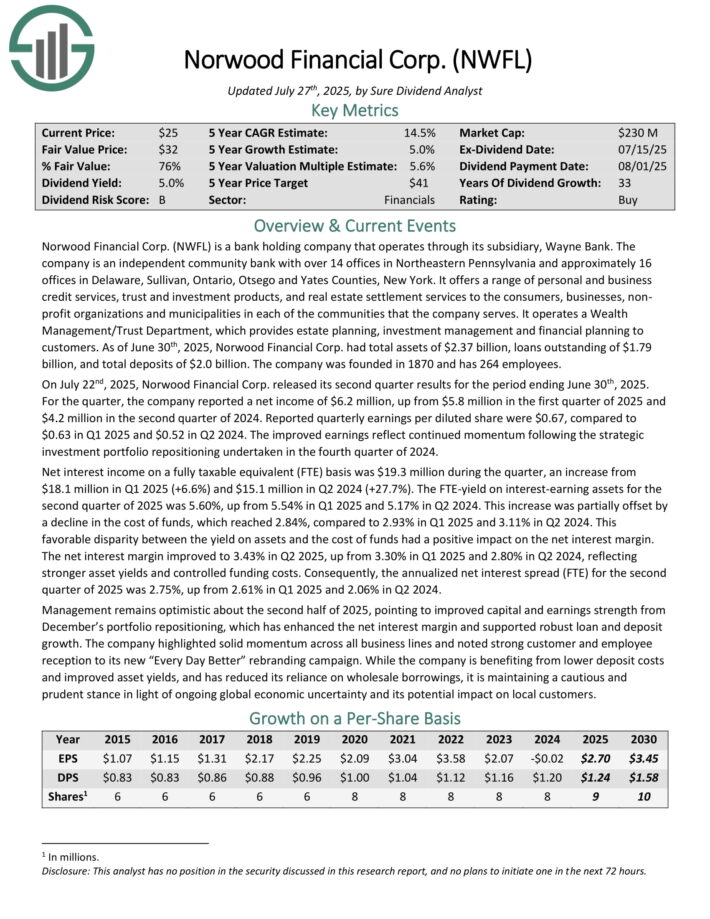
Micro Cap Stock #7: Norwood Financial (NWFL)
- 5-year expected annual returns: 13.2%
Norwood Financial Corp. (NWFL) is a bank holding company that operates through its subsidiary, Wayne Bank. The company is an independent community bank with over 14 offices in Northeastern Pennsylvania and approximately 16 offices in Delaware, Sullivan, Ontario, Otsego and Yates Counties, New York.
It offers a range of personal and business credit services, trust and investment products, and real estate settlement services to the consumers, businesses, nonprofit organizations and municipalities in each of the communities that the company serves. It operates a Wealth Management/Trust Department, which provides estate planning, investment management and financial planning to customers.
As of June 30th, 2025, Norwood Financial Corp. had total assets of $2.37 billion, loans outstanding of $1.79 billion, and total deposits of $2.0 billion. The company was founded in 1870 and has 264 employees.
On July 22nd, 2025, Norwood Financial Corp. released its second quarter results for the period ending June 30th, 2025. For the quarter, the company reported a net income of $6.2 million, up from $5.8 million in the first quarter of 2025 and $4.2 million in the second quarter of 2024.
Reported quarterly earnings per diluted share were $0.67, compared to $0.63 in Q1 2025 and $0.52 in Q2 2024. The improved earnings reflect continued momentum following the strategic investment portfolio repositioning undertaken in the fourth quarter of 2024.
Net interest income on a fully taxable equivalent (FTE) basis was $19.3 million during the quarter, an increase from $18.1 million in Q1 2025 (+6.6%) and $15.1 million in Q2 2024 (+27.7%). The FTE-yield on interest-earning assets for the second quarter of 2025 was 5.60%, up from 5.54% in Q1 2025 and 5.17% in Q2 2024.
Click here to download our most recent Sure Analysis report on NWFL (preview of page 1 of 3 shown below):
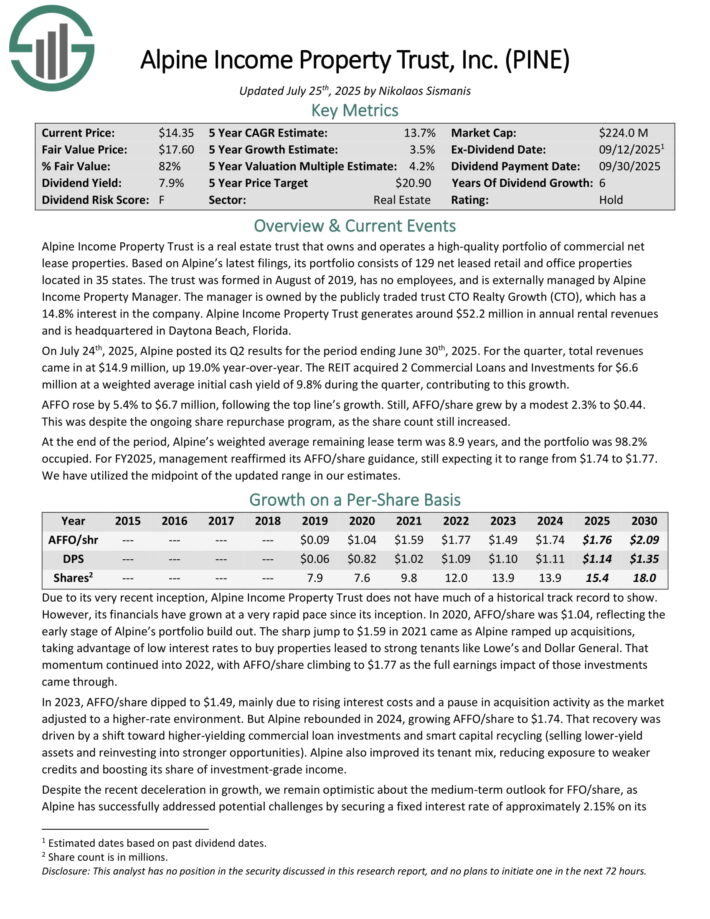
Micro Cap Stock #6: Alpine Income Property Trust (PINE)
- 5-year expected annual returns: 14.2%
Alpine Income Property Trust is a real estate trust that owns and operates a high-quality portfolio of commercial net lease properties. Based on Alpine’s latest filings, its portfolio consists of 129 net leased retail and office properties located in 35 states.
The trust was formed in August of 2019, has no employees, and is externally managed by Alpine Income Property Manager. The manager is owned by the publicly traded trust CTO Realty Growth (CTO), which has a 14.8% interest in the company. Alpine Income Property Trust generates around $52.2 million in annual rental revenues and is headquartered in Daytona Beach, Florida.
On July 24th, 2025, Alpine posted its Q2 results for the period ending June 30th, 2025. For the quarter, total revenues came in at $14.9 million, up 19.0% year-over-year. The REIT acquired 2 Commercial Loans and Investments for $6.6 million at a weighted average initial cash yield of 9.8% during the quarter, contributing to this growth.
AFFO rose by 5.4% to $6.7 million, following the top line’s growth. Still, AFFO/share grew by a modest 2.3% to $0.44. This was despite the ongoing share repurchase program, as the share count still increased. At the end of the period, Alpine’s weighted average remaining lease term was 8.9 years, and the portfolio was 98.2% occupied.
For FY2025, management reaffirmed its AFFO/share guidance, still expecting it to range from $1.74 to $1.77.
Click here to download our most recent Sure Analysis report on PINE (preview of page 1 of 3 shown below):
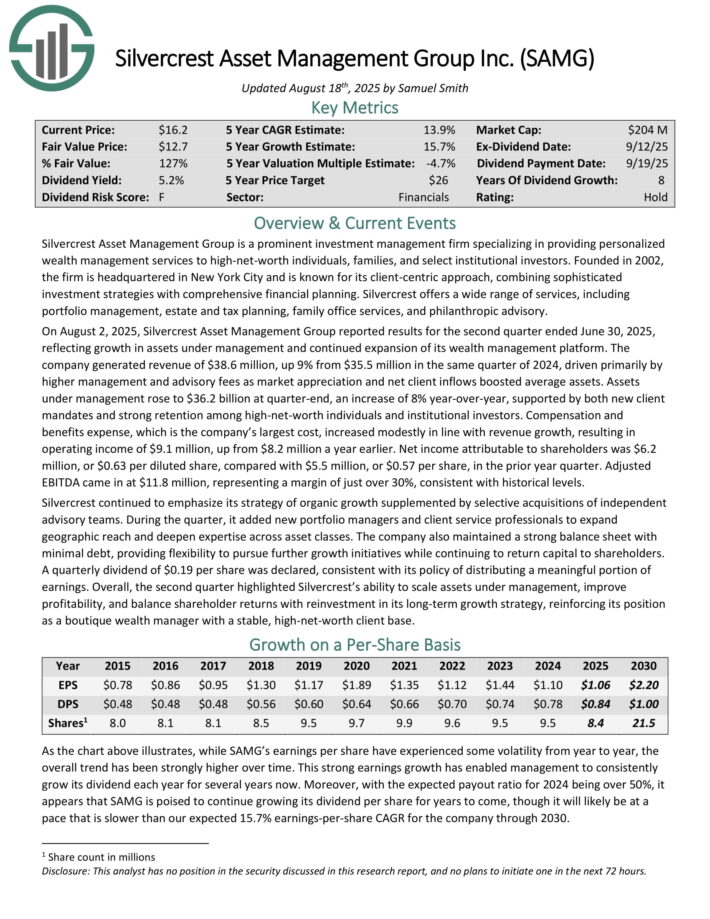
Micro Cap Stock #5: Silvercrest Asset Management Group (SAMG)
- 5-year expected annual returns: 14.6%
Silvercrest Asset Management Group is a prominent investment management firm specializing in providing personalized wealth management services to high-net-worth individuals, families, and select institutional investors.
Founded in 2002, the firm is headquartered in New York City and is known for its client-centric approach, combining sophisticated investment strategies with comprehensive financial planning.
Silvercrest offers a wide range of services, including portfolio management, estate and tax planning, family office services, and philanthropic advisory.
On August 2, 2025, Silvercrest Asset Management Group reported results for the second quarter ended June 30, 2025, reflecting growth in assets under management and continued expansion of its wealth management platform.
The company generated revenue of $38.6 million, up 9% from $35.5 million in the same quarter of 2024, driven primarily by higher management and advisory fees as market appreciation and net client inflows boosted average assets.
Assets under management rose to $36.2 billion at quarter-end, an increase of 8% year-over-year, supported by both new client mandates and strong retention among high-net-worth individuals and institutional investors.
Compensation and benefits expense, which is the company’s largest cost, increased modestly in line with revenue growth, resulting in operating income of $9.1 million, up from $8.2 million a year earlier.
Net income attributable to shareholders was $6.2 million, or $0.63 per diluted share, compared with $5.5 million, or $0.57 per share, in the prior year quarter. Adjusted EBITDA came in at $11.8 million, representing a margin of just over 30%, consistent with historical levels.
Click here to download our most recent Sure Analysis report on SAMG (preview of page 1 of 3 shown below):
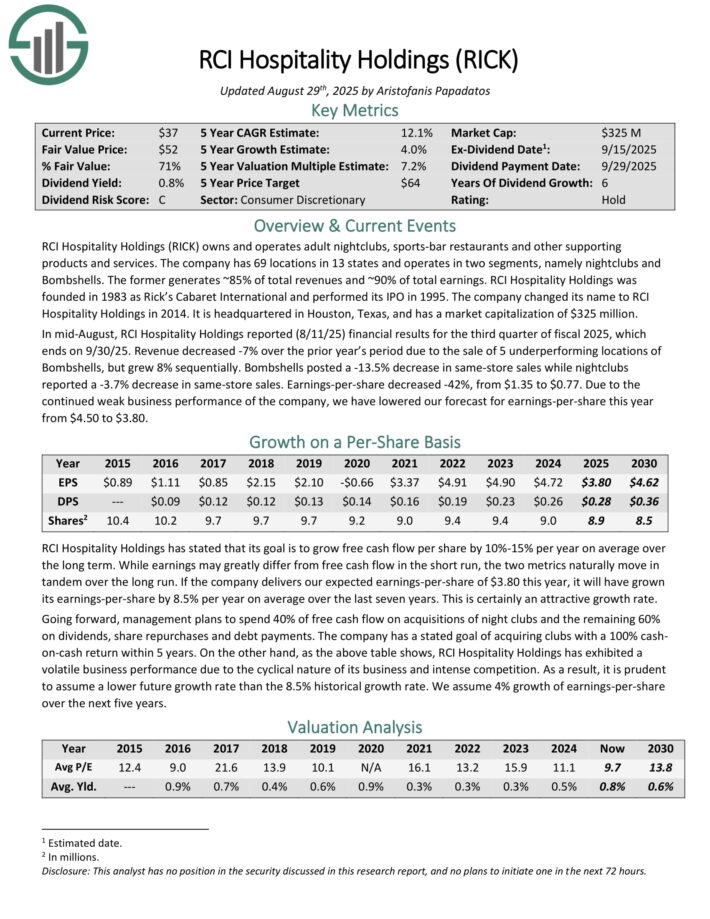
Micro Cap Stock #3: RCI Hospitality Holdings (RICK)
- 5-year expected annual returns: 16.7%
RCI Hospitality Holdings owns and operates adult nightclubs, sports-bar restaurants and other supporting products and services.
The company has 69 locations in 13 states and operates in two segments, namely nightclubs and Bombshells. The former generates ~85% of total revenues and ~90% of total earnings.
RCI Hospitality Holdings was founded in 1983 as Rick’s Cabaret International and performed its IPO in 1995. The company changed its name to RCI Hospitality Holdings in 2014. It is headquartered in Houston, Texas.
In mid-August, RCI Hospitality Holdings reported (8/11/25) financial results for the third quarter of fiscal 2025, which ends on 9/30/25. Revenue decreased -7% over the prior year’s period due to the sale of 5 under-performing locations of Bombshells, but grew 8% sequentially.
Bombshells posted a -13.5% decrease in same-store sales while nightclubs reported a -3.7% decrease in same-store sales. Earnings-per-share decreased -42%, from $1.35 to $0.77..
Click here to download our most recent Sure Analysis report on RICK (preview of page 1 of 3 shown below):
Micro Cap Stock #2: Horizon Technology Finance (HRZN)
- 5-year expected annual returns: 18.4%
Horizon Technology Finance Corp. is a BDC that provides venture capital to small and medium–sized companies in the technology, life sciences, and healthcare–IT sectors.
The company has generated attractive risk–adjusted returns through directly originated senior secured loans and additional capital appreciation through warrants.
On August 7th, 2025, Horizon announced its Q2 results for the period ending June 30th, 2025. For the quarter, total investment income fell 4.5% year-over-year to $24.5 million, primarily due to lower interest income on investments from the debt investment portfolio.
More specifically, the company’s dollar-weighted annualized yield on average debt investments in Q2 of 2025 and Q2 of 2024 was 15.8% and 15.9%, respectively.
Net investment income per share (IIS) fell to $0.28, down from $0.36 compared to Q2-2024. Net asset value (NAV) per share landed at $6.75, down from $9.12 year-over-year and $8.43 sequentially.
After paying its monthly distributions, Horizon’s undistributed spillover income as of the end of the quarter was $0.94 per share, indicating a considerable cash cushion. Management assured investors of the dividend’s stability by declaring three forward monthly dividends at a rate of $0.11.
Click here to download our most recent Sure Analysis report on HRZN (preview of page 1 of 3 shown below):

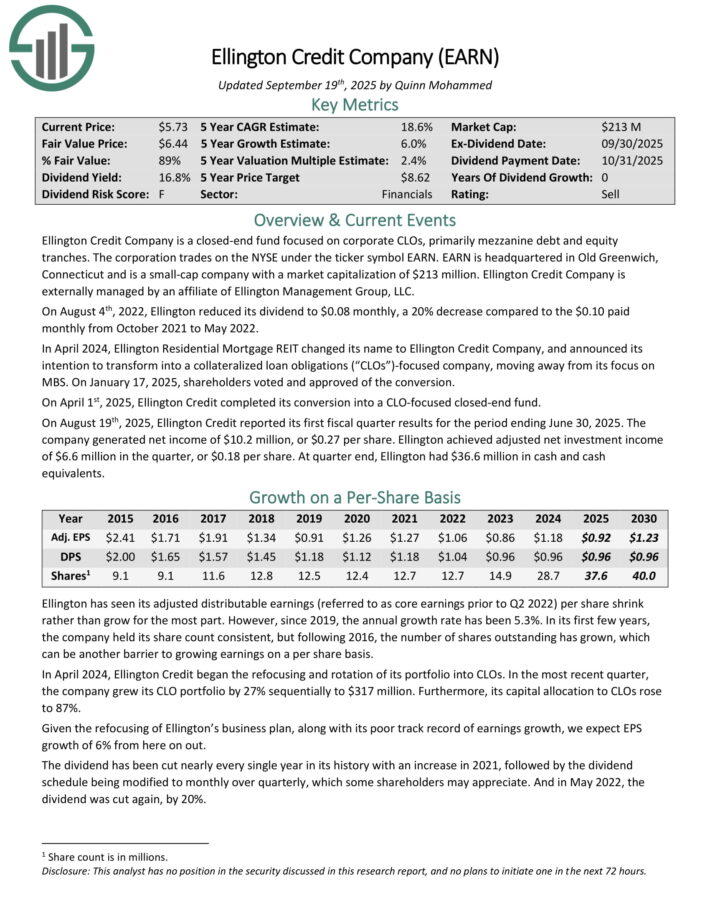
Micro Cap Stock #1: Ellington Credit Co. (EARN)
- 5-year expected annual returns: 18.6%
Ellington Credit Co. acquires, invests in, and manages residential mortgage and real estate related assets. Ellington focuses primarily on residential mortgage-backed securities, specifically those backed by a U.S. Government agency or U.S. government–sponsored enterprise.
Agency MBS are created and backed by government agencies or enterprises, while non-agency MBS are not guaranteed by the government.
On August 19th, 2025, Ellington Credit reported its first fiscal quarter results for the period ending June 30, 2025. The company generated net income of $10.2 million, or $0.27 per share.
Ellington achieved adjusted net investment income of $6.6 million in the quarter, or $0.18 per share. At quarter end, Ellington had $36.6 million in cash and cash equivalents.
Click here to download our most recent Sure Analysis report on EARN (preview of page 1 of 3 shown below):
Final Thoughts
Micro-cap stocks are the smallest companies currently trading on the stock market. The potential benefit of investing in micro-cap stocks is the potential for higher growth, and shareholder returns, over time.
Of course, investors need to carefully consider the unique risks associated with investing in micro-cap stocks. The 10 micro-cap stocks on this list all pay dividends to shareholders and have positive expected returns.
As a result, these 10 micro-cap stocks could be attractive for dividend growth investors.
Other Dividend Lists
The following lists contain many more high-quality dividend stocks:
- The Dividend Aristocrats List is comprised of 69 stocks in the S&P 500 Index with 25+ years of consecutive dividend increases.
- The Dividend Achievers List is comprised of ~400 NASDAQ stocks with 10+ years of consecutive dividend increases.
- The Dividend Kings List is even more exclusive than the Dividend Aristocrats. It is comprised of 56 stocks with 50+ years of consecutive dividend increases.
- The High Yield Dividend Kings List is comprised of the 20 Dividend Kings with the highest current yields.
- The High Dividend Stocks List: stocks that appeal to investors interested in the highest yields of 5% or more.
- The Monthly Dividend Stocks List: stocks that pay dividends every month, for 12 dividend payments per year.
- The Dividend Champions List: stocks that have increased their dividends for 25+ consecutive years.
Note: Not all Dividend Champions are Dividend Aristocrats because Dividend Aristocrats have additional requirements like being in The S&P 500.