Updated on March 6th, 2026 by Bob Ciura
Spreadsheet data updated daily
Real estate investment trusts – or REITs, for short – can be fantastic securities for generating meaningful portfolio income. REITs widely offer higher dividend yields than the average stock.
While the S&P 500 Index on average yields less than 1.5% right now, it is relatively easy to find REITs with dividend yields of 5% or higher.
The following downloadable REIT list contains a comprehensive list of U.S. Real Estate Investment Trusts, along with metrics that matter including:
- Stock price
- Dividend yield
- Market capitalization
- 5-year beta
You can download your free 100+ REIT list (along with important financial metrics like dividend yields and payout ratios) by clicking on the link below:
In addition to the downloadable Excel sheet of all REITs, this article discusses why income investors should pay particularly close attention to this asset class.
And, we also include our top 7 REITs today based on expected total returns.
Table Of Contents
In addition to the full downloadable Excel spreadsheet, this article covers our top 7 REITs today, as ranked using expected total returns from The Sure Analysis Research Database.
The table of contents below allows for easy navigation.
- How To Use The REIT List
- Why Invest In REITs?
- REIT Financial Metrics
- The Top 7 REITs Today
#7: American Assets Trust Inc. (AAT)
#6: Innovative Industrial Properties Inc. (IIPR)
#5: Rexford Industrial REIT (REXR)
#4: Marriott Vacations Worldwide (VAC)
#3: NexPoint Residential Trust (NXRT)
#2: Community Healthcare Trust (CHCT)
#1: Ellington Credit Co. (EARN)
How To Use The REIT List To Find Dividend Stock Ideas
REITs give investors the ability to experience the economic benefits associated with real estate ownership without the hassle of being a landlord in the traditional sense.
Because of the monthly rental cash flows generated by REITs, these securities are well-suited to investors that aim to generate income from their investment portfolios. Accordingly, dividend yield will be the primary metric of interest for many REIT investors.
For those unfamiliar with Microsoft Excel, the following images show how to filter for high dividend REITs with dividend yields between 5% and 7% using the ‘filter’ function of Excel.
Step 1: Download the Complete REIT Excel Spreadsheet List at the link above.
Step 2: Click on the filter icon at the top of the ‘Dividend Yield’ column in the Complete REIT Excel Spreadsheet List.

Step 3: Use the filter function ‘Between’ along with the numbers 0.05 and 0.07 to display REITs with dividend yields between 5% and 7%.
This will help to eliminate any REITs with exceptionally high (and perhaps unsustainable) dividend yields.
Also, click on ‘Largest to Smallest’ at the top of the filter window to list the REITs with the highest dividend yields at the top of the spreadsheet.

Now that you have the tools to identify high-quality REITs, the next section will show some of the benefits of owning this asset class in a diversified investment portfolio.
Why Invest in REITs?
REITs are, by design, a fantastic asset class for investors looking to generate income.
Thus, one of the primary benefits of investing in these securities is their high dividend yields.
The currently high dividend yields of REITs is not an isolated occurrence. In fact, this asset class has traded at a higher dividend yield than the S&P 500 for decades.
Related: Dividend investing versus real estate investing.
The high dividend yields of REITs are due to the regulatory implications of doing business as a real estate investment trust.
In exchange for listing as a REIT, these trusts must pay out at least 90% of their net income as dividend payments to their unitholders (REITs trade as units, not shares).
Sometimes you will see a payout ratio of less than 90% for a REIT, and that is likely because they are using funds from operations, not net income, in the denominator for REIT payout ratios (more on that later).
REIT Financial Metrics
REITs run unique business models. More than the vast majority of other business types, they are primarily involved in the ownership of long-lived assets.
From an accounting perspective, this means that REITs incur significant non-cash depreciation and amortization expenses.
How does this affect the bottom line of REITs?
Depreciation and amortization expenses reduce a company’s net income, which means that sometimes a REIT’s dividend will be higher than its net income, even though its dividends are safe based on cash flow.
To give a better sense of financial performance and dividend safety, REITs eventually developed the financial metric funds from operations, or FFO.
Just like earnings, FFO can be reported on a per-unit basis, giving FFO/unit – the rough equivalent of earnings-per-share for a REIT.
FFO is determined by taking net income and adding back various non-cash charges that are seen to artificially impair a REIT’s perceived ability to pay its dividend.
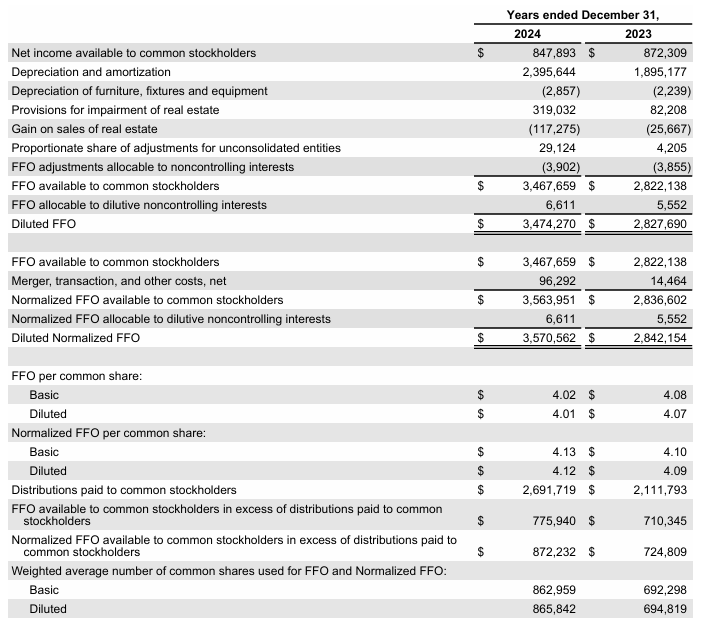
For an example of how FFO is calculated, consider the following net income-to-FFO reconciliation from Realty Income (O), one of the largest and most popular REIT securities.
Source: Realty Income Annual Report
In 2024, net income was $847 million while FFO available to stockholders was above $3.4 billion, a sizable difference between the two metrics.
This shows the profound effect that depreciation and amortization can have on the GAAP financial performance of real estate investment trusts.
The Top 7 REITs Today
Below we have ranked our top 7 REITs today based on expected total returns.
Expected total returns are in turn made up from dividend yield, expected growth on a per unit basis, and valuation multiple changes. Expected total return investing takes into account income (dividend yield), growth, and value.
Note: The REITs below have not been vetted for safety. These are high expected total return securities, but they may come with elevated risks.
We encourage investors to fully consider the risk/reward profile of these investments.
For the Top 10 REITs each month with 4%+ dividend yields, based on expected total returns and safety, see our Top 10 REITs service.
Top REIT #7: American Assets Trust (AAT)
- Expected Total Return: 14.8%
American Assets Trust (AAT) is a REIT that was formed in 2011 as a successor of American Assets, a privately held company founded in 1967.
AAT is headquartered in San Diego, California, and has great experience in acquiring, improving and developing office, retail and residential properties throughout the U.S., primarily in Southern California, Northern California, Oregon, Washington and Hawaii.
In early February, AAT reported (2/3/26) financial results for the fourth quarter of fiscal 2025. Same-store net operating income remained flat but funds from operations (FFO) per share declined -15% over the prior year’s quarter, mostly due to higher interest expense.
AAT provided lackluster guidance for 2026, expecting FFO per share of $1.96-$2.10.
We note that AAT has missed the analysts’ estimates only once in the last 20 quarters. We expect FFO per share of $2.05 this year, slightly above the mid-point of the guidance.
We also note that the REIT appears somewhat resilient to high inflation thanks to its ability to raise rental rates every year. AAT raised its dividend by 1.5% last year.
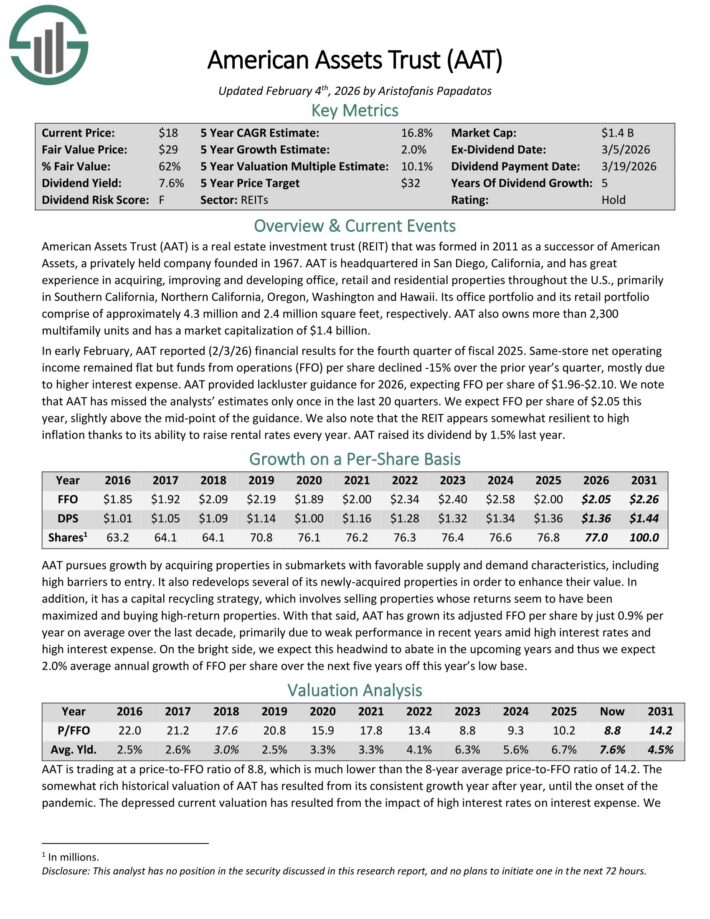
Click here to download our most recent Sure Analysis report on AAT (preview of page 1 of 3 shown below):
Top REIT #6: Innovative Industrial Properties Inc. (IIPR)
- Expected Total Return: 15.1%
Innovative Industrial Properties, Inc. is a single-use “specialty REIT” that exclusively focuses on owning properties used for the cultivation and production of cannabis.
The REIT owned 112 properties in 19 states at the end of June. Due to the cannabis boom over the past few years, as well as its exclusivity in terms of the listing giving the trust access to public markets, Innovate Industrial Properties is a truly unique REIT.
On February 23rd, 2026, IIPR posted its Q4 results for the period ending December 31st, 2025. Revenues and AFFO per share were $66.7 million and $1.88, down 13% and 15% year-over-year, respectively.
The year-over-year revenue decline was primarily driven by an $8.5 million decrease in rental revenue and a $1.6 million decrease in tenant reimbursements, largely attributable to tenant defaults related to PharmaCann, TILT and 4Front.
Interest and other income increased to $6.7 million, primarily reflecting $5.0 million of interest and dividend income from financial investments in IQHQ.
During the quarter, the company executed new leases totaling 70,000 square feet in North Palm Springs, California and 58,000 square feet in Holliston, Massachusetts, and in January 2026 executed a 204,000 square foot lease in Desert Hot Springs, California.
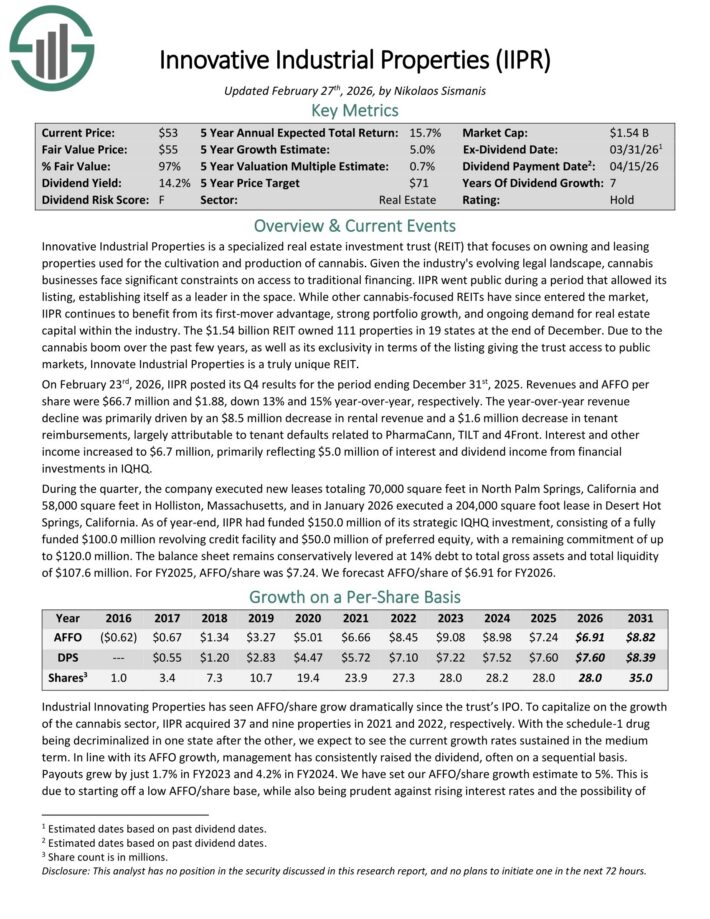
Click here to download our most recent Sure Analysis report on IIPR (preview of page 1 of 3 shown below):
Top REIT #5: Rexford Industrial REIT (REXR)
- Expected Total Return: 16.0%
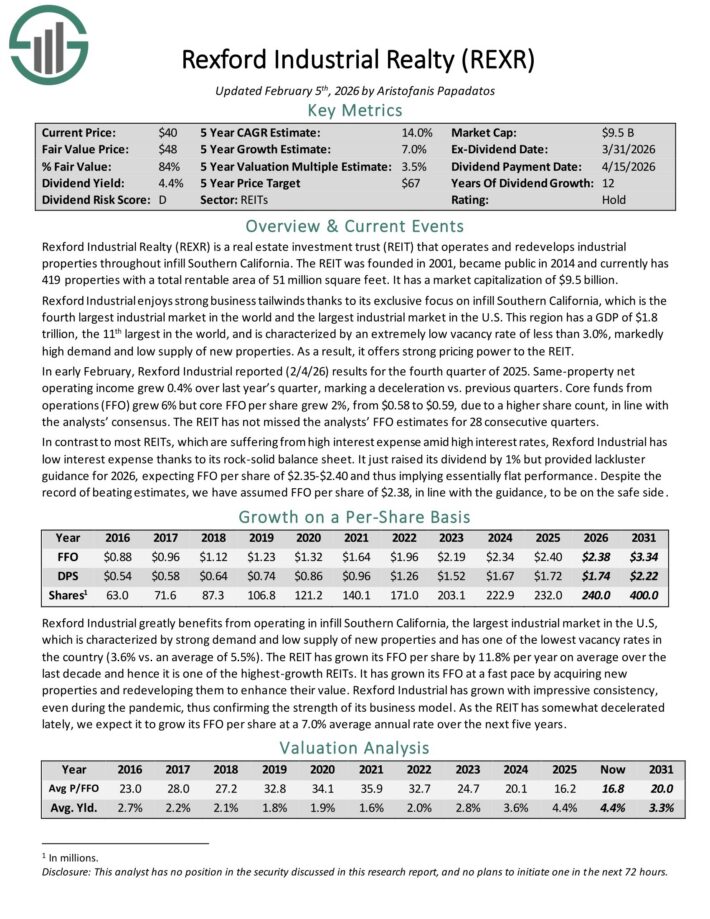
Rexford Industrial Realty (REXR) is a real estate investment trust (REIT) that operates and redevelops industrial properties throughout infill Southern California.
The REIT was founded in 2001, became public in 2014 and currently has 419 properties with a total rentable area of 51 million square feet.
Rexford Industrial enjoys strong business tailwinds thanks to its exclusive focus on infill Southern California, which is the fourth-largest industrial market in the world and the largest industrial market in the U.S.
This region has a GDP of $1.8 trillion, the 11th largest in the world, and is characterized by an extremely low vacancy rate of less than 3.0%, markedly high demand and low supply of new properties. As a result, it offers strong pricing power to the REIT.
In early February, Rexford Industrial reported (2/4/26) results for the fourth quarter of 2025. Same-property net operating income grew 0.4% over last year’s quarter, marking a deceleration vs. previous quarters.
Core funds from operations (FFO) grew 6% but core FFO per share grew 2%, from $0.58 to $0.59, due to a higher share count, in line with the analysts’ consensus.
The REIT has not missed the analysts’ FFO estimates for 28 consecutive quarters. In contrast to most REITs, which are suffering from high interest expense amid high interest rates, Rexford Industrial has low interest expense thanks to its rock-solid balance sheet.
It just raised its dividend by 1% but provided lackluster guidance for 2026, expecting FFO per share of $2.35-$2.40 and thus implying essentially flat performance.
Click here to download our most recent Sure Analysis report on REXR (preview of page 1 of 3 shown below):
Top REIT #4: Marriott Vacations Worldwide (VAC)
- Expected Total Return: 17.2%
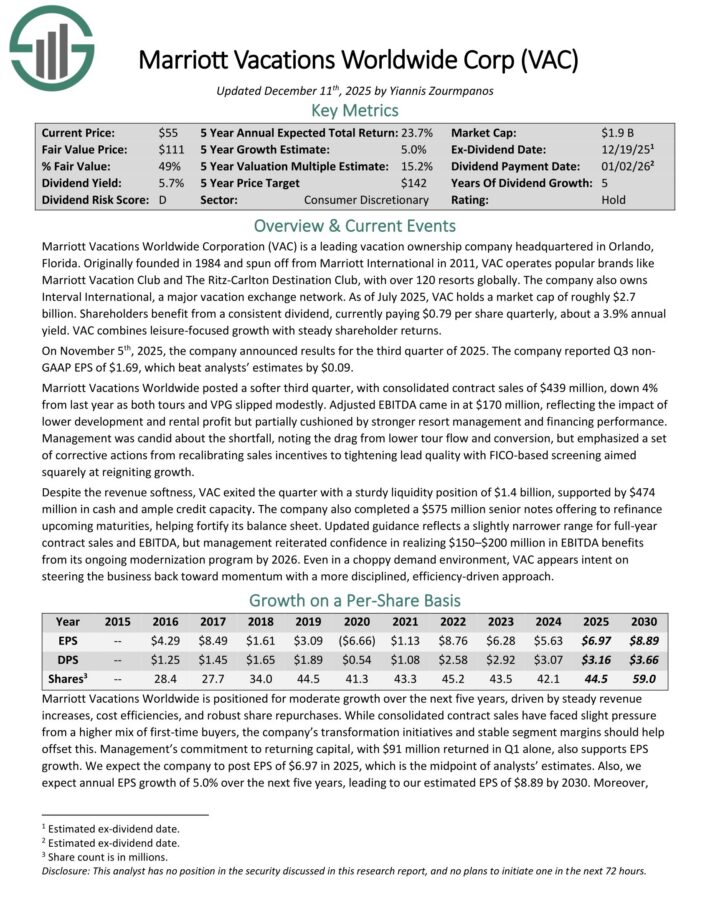
Marriott Vacations Worldwide Corporation (VAC) is a leading vacation ownership company headquartered in Orlando, Florida.
VAC operates popular brands like Marriott Vacation Club and The Ritz-Carlton Destination Club, with over 120 resorts globally. The company also owns Interval International, a major vacation exchange network.
On November 5th, 2025, the company announced results for the third quarter of 2025. The company reported Q3 non-GAAP EPS of $1.69, which beat analysts’ estimates by $0.09.
Marriott Vacations Worldwide posted a softer third quarter, with consolidated contract sales of $439 million, down 4% from last year as both tours and VPG slipped modestly. Adjusted EBITDA came in at $170 million, reflecting the impact of lower development and rental profit but partially cushioned by stronger resort management and financing performance.
Management was candid about the shortfall, noting the drag from lower tour flow and conversion, but emphasized a set of corrective actions from recalibrating sales incentives to tightening lead quality with FICO-based screening aimed
squarely at reigniting growth.
Despite the revenue softness, VAC exited the quarter with a sturdy liquidity position of $1.4 billion, supported by $474 million in cash and ample credit capacity.
The company also completed a $575 million senior notes offering to refinance upcoming maturities, helping fortify its balance sheet.
Updated guidance reflects a slightly narrower range for full-year contract sales and EBITDA, but management reiterated confidence in realizing $150–$200 million in EBITDA benefits from its ongoing modernization program by 2026.
Click here to download our most recent Sure Analysis report on VAC (preview of page 1 of 3 shown below):
Top REIT #3: NexPoint Residential Trust (NXRT)
- Expected Total Return: 17.6%
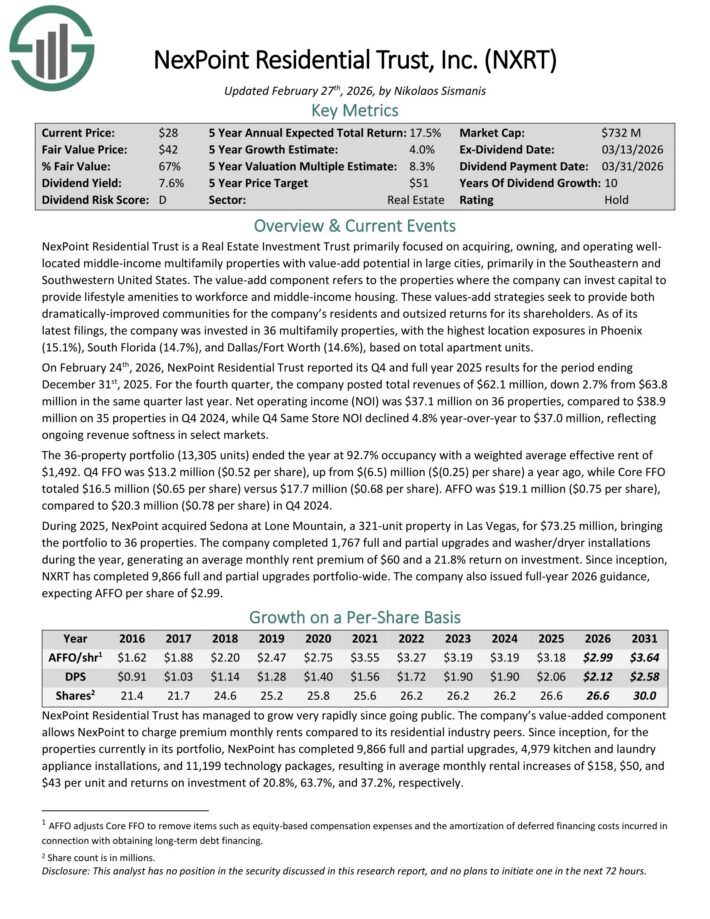
NexPoint Residential Trust is a Real Estate Investment Trust primarily focused on acquiring, owning, and operating well-located middle-income multifamily properties with value-add potential in large cities, primarily in the Southeastern and Southwestern United States.
The value-add component refers to the properties where the company can invest capital to provide lifestyle amenities to workforce and middle-income housing.
These values-add strategies seek to provide both dramatically-improved communities for the company’s residents and outsized returns for its shareholders.
As of its latest filings, the company was invested in 36 multifamily properties, with the highest location exposures in Phoenix (15.1%), South Florida (14.7%), and Dallas/Fort Worth (14.6%), based on total apartment units.
On February 24th, 2026, NexPoint Residential Trust reported its Q4 and full year 2025 results for the period ending
December 31st, 2025. For the fourth quarter, the company posted total revenues of $62.1 million, down 2.7% from $63.8 million in the same quarter last year.
Net operating income (NOI) was $37.1 million on 36 properties, compared to $38.9 million on 35 properties in Q4 2024, while Q4 Same Store NOI declined 4.8% year-over-year to $37.0 million, reflecting ongoing revenue softness in select markets.
The 36-property portfolio (13,305 units) ended the year at 92.7% occupancy with a weighted average effective rent of $1,492.
Q4 FFO was $13.2 million ($0.52 per share), up from $(6.5) million ($(0.25) per share) a year ago, while Core FFO totaled $16.5 million ($0.65 per share) versus $17.7 million ($0.68 per share).
AFFO was $19.1 million ($0.75 per share), compared to $20.3 million ($0.78 per share) in Q4 2024.
Click here to download our most recent Sure Analysis report on NXRT (preview of page 1 of 3 shown below):
Top REIT #2: Community Healthcare Trust (CHCT)
- Expected Total Return: 17.9%
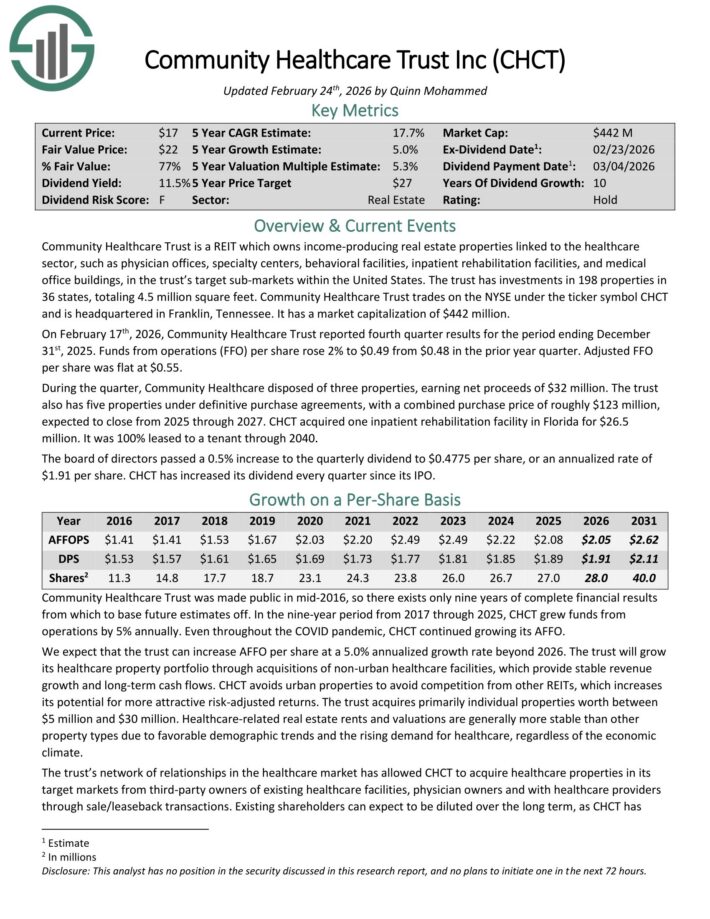
Community Healthcare Trust is a REIT which owns income-producing real estate properties linked to the healthcare sector, such as physician offices, specialty centers, behavioral facilities, inpatient rehabilitation facilities, and medical office buildings, in the trust’s target sub-markets within the United States.
The trust has investments in 200 properties in 36 states, totaling 4.6 million square feet.
On February 17th, 2026, Community Healthcare Trust reported fourth quarter results for the period ending December 31st, 2025. Funds from operations (FFO) per share rose 2% to $0.49 from $0.48 in the prior year quarter. Adjusted FFO per share was flat at $0.55.
During the quarter, Community Healthcare disposed of three properties, earning net proceeds of $32 million. The trust also has five properties under definitive purchase agreements, with a combined purchase price of roughly $123 million, expected to close from 2025 through 2027.
CHCT acquired one inpatient rehabilitation facility in Florida for $26.5 million. It was 100% leased to a tenant through 2040.
The board of directors passed a 0.5% increase to the quarterly dividend to $0.4775 per share, or an annualized rate of $1.91 per share. CHCT has increased its dividend every quarter since its IPO.
Click here to download our most recent Sure Analysis report on CHCT (preview of page 1 of 3 shown below):
Top REIT #1: Ellington Credit Co. (EARN)
- Expected Total Return: 22.7%
Ellington Credit Co. acquires, invests in, and manages residential mortgage and real estate related assets. Ellington focuses primarily on residential mortgage-backed securities, specifically those backed by a U.S. Government agency or U.S. government–sponsored enterprise.
Agency MBS are created and backed by government agencies or enterprises, while non-agency MBS are not guaranteed by the government.
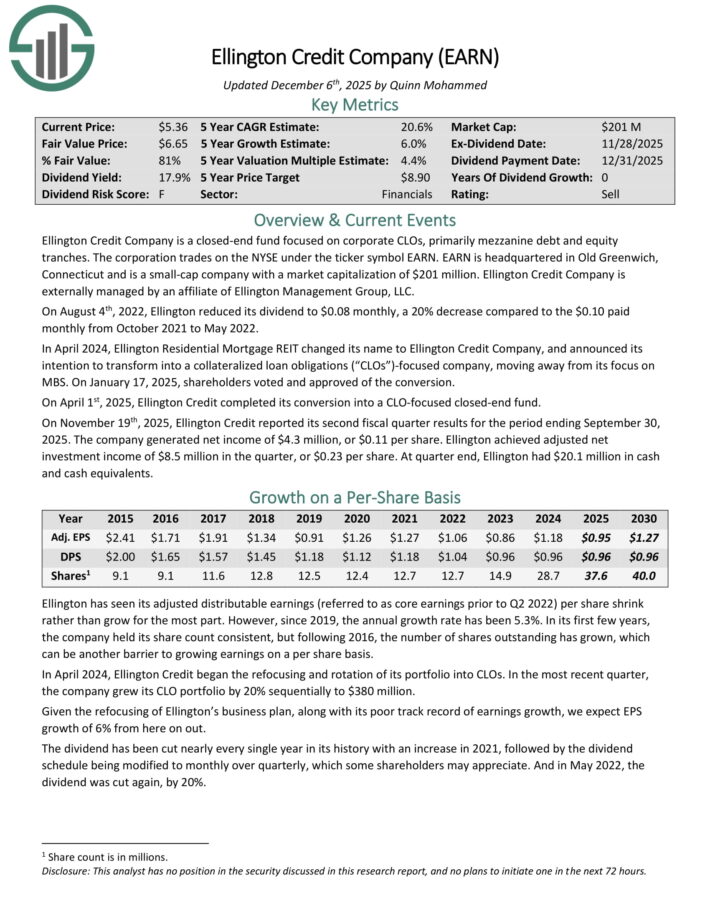
On November 19th, 2025, Ellington Credit reported its second fiscal quarter results for the period ending September 30, 2025. The company generated net income of $4.3 million, or $0.11 per share.
Ellington achieved adjusted net investment income of $8.5 million in the quarter, or $0.23 per share. At quarter end, Ellington had $20.1 million in cash and cash equivalents.
Click here to download our most recent Sure Analysis report on EARN (preview of page 1 of 3 shown below):
Final Thoughts
The REIT Spreadsheet list in this article contains a list of publicly-traded Real Estate Investment Trusts.
However, this database is certainly not the only place to find high-quality dividend stocks trading at fair or better prices.
In fact, one of the best methods to find high-quality dividend stocks is looking for stocks with long histories of steadily rising dividend payments.
Companies that have increased their payouts through many market cycles are highly likely to continue doing so for a long time to come.
You can see more high-quality dividend stocks in the following Sure Dividend databases, each based on long streaks of steadily rising dividend payments:
- Dividend Kings List: Dividend Stocks With 50+ Years of Rising Dividends
- Dividend Aristocrats List: 25+ Years of Rising Dividends
You might also be looking to create a highly customized dividend income stream to pay for life’s expenses.
The following lists provide useful information on high dividend stocks and stocks that pay monthly dividends: