Updated on June 15th, 2026 by Bob Ciura
Stocks with low P/E ratios can offer attractive returns if their valuation multiples expand.
And when a low P/E stock also has a high dividend yield, investors get ‘paid to wait’ for the valuation multiple to increase.
We define a high-yield stock as one with a current dividend yield of 4% or higher.
The free high dividend stocks list spreadsheet below has our full list of individual securities (stocks, REITs, MLPs, etc.) with with 4%+ dividend yields.
You can download a free copy by clicking on the link below:
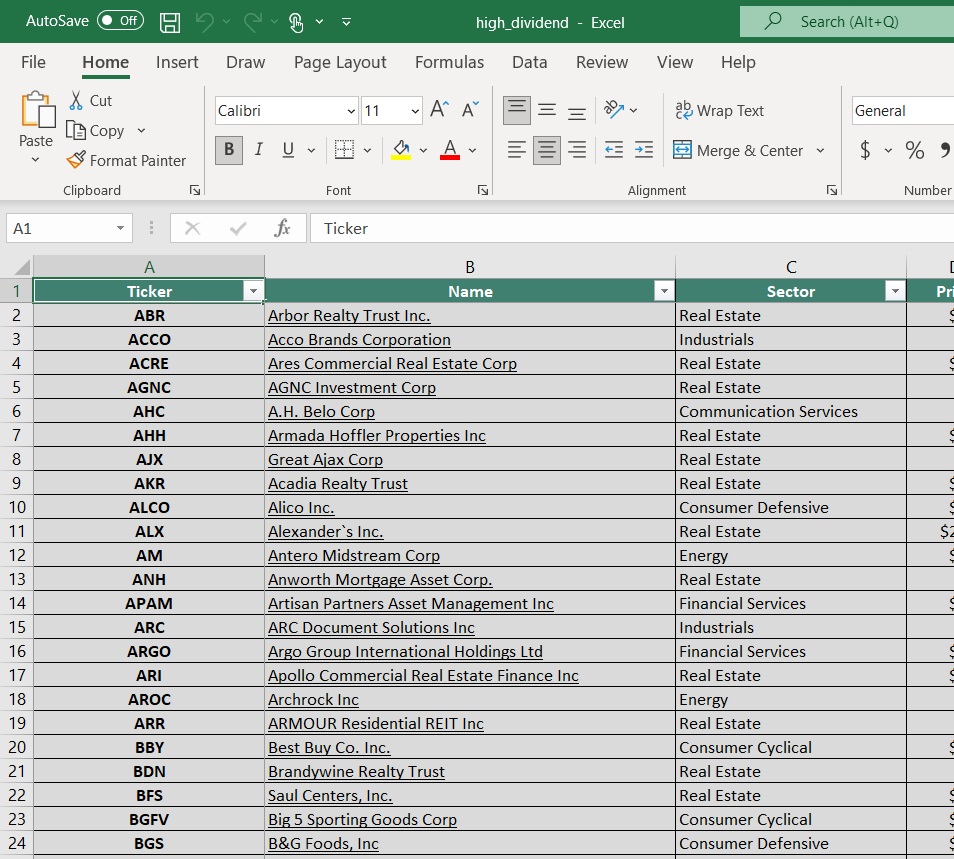
In this research report, we discuss the prospects of 20 undervalued high dividend stocks, which are currently trading at P/E ratios under 10 and are offering dividend yields above 5.0%.
International stocks were excluded from this report.
We have ranked the stocks by P/E ratio, from lowest to highest. For REITs, we use P/FFO in place of the P/E ratio. And for MLPs, we use P/DCF (which is distributable cash flows).
These are comparable metrics similar to earnings for common stocks.
These 20 dividend stocks have not been screened for dividend safety. Instead, these are the 20 most undervalued stocks in the Sure Analysis Research Database with high dividend yields.
Table of Contents
- Undervalued High Dividend Stock #1: BCP Investment Corporation (BCIC)
- Undervalued High Dividend Stock #2: CION Investment Corporation (CION)
- Undervalued High Dividend Stock #3: Invesco Mortgage Capital (IVR)
- Undervalued High Dividend Stock #4: PennantPark Investment Corporation (PNNT)
- Undervalued High Dividend Stock #5: Oxford Square Capital (OXSQ)
- Undervalued High Dividend Stock #6: Orchid Island Capital (ORC)
- Undervalued High Dividend Stock #7: Prospect Capital (PSEC)
- Undervalued High Dividend Stock #8: Sunoco LP (SUN)
- Undervalued High Dividend Stock #9: ARMOUR Residential REIT (ARR)
- Undervalued High Dividend Stock #10: Shutterstock, Inc. (SSTK)
- Undervalued High Dividend Stock #11: Virtus Investment Partners (VRTS)
- Undervalued High Dividend Stock #12: Ellington Credit Co. (EARN)
- Undervalued High Dividend Stock #13: Horizon Technology Finance (HRZN)
- Undervalued High Dividend Stock #14: AGNC Investment Corporation (AGNC)
- Undervalued High Dividend Stock #15: Saratoga Investment Corp. (SAR)
- Undervalued High Dividend Stock #16: Energy Transfer LP (ET)
- Undervalued High Dividend Stock #17: Comcast Corp. (CMCSA)
- Undervalued High Dividend Stock #18: PennantPark Floating Rate Capital (PFLT)
- Undervalued High Dividend Stock #19: OneMain Holdings (OMF)
- Undervalued High Dividend Stock #20: Prudential Financial (PRU)
Keep reading to see analysis on these 20 undervalued high dividend stocks.
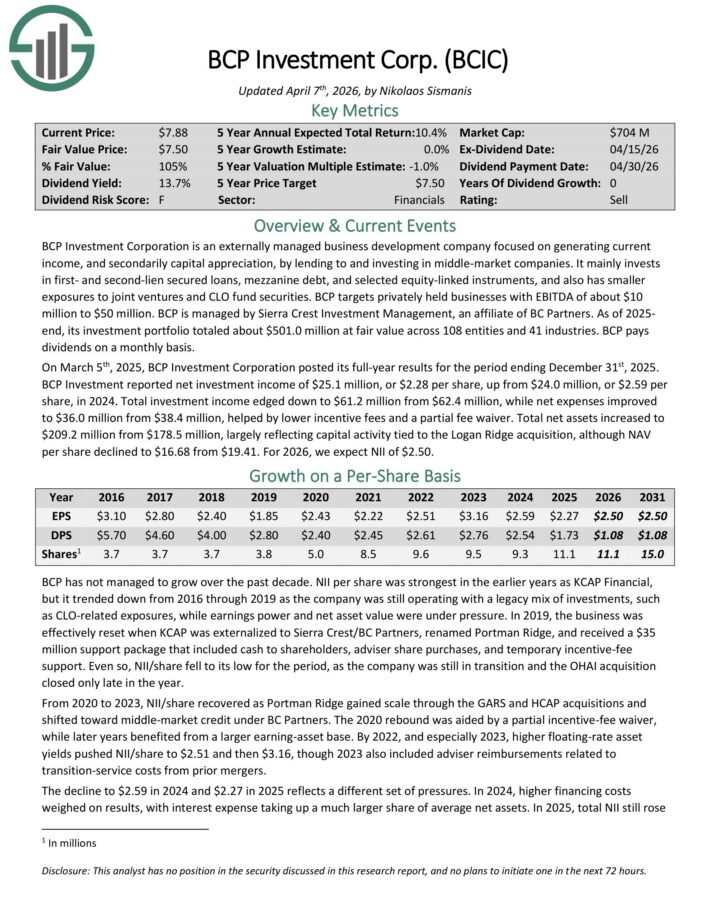
Undervalued High Dividend Stock #1: BCP Investment Corporation (BCIC) – P/E ratio of 3.0
BCP Investment Corporation is an externally managed business development company focused on generating current income, and secondarily capital appreciation, by lending to and investing in middle-market companies.
It mainly invests in first- and second-lien secured loans, mezzanine debt, and selected equity-linked instruments, and also has smaller exposures to joint ventures and CLO fund securities.
BCP targets privately held businesses with EBITDA of about $10 million to $50 million. BCP is managed by Sierra Crest Investment Management, an affiliate of BC Partners.
As of 2025 end, its investment portfolio totaled about $501.0 million at fair value across 108 entities and 41 industries.
On March 5th, 2025, BCP Investment Corporation posted its full-year results for the period ending December 31st, 2025. BCP Investment reported net investment income of $25.1 million, or $2.28 per share, up from $24.0 million, or $2.59 per share, in 2024.
Total investment income edged down to $61.2 million from $62.4 million, while net expenses improved to $36.0 million from $38.4 million, helped by lower incentive fees and a partial fee waiver.
Total net assets increased to $209.2 million from $178.5 million, largely reflecting capital activity tied to the Logan Ridge acquisition, although NAV per share declined to $16.68 from $19.41.
For 2026, we expect NII of $2.50.
Click here to download our most recent Sure Analysis report on BCIC (preview of page 1 of 3 shown below):
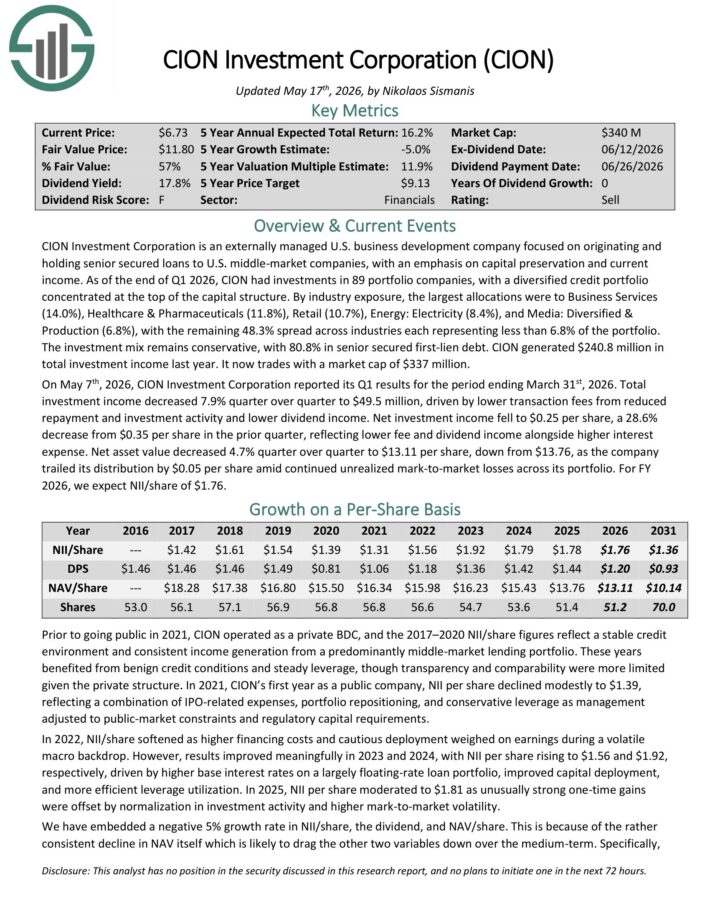
Undervalued High Dividend Stock #2: CION Investment Corporation (CION) – P/E ratio of 4.0
CION Investment Corporation is an externally managed U.S. business development company focused on originating and holding senior secured loans to U.S. middle-market companies, with an emphasis on capital preservation and current income.
As of the end of Q1 2026, CION had investments in 89 portfolio companies, with a diversified credit portfolio concentrated at the top of the capital structure.
By industry exposure, the largest allocations were to Business Services (14.0%), Healthcare & Pharmaceuticals (11.8%), Retail (10.7%), Energy: Electricity (8.4%), and Media: Diversified & Production (6.8%).
The remaining 48.3% is spread across industries each representing less than 6.8% of the portfolio. The investment mix remains conservative, with 80.8% in senior secured first-lien debt.
On May 7th, 2026, CION Investment Corporation reported its Q1 results. Total investment income decreased 7.9% quarter over quarter to $49.5 million, driven by lower transaction fees from reduced repayment and investment activity and lower dividend income.
Net investment income fell to $0.25 per share, a 28.6% decrease from $0.35 per share in the prior quarter, reflecting lower fee and dividend income alongside higher interest expense. Net asset value decreased 4.7% quarter over quarter to $13.11 per share, down from $13.76.
Click here to download our most recent Sure Analysis report on CION (preview of page 1 of 3 shown below):
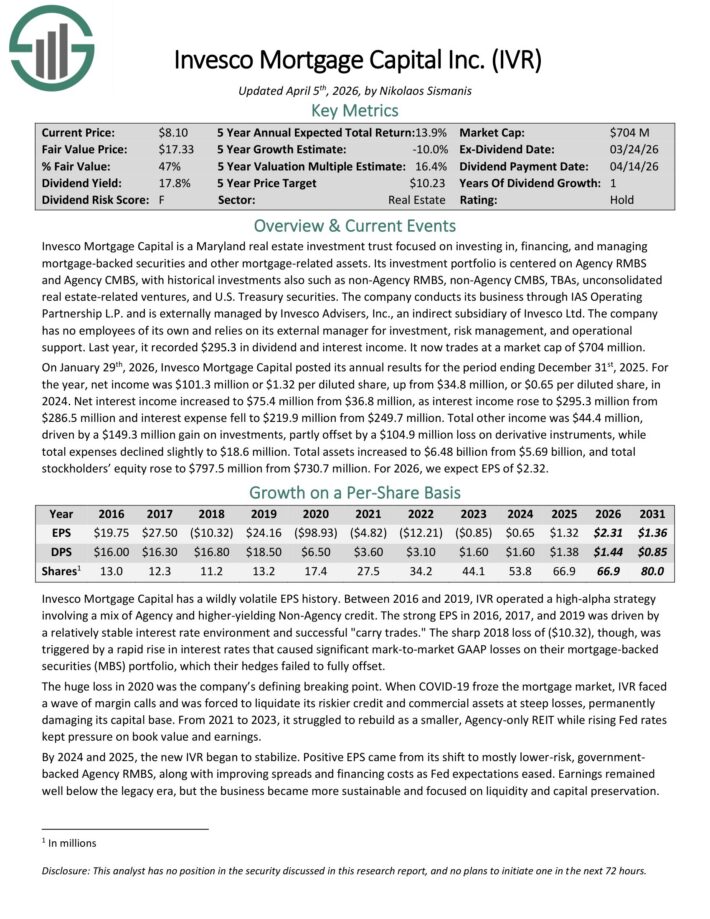
Undervalued High Dividend Stock #3: Invesco Mortgage Capital (IVR) – P/E ratio of 4.0
Invesco Mortgage Capital is a Maryland real estate investment trust focused on investing in, financing, and managing mortgage-backed securities and other mortgage-related assets.
Its investment portfolio is centered on Agency RMBS and Agency CMBS, with historical investments also such as non-Agency RMBS, non-Agency CMBS, TBAs, unconsolidated real estate-related ventures, and U.S. Treasury securities.
The company conducts its business through IAS Operating Partnership L.P. and is externally managed by Invesco Advisers, Inc., an indirect subsidiary of Invesco Ltd.
The company has no employees of its own and relies on its external manager for investment, risk management, and operational support. Last year, it recorded $295.3 in dividend and interest income.
On January 29th, 2026, Invesco Mortgage Capital posted its annual results for the period ending December 31st, 2025. For the year, net income was $101.3 million or $1.32 per diluted share, up from $34.8 million, or $0.65 per diluted share, in 2024.
Net interest income increased to $75.4 million from $36.8 million, as interest income rose to $295.3 million from $286.5 million and interest expense fell to $219.9 million from $249.7 million.
Total other income was $44.4 million, driven by a $149.3 million gain on investments, partly offset by a $104.9 million loss on derivative instruments, while total expenses declined slightly to $18.6 million.
Total assets increased to $6.48 billion from $5.69 billion, and total stockholders’ equity rose to $797.5 million from $730.7 million.
For 2026, we expect EPS of $2.32.
Click here to download our most recent Sure Analysis report on IVR (preview of page 1 of 3 shown below):
Undervalued High Dividend Stock #4: PennantPark Investment Corporation (PNNT) – P/E ratio of 4.0
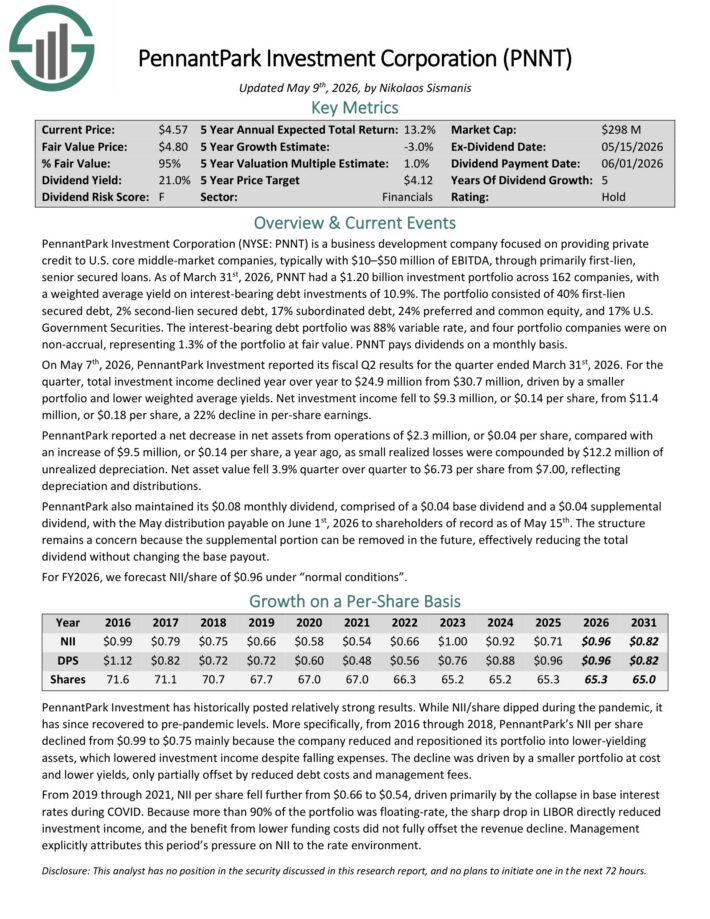
PennantPark Investment Corporation is a business development company focused on providing private credit to U.S. core middle-market companies, typically with $10–$50 million of EBITDA, through primarily first-lien, senior secured loans.
As of March 31st, 2026, PNNT had a $1.20 billion investment portfolio across 162 companies, with a weighted average yield on interest-bearing debt investments of 10.9%.
The portfolio consisted of 40% first-lien secured debt, 2% second-lien secured debt, 17% subordinated debt, 24% preferred and common equity, and 17% U.S. Government Securities.
The interest-bearing debt portfolio was 88% variable rate, and four portfolio companies were on non-accrual, representing 1.3% of the portfolio at fair value.
On May 7th, 2026, PennantPark Investment reported its fiscal Q2 results. For the quarter, total investment income declined year over year to $24.9 million from $30.7 million, driven by a smaller portfolio and lower weighted average yields.
Net investment income fell to $9.3 million, or $0.14 per share, from $11.4 million, or $0.18 per share, a 22% decline in per-share earnings.
PennantPark reported a net decrease in net assets from operations of $2.3 million, or $0.04 per share, compared with an increase of $9.5 million, or $0.14 per share, a year ago.
Click here to download our most recent Sure Analysis report on PNNT (preview of page 1 of 3 shown below):
Undervalued High Dividend Stock #5: Oxford Square Capital (OSXQ) – P/E ratio of 4.6
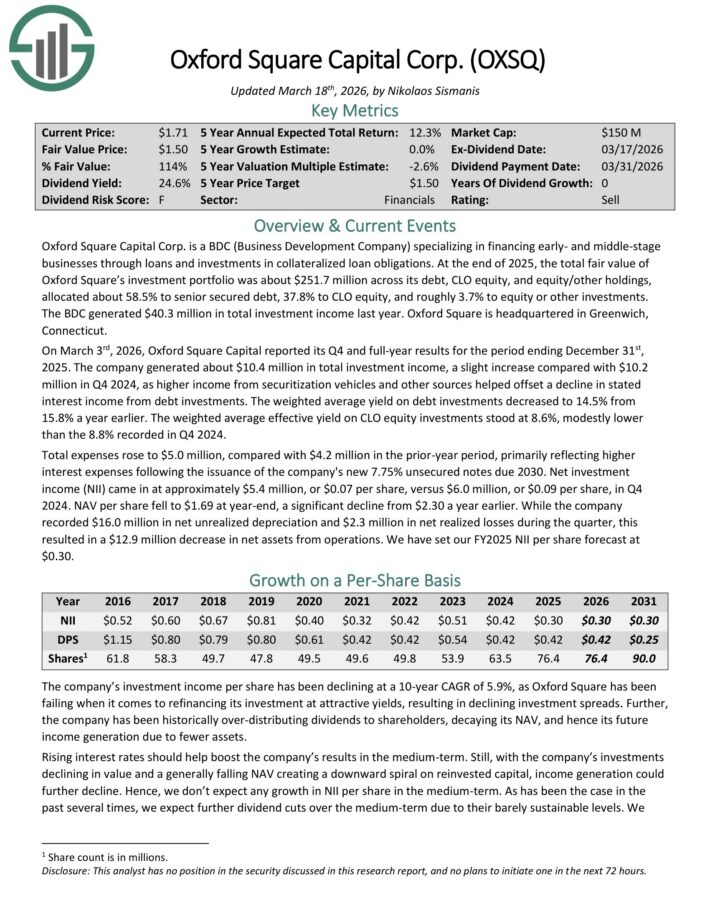
Oxford Square Capital Corp. is a BDC (Business Development Company) specializing in financing early- and middle-stage businesses through loans and investments in collateralized loan obligations.
At the end of 2025, the total fair value of Oxford Square’s investment portfolio was about $251.7 million across its debt, CLO equity, and equity/other holdings, allocated about 58.5% to senior secured debt, 37.8% to CLO equity, and roughly 3.7% to equity or other investments.
On March 3rd, 2026, Oxford Square Capital reported its Q4 and full-year results for the period ending December 31st, 2025.
The company generated about $10.4 million in total investment income, a slight increase compared with $10.2 million in Q4 2024, as higher income from securitization vehicles and other sources helped offset a decline in stated interest income from debt investments.
The weighted average yield on debt investments decreased to 14.5% from 15.8% a year earlier. The weighted average effective yield on CLO equity investments stood at 8.6%, modestly lower than the 8.8% recorded in Q4 2024.
Total expenses rose to $5.0 million, compared with $4.2 million in the prior-year period, primarily reflecting higher interest expenses following the issuance of the company’s new 7.75% unsecured notes due 2030.
Net investment income (NII) came in at approximately $5.4 million, or $0.07 per share, versus $6.0 million, or $0.09 per share, in Q4 2024. NAV per share fell to $1.69 at year-end, a significant decline from $2.30 a year earlier..
Click here to download our most recent Sure Analysis report on OXSQ (preview of page 1 of 3 shown below):
Undervalued High Dividend Stock #6: Orchid Island Capital (ORC) – P/E ratio of 5.0
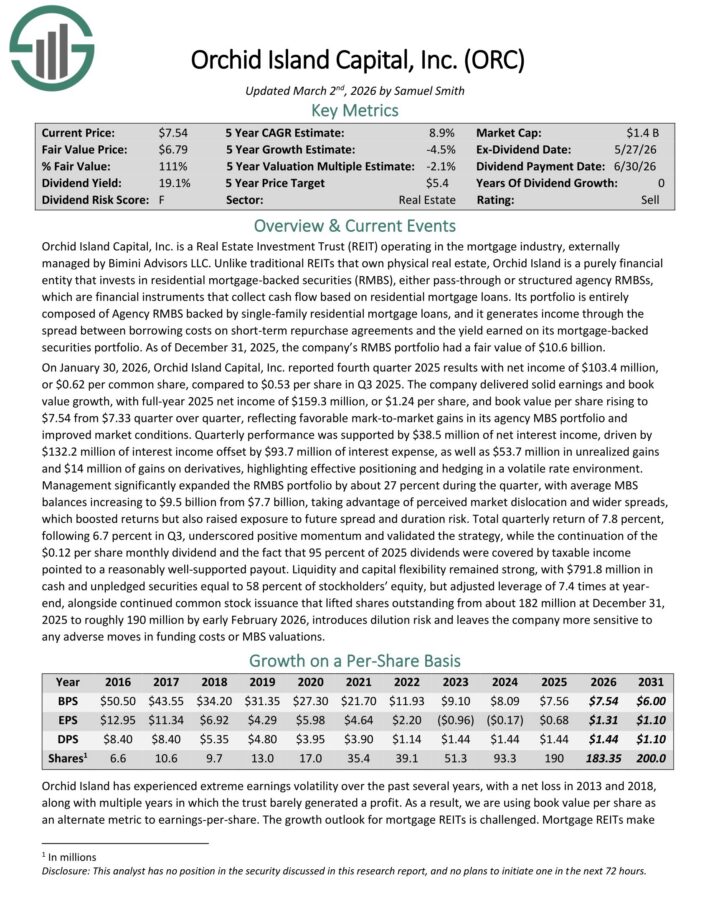
Orchid Island Capital, Inc. is an mREIT that is externally managed by Bimini Advisors LLC and focuses on investing in residential mortgage-backed securities (RMBS), including pass-through and structured agency RMBSs.
These financial instruments generate cash flow based on residential loans such as mortgages, subprime, and home-equity loans.
On January 30, 2026, Orchid Island Capital, Inc. reported fourth quarter 2025 results with net income of $103.4 million, or $0.62 per common share, compared to $0.53 per share in Q3 2025.
The company delivered solid earnings and book value growth, with full-year 2025 net income of $159.3 million, or $1.24 per share, and book value per share rising to $7.54 from $7.33 quarter over quarter, reflecting favorable mark-to-market gains in its agency MBS portfolio and improved market conditions.
Quarterly performance was supported by $38.5 million of net interest income, driven by $132.2 million of interest income offset by $93.7 million of interest expense, as well as $53.7 million in unrealized gains and $14 million of gains on derivatives, highlighting effective positioning and hedging in a volatile rate environment.
Click here to download our most recent Sure Analysis report on Orchid Island Capital, Inc. (ORC) (preview of page 1 of 3 shown below):
Undervalued High Dividend Stock #7: Prospect Capital (PSEC) – P/E ratio of 5.0
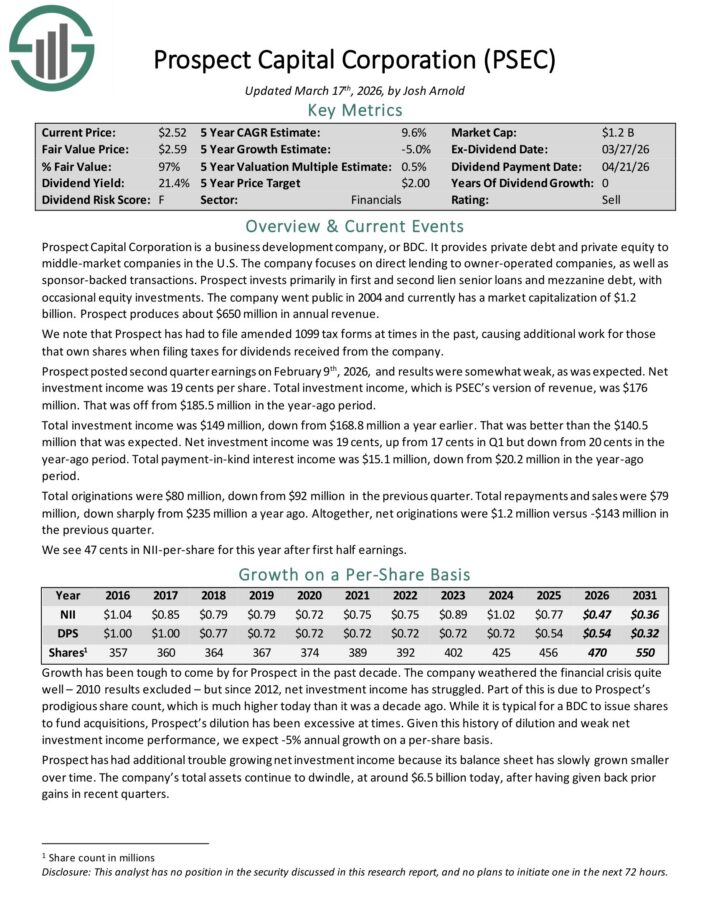
Prospect Capital Corporation is a Business Development Company, or BDC, that provides private debt and private equity to middle–market companies in the U.S.
The company focuses on direct lending to owner–operated companies, as well as sponsor–backed transactions. Prospect invests primarily in first and second lien senior loans and mezzanine debt, with occasional equity investments.
Prospect posted second quarter earnings on February 9th, 2026, and results were somewhat weak. Net investment income was 19 cents per share.
Total investment income, which is PSEC’s version of revenue, was $176 million. That was off from $185.5 million in the year-ago period.
Total investment income was $149 million, down from $168.8 million a year earlier. That was better than the $140.5 million that was expected.
Net investment income was 19 cents, up from 17 cents in Q1 but down from 20 cents in the year-ago period. Total payment-in-kind interest income was $15.1 million, down from $20.2 million in the year-ago period.
Total originations were $80 million, down from $92 million in the previous quarter. Total repayments and sales were $79 million, down sharply from $235 million a year ago.
Altogether, net originations were $1.2 million versus -$143 million in the previous quarter.
For 2026, we see 47 cents in NII-per-share for this year after first half earnings.
Click here to download our most recent Sure Analysis report on PSEC (preview of page 1 of 3 shown below):
Undervalued High Dividend Stock #8: Sunoco LP (SUN) – P/E ratio of 5.4
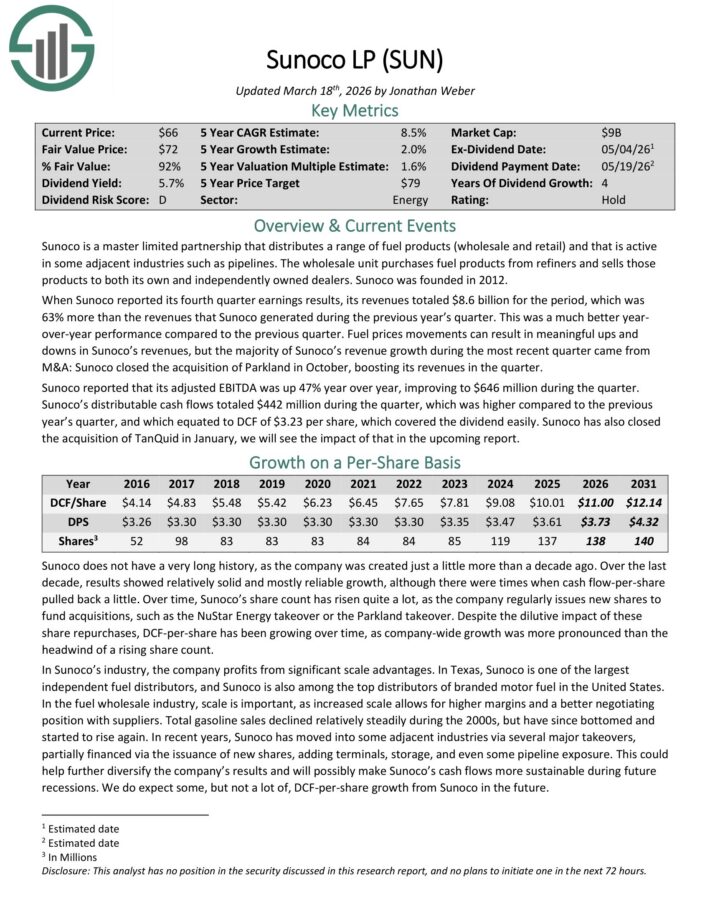
Sunoco is a master limited partnership that distributes a range of fuel products (wholesale and retail) and that is active in some adjacent industries such as pipelines.
The wholesale unit purchases fuel products from refiners and sells those products to both its own and independently owned dealers.
When Sunoco reported its fourth quarter earnings results, revenue totaled $8.6 billion for the period, which was 63% more than the revenues that Sunoco generated during the previous year’s quarter.
This was a much better year-over-year performance compared to the previous quarter. Fuel prices movements can result in meaningful ups and downs in Sunoco’s revenue, but the majority of Sunoco’s revenue growth during the most recent quarter came from acquisitions.
Sunoco closed the acquisition of Parkland in October, boosting its revenue in the quarter. Sunoco reported that its adjusted EBITDA was up 47% year over year, improving to $646 million during the quarter.
Distributable cash flows totaled $442 million during the quarter, which was higher compared to the previous year’s quarter, and which equated to DCF of $3.23 per share, which covered the dividend easily.
Click here to download our most recent Sure Analysis report on SUN (preview of page 1 of 3 shown below):
Undervalued High Dividend Stock #9: ARMOUR Residential REIT (ARR) – P/E ratio of 5.7
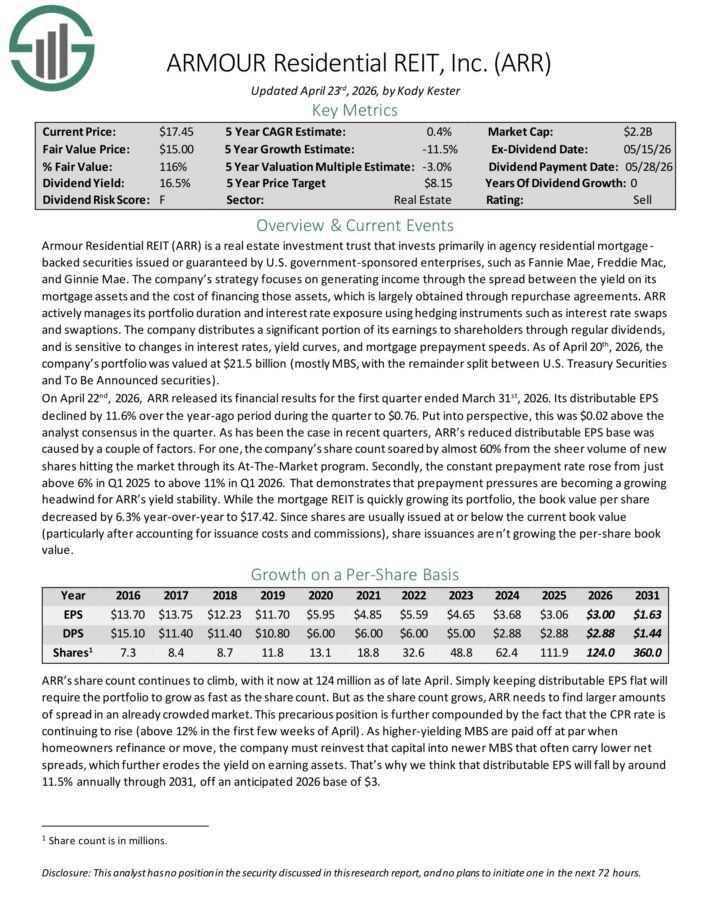
ARMOUR Residential invests in residential mortgage-backed securities that include U.S. Government-sponsored entities (GSE) such as Fannie Mae and Freddie Mac.
It also includes Ginnie Mae, the Government National Mortgage Administration’s issued or guaranteed securities backed by fixed-rate, hybrid adjustable-rate, and adjustable-rate home loans.
Unsecured notes and bonds issued by the GSE and the US Treasury, money market instruments, and non-GSE or government agency-backed securities are examples of other types of investments.
On April 22nd, 2026, ARR released its financial results for the first quarter ended March 31st, 2026. Its distributable EPS declined by 11.6% over the year-ago period during the quarter to $0.76. This was $0.02 above the analyst consensus in the quarter.
The reduced distributable EPS base was caused by a couple of factors. For one, the company’s share count soared by almost 60% from the sheer volume of new shares hitting the market through its At-The-Market program.
Secondly, the constant prepayment rate rose from just above 6% in Q1 2025 to above 11% in Q1 2026.
Book value per share decreased by 6.3% year-over-year to $17.42.
Click here to download our most recent Sure Analysis report on ARMOUR Residential REIT Inc (ARR) (preview of page 1 of 3 shown below):
Undervalued High Dividend Stock #10: Shutterstock, Inc. (SSTK) – P/E ratio of 5.7
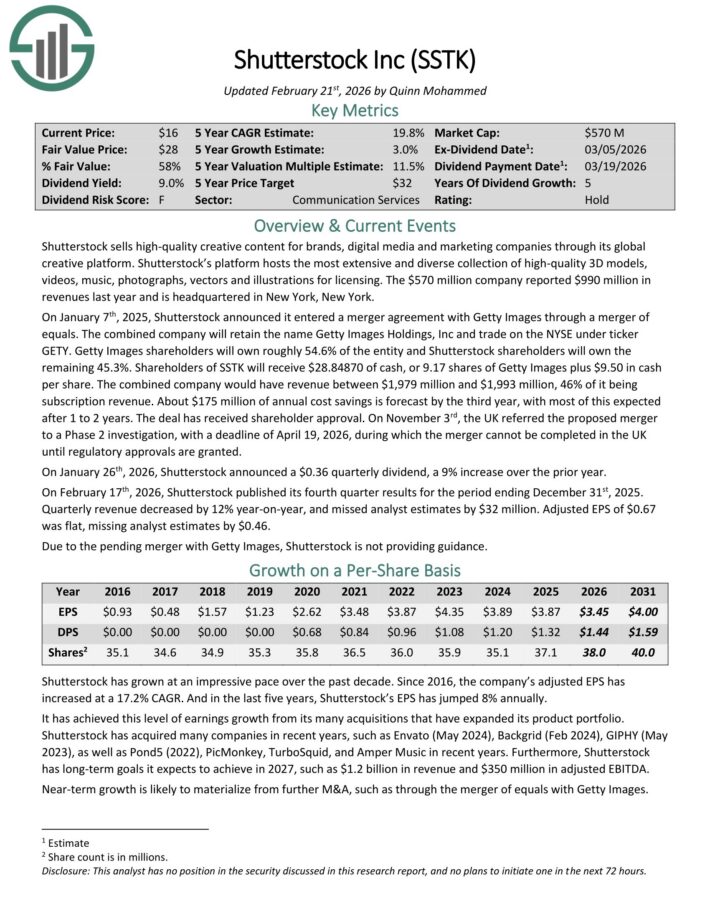
Shutterstock sells high-quality creative content for brands, digital media and marketing companies through its global creative platform.
Its platform hosts the most extensive and diverse collection of high-quality 3D models, videos, music, photographs, vectors and illustrations for licensing. The company reported $935 million in revenues last year.
On January 7th, 2025, Shutterstock announced it entered a merger agreement with Getty Images through a merger of equals. The combined company will retain the name Getty Images Holdings, Inc and trade on the NYSE under ticker GETY.
Getty Images shareholders will own roughly 54.6% of the entity and Shutterstock shareholders will own the remaining 45.3%. Shareholders of SSTK will receive $28.84870 of cash, or 9.17 shares of Getty Images plus $9.50 in cash per share.
The combined company would have revenue between $1,979 million and $1,993 million, 46% of it being subscription revenue. About $175 million of annual cost savings is forecast by the third year, with most of this expected after 1 to 2 years.
On January 26th, 2026, Shutterstock announced a $0.36 quarterly dividend, a 9% increase over the prior year.
On February 17th, 2026, Shutterstock published its fourth quarter results for the period ending December 31st, 2025. Quarterly revenue decreased by 12% year-on-year, and missed analyst estimates by $32 million. Adjusted EPS of $0.67 was flat, missing analyst estimates by $0.46.
Click here to download our most recent Sure Analysis report on SSTK (preview of page 1 of 3 shown below):
Undervalued High Dividend Stock #11: Virtus Investment Partners (VRTS) – P/E ratio of 5.8
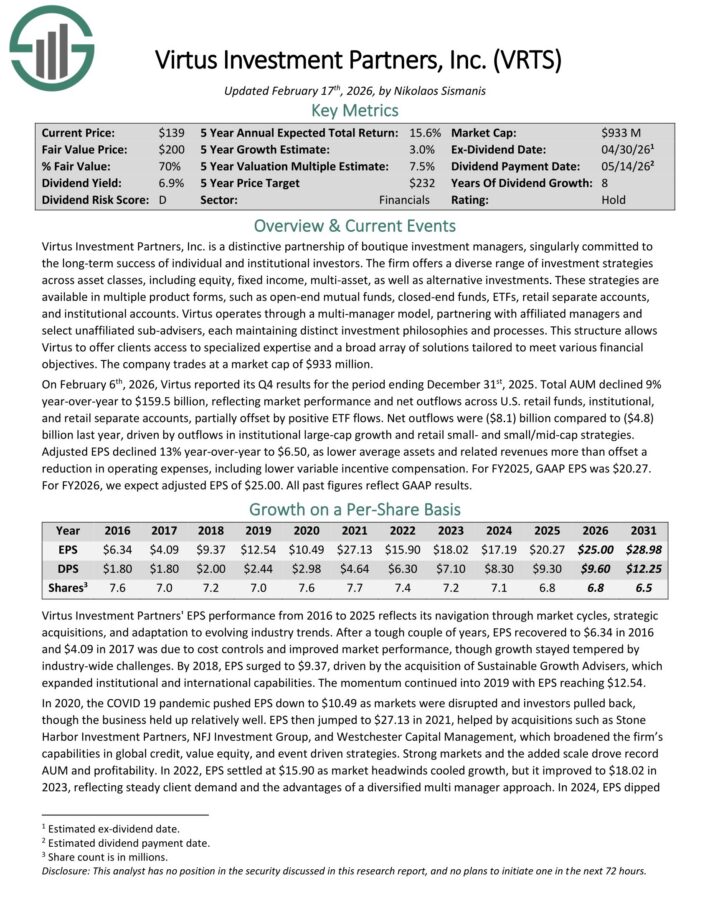
Virtus Investment Partners, Inc. is a distinctive partnership of boutique investment managers. The firm offers a diverse range of investment strategies across asset classes, including equity, fixed income, multi-asset, as well as alternative investments.
These strategies are available in multiple product forms, such as open-end mutual funds, closed-end funds, ETFs, retail separate accounts, and institutional accounts.
Virtus operates through a multi-manager model, partnering with affiliated managers and select unaffiliated sub-advisers, each maintaining distinct investment philosophies and processes.
This structure allows Virtus to offer clients access to specialized expertise and a broad array of solutions tailored to meet various financial objectives.
On February 6th, 2026, Virtus reported its Q4 results for the period ending December 31st, 2025. Total AUM declined 9% year-over-year to $159.5 billion, reflecting market performance and net outflows across U.S. retail funds, institutional, and retail separate accounts, partially offset by positive ETF flows.
Net outflows were ($8.1) billion compared to ($4.8) billion last year, driven by outflows in institutional large-cap growth and retail small- and small/mid-cap strategies.
Adjusted EPS declined 13% year-over-year to $6.50, as lower average assets and related revenues more than offset a reduction in operating expenses, including lower variable incentive compensation. For FY2025, GAAP EPS was $20.27.
Click here to download our most recent Sure Analysis report on VRTS (preview of page 1 of 3 shown below):
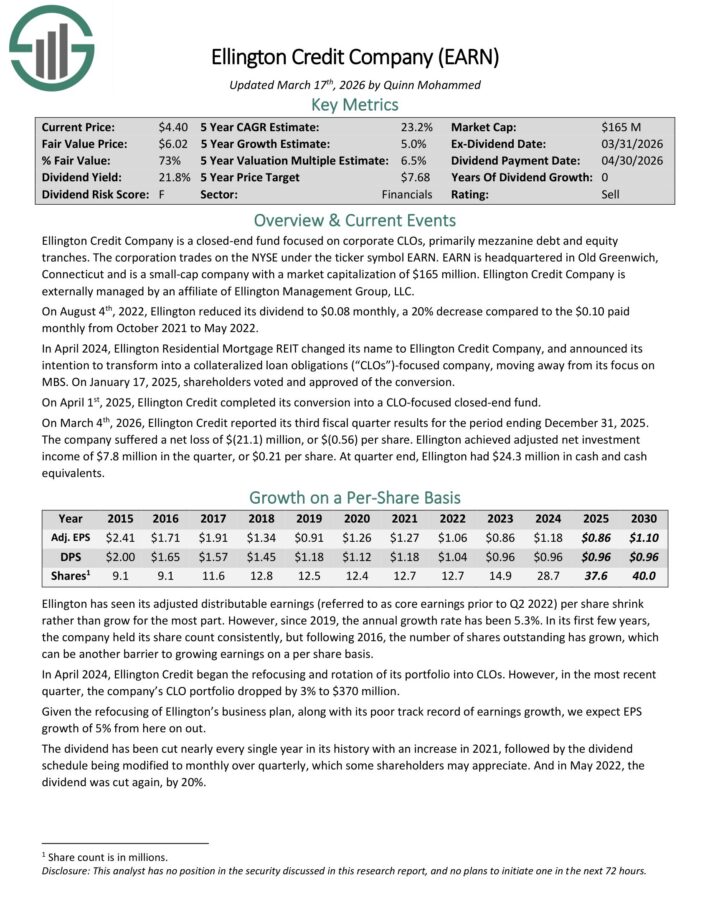
Undervalued High Dividend Stock #12: Ellington Credit Co. (EARN) – P/E ratio of 5.8
Ellington Credit Co. acquires, invests in, and manages residential mortgage and real estate related assets.
Ellington focuses primarily on residential mortgage-backed securities, specifically those backed by a U.S. Government agency or U.S. government–sponsored enterprise.
Agency MBS are created and backed by government agencies or enterprises, while non-agency MBS are not guaranteed by the government.
On March 4th, 2026, Ellington Credit reported its third fiscal quarter results for the period ending December 31, 2025. The company suffered a net loss of $(21.1) million, or $(0.56) per share.
Ellington achieved adjusted net investment income of $7.8 million in the quarter, or $0.21 per share. At quarter end, Ellington had $24.3 million in cash and cash equivalents.
Click here to download our most recent Sure Analysis report on EARN (preview of page 1 of 3 shown below):
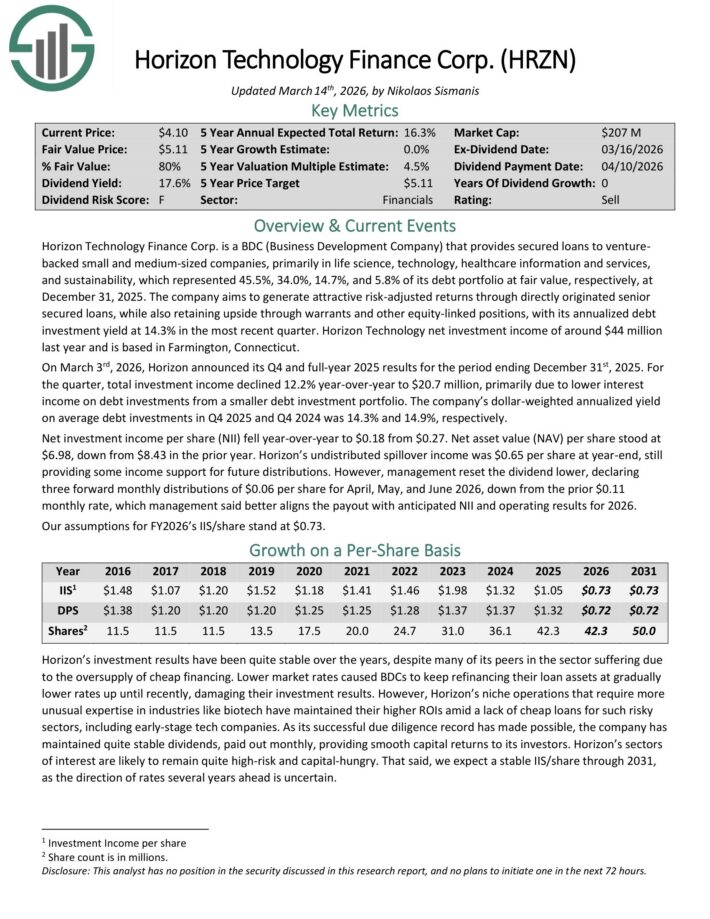
Undervalued High Dividend Stock #13: Horizon Technology Finance (HRZN) – P/E ratio of 6.0
Horizon Technology Finance Corp. is a BDC that provides venture capital to small and medium–sized companies in the technology, life sciences, and healthcare–IT sectors.
The company has generated attractive risk–adjusted returns through directly originated senior secured loans and additional capital appreciation through warrants.
On March 3rd, 2026, Horizon announced its Q4 and full-year 2025 results. For the quarter, total investment income declined 12.2% year-over-year to $20.7 million, primarily due to lower interest income on debt investments from a smaller debt investment portfolio.
The company’s dollar-weighted annualized yield on average debt investments in Q4 2025 and Q4 2024 was 14.3% and 14.9%, respectively.
Net investment income per share (NII) fell year-over-year to $0.18 from $0.27. Net asset value (NAV) per share stood at $6.98, down from $8.43 in the prior year.
Horizon’s undistributed spillover income was $0.65 per share at year-end, still providing some income support for future distributions.
Click here to download our most recent Sure Analysis report on HRZN (preview of page 1 of 3 shown below):
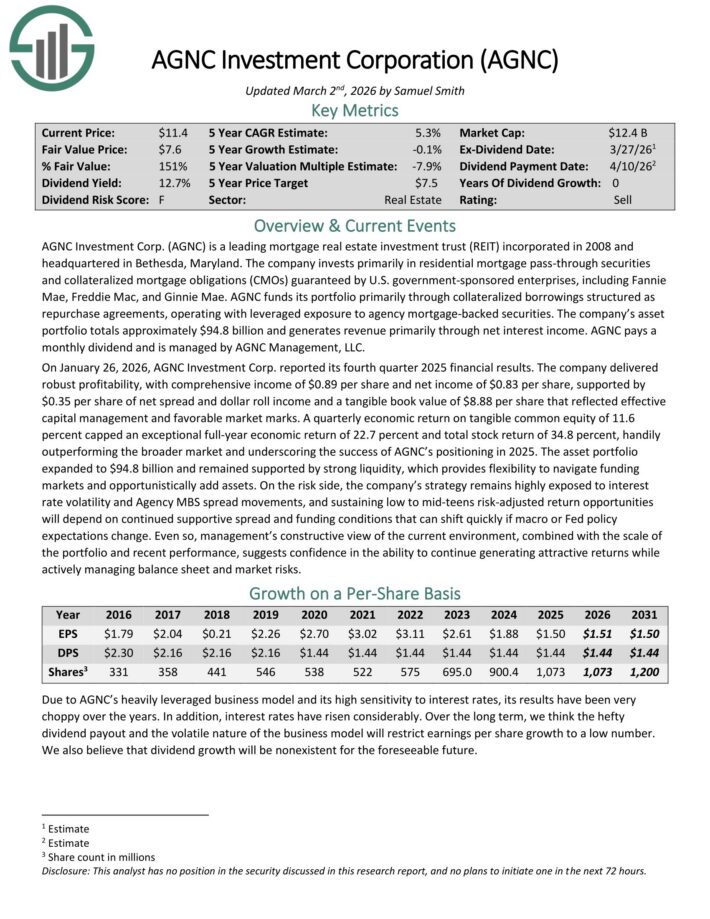
Undervalued High Dividend Stock #15: AGNC Investment Corporation (AGNC) – P/E ratio of 6.5
American Capital Agency Corp is a mortgage real estate investment trust that invests primarily in agency mortgage–backed securities (or MBS) on a leveraged basis.
The firm’s asset portfolio is comprised of residential mortgage pass–through securities, collateralized mortgage obligations (or CMO), and non–agency MBS. Many of these are guaranteed by government–sponsored enterprises.
On January 26, 2026, AGNC Investment Corp. reported its fourth quarter 2025 financial results. The company delivered robust profitability, with comprehensive income of $0.89 per share and net income of $0.83 per share.
Results were supported by $0.35 per share of net spread and dollar roll income and a tangible book value of $8.88 per share that reflected effective capital management and favorable market marks.
A quarterly economic return on tangible common equity of 11.6 percent capped an exceptional full-year economic return of 22.7 percent and total stock return of 34.8 percent, handily outperforming the broader market and underscoring the success of AGNC’s positioning in 2025.
The asset portfolio expanded to $94.8 billion and remained supported by strong liquidity, which provides flexibility to navigate funding markets and opportunistically add assets.
Click here to download our most recent Sure Analysis report on AGNC Investment Corp (AGNC) (preview of page 1 of 3 shown below):
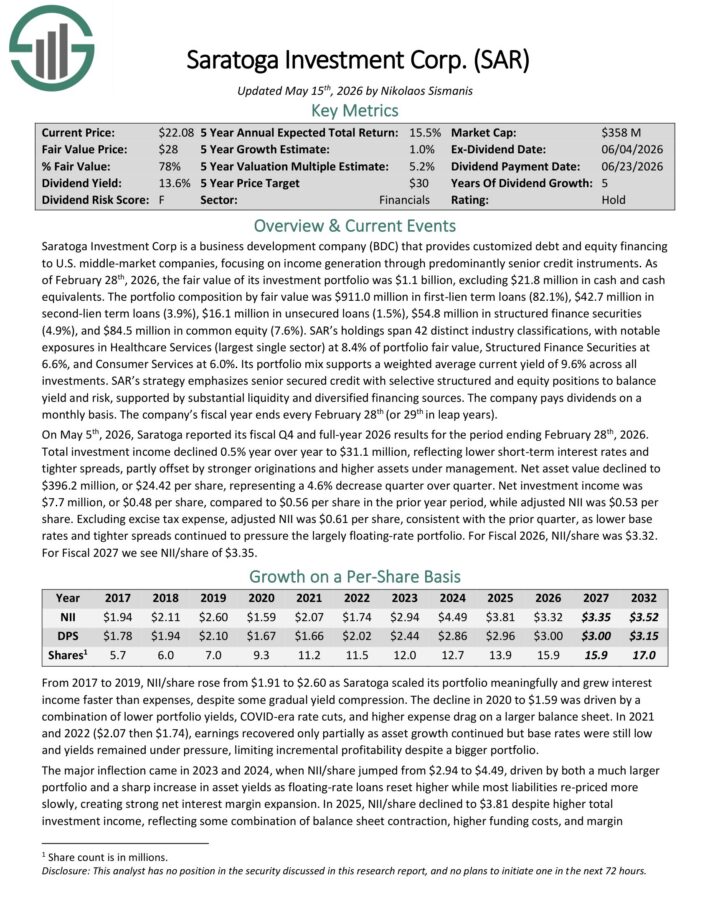
Undervalued High Dividend Stock #15: Saratoga Investment Corp. (SAR) – P/E ratio of 6.7
Saratoga Investment Corp is a BDC that provides customized debt and equity financing to U.S. middle-market companies, focusing on income generation through predominantly senior credit instruments.
As of February 28th, 2026, the fair value of its investment portfolio was $1.1 billion, excluding $21.8 million in cash and cash equivalents.
The portfolio composition by fair value was $911.0 million in first-lien term loans (82.1%), $42.7 million in second-lien term loans (3.9%), $16.1 million in unsecured loans (1.5%), $54.8 million in structured finance securities (4.9%), and $84.5 million in common equity (7.6%).
SAR’s holdings span 39 distinct industry classifications, with notable exposures in Healthcare Services (largest single sector) at 9.7% of portfolio fair value, Structured Finance Securities at 7.3%, and Consumer Services at 6.0%.
On May 5th, 2026, Saratoga reported its fiscal Q4 and full-year 2026 results. Total investment income declined 0.5% year over year to $31.1 million, reflecting lower short-term interest rates and tighter spreads, partly offset by stronger originations and higher assets under management.
Net asset value declined to $396.2 million, or $24.42 per share, representing a 4.6% decrease quarter over quarter. Net investment income was $7.7 million, or $0.48 per share, compared to $0.56 per share in the prior year period, while adjusted NII was $0.53 per share.
Click here to download our most recent Sure Analysis report on SAR (preview of page 1 of 3 shown below):
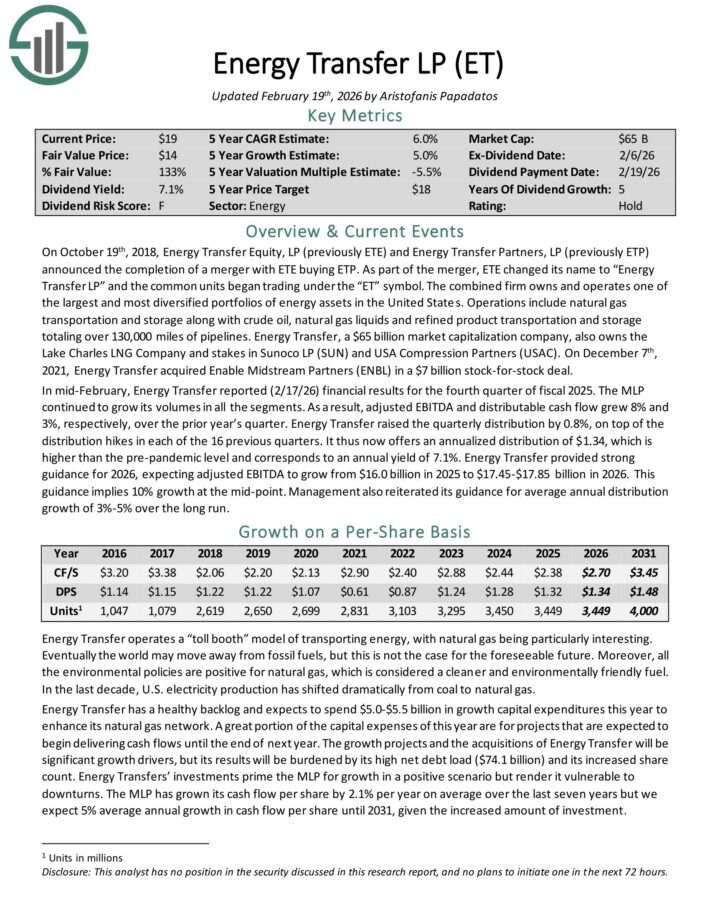
Undervalued High Dividend Stock #16: Energy Transfer LP (ET) – P/E ratio of 6.8
Energy Transfer LP owns and operates one of the largest and most diversified portfolios of energy assets in the United States.
Operations include natural gas transportation and storage along with crude oil, natural gas liquids and refined product transportation and storage totaling over 130,000 miles of pipelines.
Energy Transfer also owns the Lake Charles LNG Company and stakes in Sunoco LP (SUN) and USA Compression Partners (USAC).
In mid-February, Energy Transfer reported (2/17/26) financial results for the fourth quarter of fiscal 2025. The MLP continued to grow its volumes in all the segments.
As a result, adjusted EBITDA and distributable cash flow grew 8% and 3%, respectively, over the prior year’s quarter. Energy Transfer raised the quarterly distribution by 0.8%, on top of the distribution hikes in each of the 16 previous quarters.
Energy Transfer provided strong guidance for 2026, expecting adjusted EBITDA to grow from $16.0 billion in 2025 to $17.45-$17.85 billion in 2026. This guidance implies 10% growth at the mid-point.
Click here to download our most recent Sure Analysis report on ET (preview of page 1 of 3 shown below):
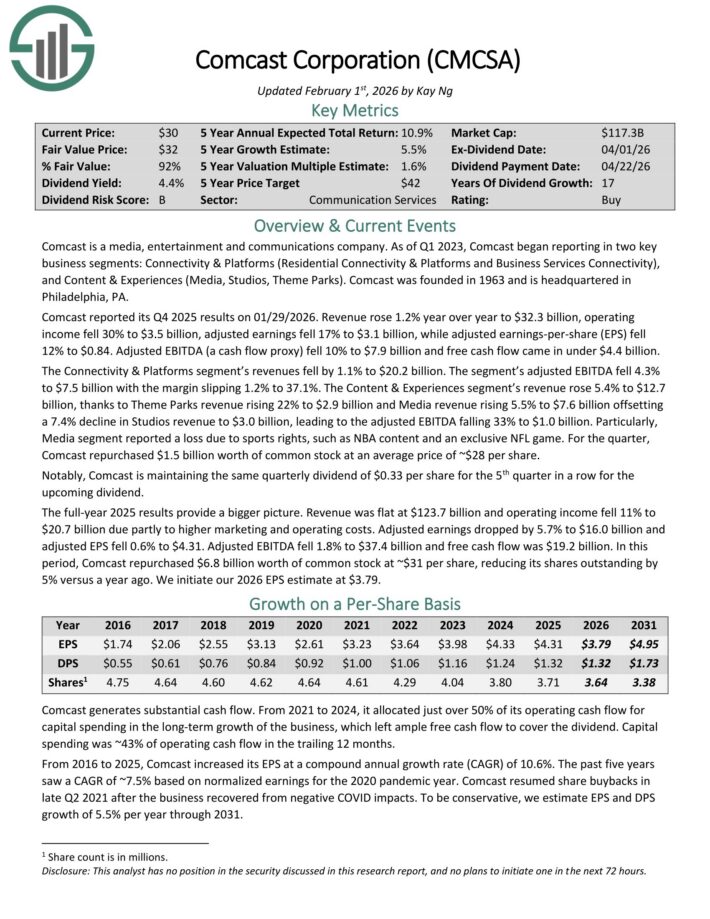
Undervalued High Dividend Stock #17: Comcast Corp. (CMCSA) – P/E ratio of 7.1
Comcast is a media, entertainment and communications company. It reports two key business segments: Connectivity & Platforms (Residential Connectivity & Platforms and Business Services Connectivity), and Content & Experiences (Media, Studios, Theme Parks).
Comcast reported its Q4 2025 results on 01/29/2026. Revenue rose 1.2% year over year to $32.3 billion, while operating income fell 30% to $3.5 billion.
Adjusted earnings fell 17% to $3.1 billion, while adjusted earnings-per-share fell 12% to $0.84. Adjusted EBITDA (a cash flow proxy) fell 10% to $7.9 billion and free cash flow came in under $4.4 billion.
The Connectivity & Platforms segment’s revenues fell by 1.1% to $20.2 billion. The segment’s adjusted EBITDA fell 4.3% to $7.5 billion with the margin slipping 1.2% to 37.1%.
The Content & Experiences segment’s revenue rose 5.4% to $12.7 billion, thanks to Theme Parks revenue rising 22% to $2.9 billion and Media revenue rising 5.5% to $7.6 billion offsetting a 7.4% decline in Studios revenue to $3.0 billion, leading to the adjusted EBITDA falling 33% to $1.0 billion.
Particularly, Media segment reported a loss due to sports rights, such as NBA content and an exclusive NFL game. For the quarter, Comcast repurchased $1.5 billion worth of common stock at an average price of ~$28 per share.
Click here to download our most recent Sure Analysis report on CMCSA (preview of page 1 of 3 shown below):
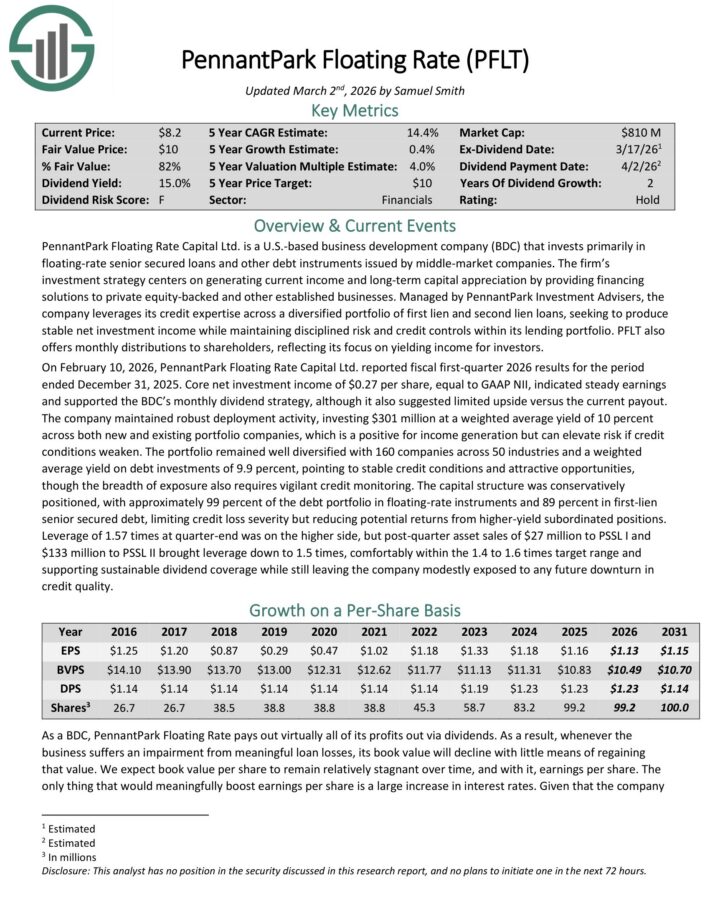
Undervalued High Dividend Stock #18: PennantPark Floating Rate Capital (PFLT) – P/E ratio of 7.4
PennantPark Floating Rate Capital Ltd. is a business development company that seeks to make secondary direct, debt, equity, and loan investments.
The fund also aims to invest through floating rate loans in private or thinly traded or small market-cap, public middle market companies, equity securities, preferred stock, common stock, warrants or options received in connection with debt investments or through direct investments.
On February 10, 2026, PennantPark Floating Rate Capital Ltd. reported fiscal first-quarter 2026 results for the period ended December 31, 2025.
Core net investment income of $0.27 per share, equal to GAAP NII, indicated steady earnings and supported the BDC’s monthly dividend strategy, although it also suggested limited upside versus the current payout.
The company maintained robust deployment activity, investing $301 million at a weighted average yield of 10% across both new and existing portfolio companies, which is a positive for income generation but can elevate risk if credit conditions weaken.
The portfolio remained well diversified with 160 companies across 50 industries and a weighted average yield on debt investments of 9.9%, pointing to stable credit conditions and attractive opportunities, though the breadth of exposure also requires vigilant credit monitoring.
Leverage of 1.57 times at quarter-end was on the higher side, but post-quarter asset sales of $27 million to PSSL I and $133 million to PSSL II brought leverage down to 1.5 times, comfortably within the 1.4 to 1.6 times target range and
supporting sustainable dividend coverage.
Click here to download our most recent Sure Analysis report on PFLT (preview of page 1 of 3 shown below):
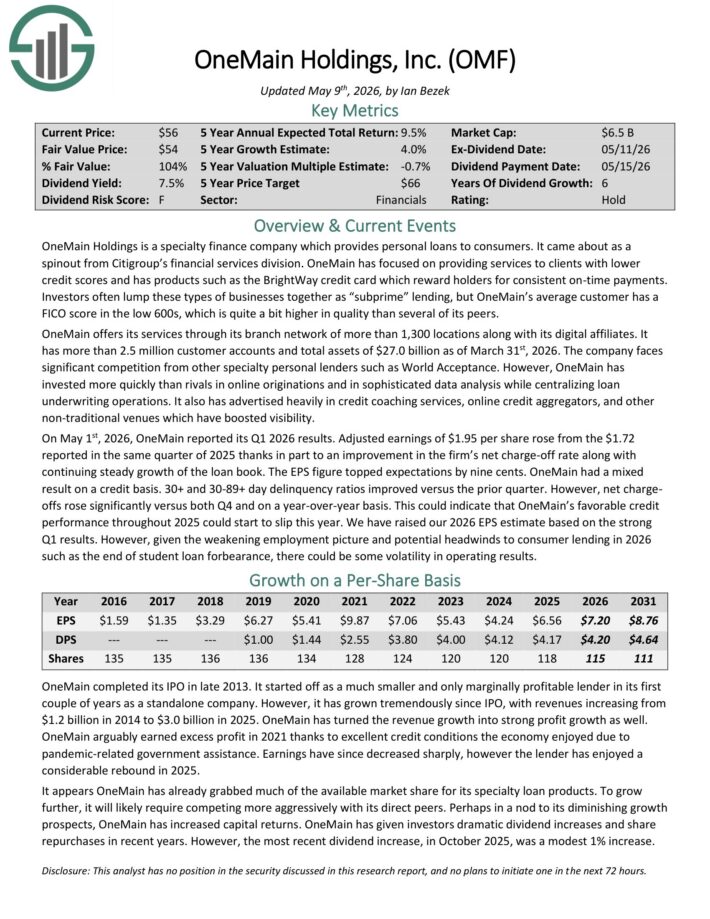
Undervalued High Dividend Stock #19: OneMain Holdings (OMF) – P/E ratio of 7.3
OneMain Holdings is a specialty finance company which provides personal loans to consumers. It has focused on providing services to clients with lower credit scores and has products such as the BrightWay credit card which reward holders for consistent on-time payments.
OneMain offers its services through its branch network of more than 1,300 locations along with its digital affiliates. It has more than 2.5 million customer accounts and total assets of $27.0 billion as of March 31st, 2026.
On May 1st, 2026, OneMain reported its Q1 2026 results. Adjusted earnings of $1.95 per share rose from the $1.72 reported in the same quarter of 2025 thanks in part to an improvement in the firm’s net charge-off rate along with continuing steady growth of the loan book.
The EPS figure topped expectations by nine cents. OneMain had a mixed result on a credit basis. 30+ and 30-89+ day delinquency ratios improved versus the prior quarter.
However, net charge-offs rose significantly versus both Q4 and on a year-over-year basis. This could indicate that OneMain’s favorable credit performance throughout 2025 could start to slip this year.
Click here to download our most recent Sure Analysis report on OMF (preview of page 1 of 3 shown below):
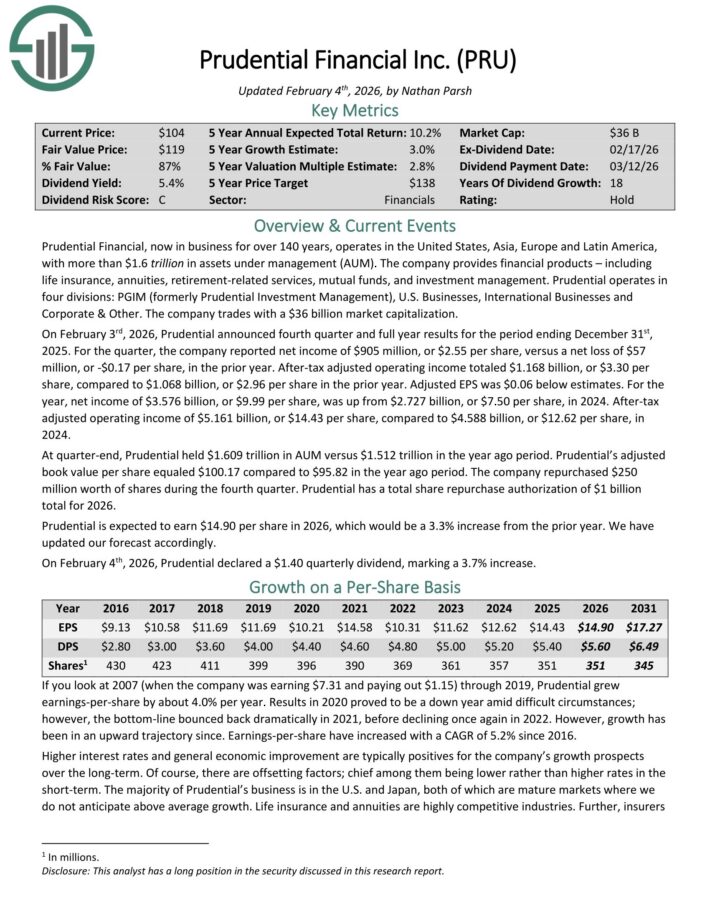
Undervalued High Dividend Stock #20: Prudential Financial (PRU) – P/E ratio of 8.0
Prudential Financial, now in business for over 140 years, operates in the United States, Asia, Europe and Latin America, with more than $1.6 trillion in assets under management (AUM).
The company provides financial products – including life insurance, annuities, retirement-related services, mutual funds, and investment management.
Prudential operates in four divisions: PGIM (formerly Prudential Investment Management), U.S. Businesses, International Businesses and Corporate & Other.
On February 3rd, 2026, Prudential announced fourth quarter and full year results. For the quarter, the company reported net income of $905 million, or $2.55 per share, versus a net loss of $57 million, or -$0.17 per share, in the prior year.
After-tax adjusted operating income totaled $1.168 billion, or $3.30 per share, compared to $1.068 billion, or $2.96 per share in the prior year. Adjusted EPS was $0.06 below estimates.
For the year, net income of $3.576 billion, or $9.99 per share, was up from $2.727 billion, or $7.50 per share, in 2024. Prudential is expected to earn $14.90 per share in 2026, which would be a 3.3% increase from the prior year.
On February 4th, 2026, Prudential declared a $1.40 quarterly dividend, marking a 3.7% increase.
Click here to download our most recent Sure Analysis report on PRU (preview of page 1 of 3 shown below):
Final Thoughts
All the above stocks are trading at remarkably cheap valuation levels due to some business headwinds. Some of them have been hurt by high inflation or the latest economic slowdown whereas others are facing their own specific issues.
Moreover, all the above stocks are offering dividend yields above 5%. As a result, they make it much easier for investors to wait patiently for the business headwinds to subside.
If you are interested in finding high-quality dividend growth stocks and/or other high-yield securities and income securities, the following Sure Dividend resources will be useful:
High-Yield Individual Security Research
- 20 High-Dividend Stocks Under $10
- 20 Highest Yielding Monthly Dividend Stocks
- 20 Highest-Yielding Small Cap Dividend Stocks
- 10 Super High Dividend REITs
- Highest Yielding Royalty Trusts
Other Sure Dividend Resources
- Dividend Kings: 50+ years of rising dividends
- Dividend Champions: 25+ years of rising dividends
- Dividend Aristocrats: 25+ years of rising dividends and in the S&P 500
- Monthly Dividend Stocks: Individual securities that pay out every month
- Blue Chip Stocks: Kings, Aristocrats, and Achievers
- MLPs: List of MLPs and more
- REITs: List of REITs and more
- BDCs: List of BDCs and more