Updated on June 12th, 2026 by Bob Ciura
Kevin O’Leary is Chairman of O’Shares Investment Advisors, but you probably know him as “Mr. Wonderful”.
He can be seen on CNBC as well as the television show Shark Tank. Investors who have seen him on TV have likely heard him discuss his investment philosophy.
Mr. Wonderful looks for stocks that exhibit three main characteristics:
- First, they must be quality companies with strong financial performance and solid balance sheets.
- Second, he believes a portfolio should be diversified across different market sectors.
- Third, and perhaps most important, he demands income—he insists the stocks he invests in pay dividends to shareholders.
You can download the complete list of all of O’Shares Investment Advisors stock holdings by clicking the link below:
OUSA owns stocks that display a mix of all three qualities. They are market leaders with strong profits, diversified business models, and they pay dividends to shareholders.
The list of OUSA portfolio holdings is an interesting source of quality dividend growth stocks.
This article analyzes the fund’s largest holdings in detail.
Table of Contents
The top 10 holdings from the O’Shares FTSE U.S. Quality Dividend ETF are listed in order of their weighting in the fund, from lowest to highest.
- Merck & Company (MRK)
- McDonald’s Corporation (MCD)
- Home Depot (HD)
- Microsoft Corporation (MSFT)
- MasterCard Inc. (MA)
- Cisco Systems (CSCO)
- Visa Inc. (V)
- Apple Inc. (AAPL)
- Johnson & Johnson (JNJ)
- Alphabet Inc. (GOOG)(GOOGL)
- Final Thoughts
- Additional Resources
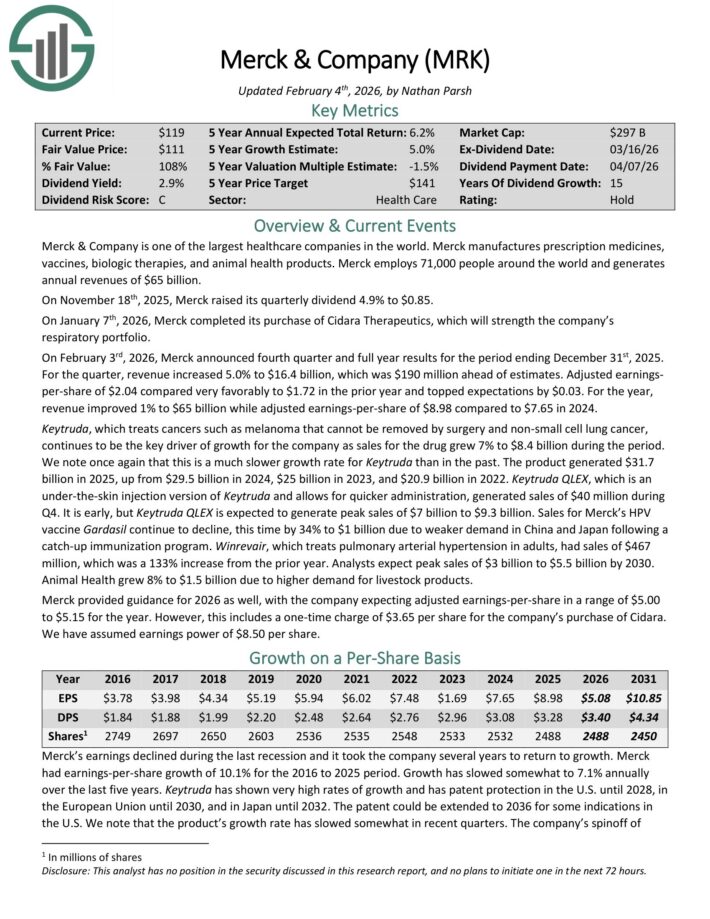
No. 10: Merck & Company (MRK)
Percentage of Portfolio: 3.0%
Merck & Company is one of the largest healthcare companies in the world. It manufactures prescription medicines,
vaccines, biologic therapies, and animal health products.
Merck employs 71,000 people around the world and generates annual revenue of $65 billion.
On January 7th, 2026, Merck completed its purchase of Cidara Therapeutics, which will strength the company’s respiratory portfolio.
On February 3rd, 2026, Merck announced fourth quarter and full year results. For the quarter, revenue increased 5.0% to $16.4 billion, which was $190 million ahead of estimates.
Adjusted earnings-per-share of $2.04 compared very favorably to $1.72 in the prior year and topped expectations by $0.03.
For the year, revenue improved 1% to $65 billion while adjusted earnings-per-share of $8.98 compared to $7.65 in 2024.
Keytruda, which treats cancers such as melanoma that cannot be removed by surgery and non-small cell lung cancer, continues to be the key driver of growth for the company as sales for the drug grew 7% to $8.4 billion during the period.
The product generated sales of $31.7 billion in 2025, up from $29.5 billion in 2024, $25 billion in 2023, and $20.9 billion in 2022.
Merck provided guidance for 2026 as well, with the company expecting adjusted earnings-per-share in a range of $5.00 to $5.15 for the year.
However, this includes a one-time charge of $3.65 per share for the company’s purchase of Cidara. We have assumed earnings power of $8.50 per share.
Click here to download our most recent Sure Analysis report on MRK (preview of page 1 of 3 shown below):
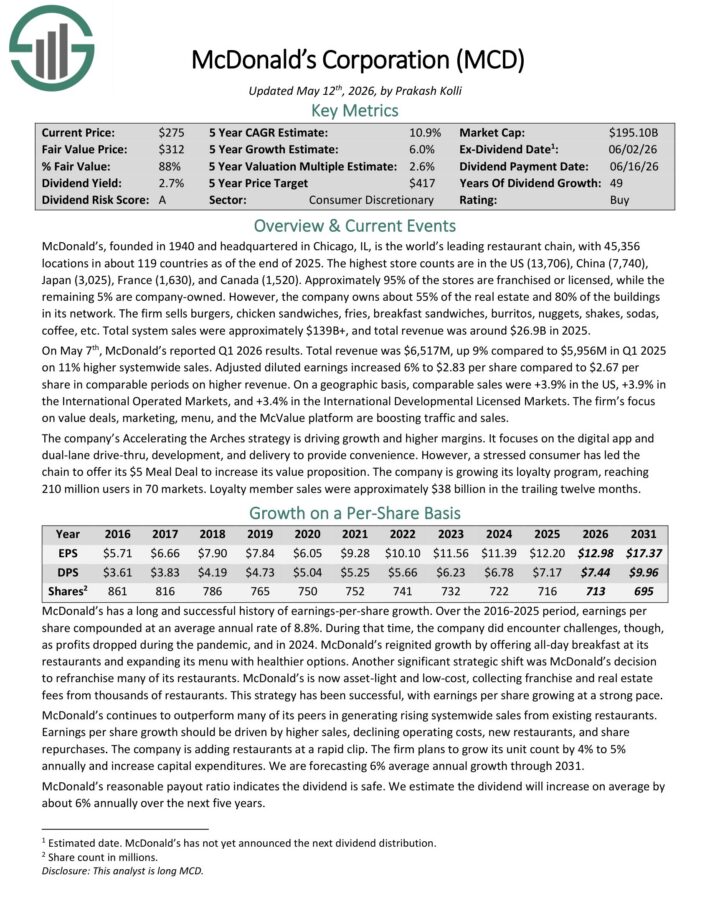
No. 9: McDonald’s Corporation (MCD)
Percentage of OUSA Portfolio: 3.5%
McDonald’s, founded in 1940 and headquartered in Chicago, IL, is the world’s leading restaurant chain, with 45,356 locations in about 119 countries as of the end of 2025.
The highest store counts are in the US (13,706), China (7,740), Japan (3,025), France (1,630), and Canada (1,520).
Approximately 95% of the stores are franchised or licensed, while the remaining 5% are company-owned. However, the company owns about 55% of the real estate and 80% of the buildings in its network.
Total system sales were approximately $139B+, and total revenue was around $26.9B in 2025.
On May 7th, McDonald’s reported Q1 2026 results. Total revenue was $6,517M, up 9% compared to $5,956M in Q1 2025 on 11% higher system-wide sales.
Adjusted diluted earnings increased 6% to $2.83 per share compared to $2.67 per share in comparable periods on higher revenue.
On a geographic basis, comparable sales were +3.9% in the US, +3.9% in the International Operated Markets, and +3.4% in the International Developmental Licensed Markets.
The firm’s focus on value deals, marketing, menu, and the McValue platform are boosting traffic and sales.
Click here to download our most recent Sure Analysis report on MCD (preview of page 1 of 3 shown below):
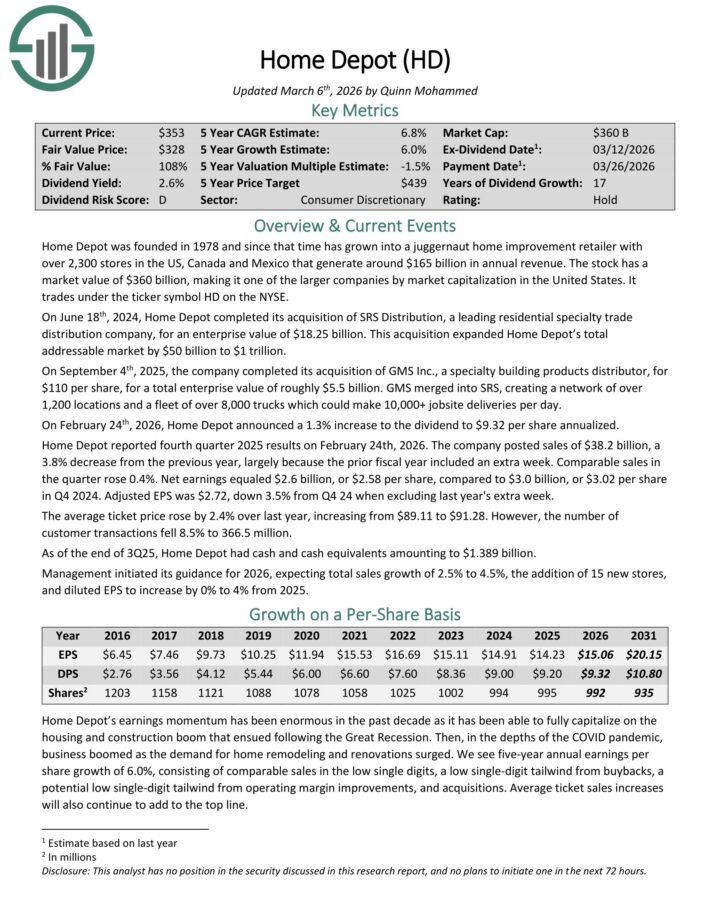
No. 8: Home Depot (HD)
Percentage of OUSA Portfolio: 3.8%
Home Depot was founded in 1978 and since that time has grown into a juggernaut home improvement retailer with over 2,300 stores in the US, Canada and Mexico that generate around $153 billion in annual revenue.
On September 4th, 2025, the company completed its acquisition of GMS Inc., a specialty building products distributor, for $110 per share, for a total enterprise value of roughly $5.5 billion.
GMS merged into SRS, creating a network of over 1,200 locations and a fleet of over 8,000 trucks which could make 10,000+ jobsite deliveries per day.
On February 24th, 2026, Home Depot announced a 1.3% increase to the dividend to $9.32 per share annualized.
Home Depot reported fourth quarter 2025 results on February 24th, 2026. The company posted sales of $38.2 billion, a 3.8% decrease from the previous year, largely because the prior fiscal year included an extra week.
Comparable sales in the quarter rose 0.4%. Net earnings equaled $2.6 billion, or $2.58 per share, compared to $3.0 billion, or $3.02 per share in Q4 2024. Adjusted EPS was $2.72, down 3.5% from Q4 24 when excluding last year’s extra week.
The average ticket price rose by 2.4% over last year, increasing from $89.11 to $91.28. However, the number of customer transactions fell 8.5% to 366.5 million.
As of the end of 3Q25, Home Depot had cash and cash equivalents amounting to $1.389 billion.
Management initiated its guidance for 2026, expecting total sales growth of 2.5% to 4.5%, the addition of 15 new stores, and diluted EPS to increase by 0% to 4% from 2025.
Click here to download our most recent Sure Analysis report on HD (preview of page 1 of 3 shown below):
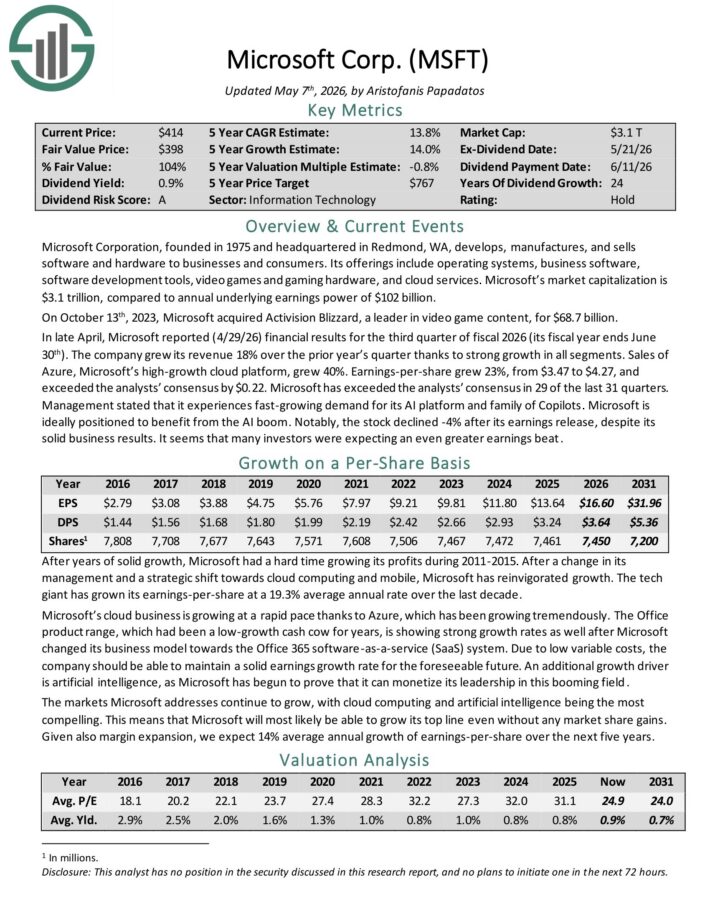
No. 7: Microsoft Corporation (MSFT)
Percentage of OUSA Portfolio: 3.9%
Microsoft Corporation manufactures and sells software and hardware to businesses and consumers. Its offerings include operating systems, business software, software development tools, video games and gaming hardware, and cloud services.
In late April, Microsoft reported (4/29/26) financial results for the third quarter of fiscal 2026 (its fiscal year ends June 30th). The company grew its revenue 18% over the prior year’s quarter thanks to strong growth in all segments.
Sales of Azure, Microsoft’s high-growth cloud platform, grew 40%. Earnings-per-share grew 23%, from $3.47 to $4.27, and exceeded the analysts’ consensus by $0.22.
Microsoft has exceeded the analysts’ consensus in 29 of the last 31 quarters.
The tech giant has grown its earnings-per-share at a 19.3% average annual rate over the last decade. Microsoft’s cloud business is growing at a rapid pace thanks to Azure, which has been growing tremendously.
The Office product range is showing strong growth rates as well after Microsoft changed its business model towards the Office 365 software-as-a-service (SaaS) system.
Click here to download our most recent Sure Analysis report on MSFT (preview of page 1 of 3 shown below):
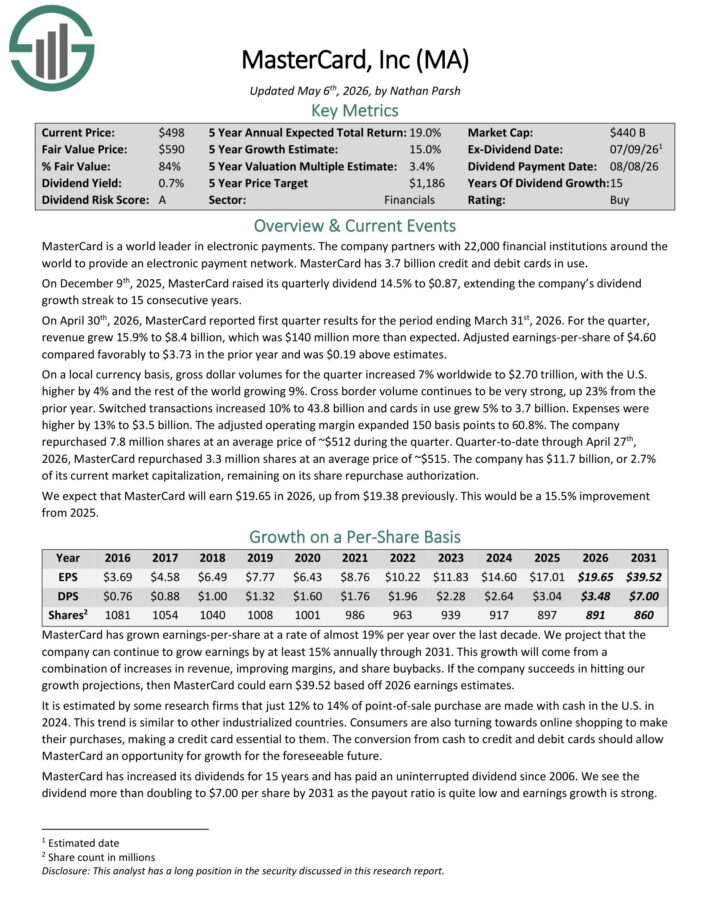
No. 6: MasterCard Inc. (MA)
Percentage of OUSA Portfolio: 4.1%
MasterCard is a world leader in electronic payments. The company partners with 25,000 financial institutions around the world to provide an electronic payment network.
MasterCard has more than 3.1 billion credit and debit cards in use.
On April 30th, 2026, MasterCard reported first quarter results for the period ending March 31st, 2026. For the quarter, revenue grew 15.9% to $8.4 billion, which was $140 million more than expected.
Adjusted earnings-per-share of $4.60 compared favorably to $3.73 in the prior year and was $0.19 above estimates.
On a local currency basis, gross dollar volumes for the quarter increased 7% worldwide to $2.70 trillion, with the U.S. higher by 4% and the rest of the world growing 9%.
Cross border volume continues to be very strong, up 23% from the prior year. Switched transactions increased 10% to 43.8 billion and cards in use grew 5% to 3.7 billion. Expenses were higher by 13% to $3.5 billion.
The adjusted operating margin expanded 150 basis points to 60.8%. The company repurchased 7.8 million shares at an average price of ~$512 during the quarter.
Quarter-to-date through April 27th, 2026, MasterCard repurchased 3.3 million shares at an average price of ~$515.
The company has $11.7 billion, or 2.7% of its current market capitalization, remaining on its share repurchase authorization.
Click here to download our most recent Sure Analysis report on Mastercard (preview of page 1 of 3 shown below):
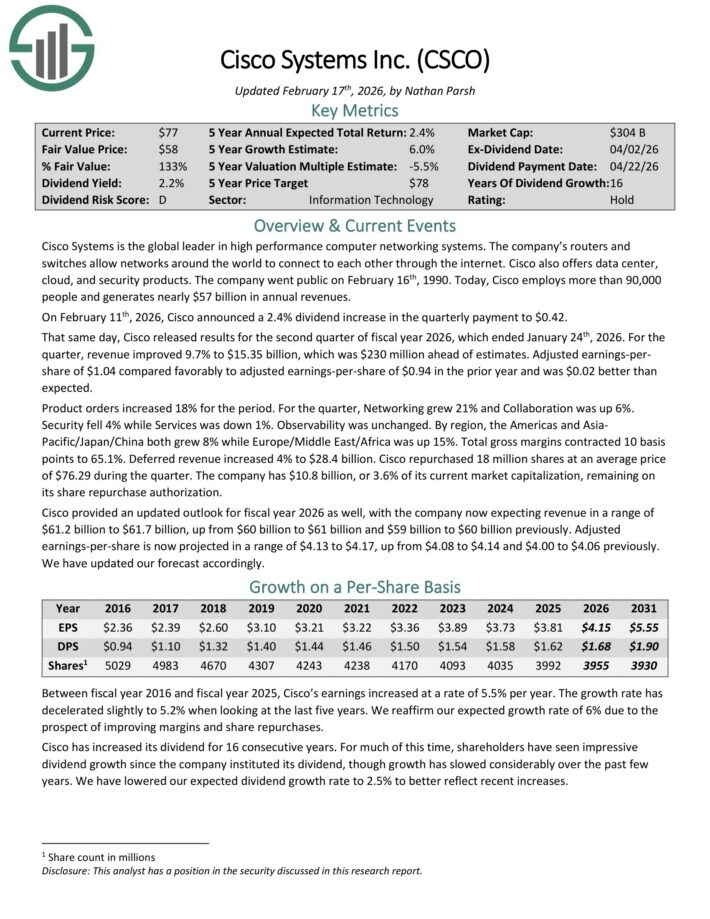
No. 5: Cisco Systems (CSCO)
Percentage of OUSA Portfolio: 3.8%
Cisco Systems is the global leader in high performance computer networking systems. The company’s routers and switches allow networks around the world to connect to each other through the internet.
Cisco also offers data center, cloud, and security products. Cisco generates nearly $57 billion in annual revenue.
On February 11th, 2026, Cisco announced a 2.4% dividend increase in the quarterly payment to $0.42.
That same day, Cisco released results for the second quarter of fiscal year 2026, which ended January 24th, 2026. For the quarter, revenue improved 9.7% to $15.35 billion, which was $230 million ahead of estimates.
Adjusted earnings-per-share of $1.04 compared favorably to adjusted earnings-per-share of $0.94 in the prior year and was $0.02 better than expected.
Cisco repurchased 18 million shares at an average price of $76.29 during the quarter. The company has $10.8 billion, or 3.6% of its current market capitalization, remaining on its share repurchase authorization.
Cisco provided an updated outlook for fiscal year 2026 as well, with the company now expecting revenue in a range of $61.2 billion to $61.7 billion. Adjusted earnings-per-share is now projected in a range of $4.13 to $4.17.
Click here to download our most recent Sure Analysis report on CSCO (preview of page 1 of 3 shown below):
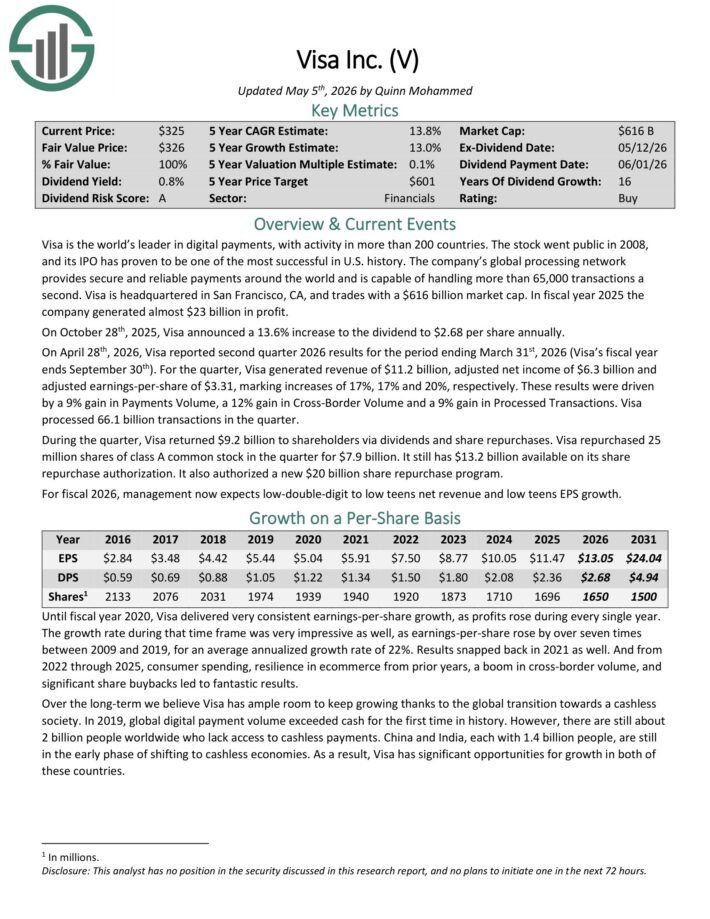
No. 4: Visa Inc. (V)
Percentage of OUSA Portfolio: 4.6%
Visa is the world’s leader in digital payments, with activity in more than 200 countries. The company’s global processing network provides secure and reliable payments around the world and is capable of handling more than 65,000 transactions a second.
On April 28th, 2026, Visa reported second quarter 2026 results for the period ending March 31st, 2026 (Visa’s fiscal year ends September 30th).
For the quarter, Visa generated revenue of $11.2 billion, adjusted net income of $6.3 billion and adjusted earnings-per-share of $3.31, marking increases of 17%, 17% and 20%, respectively.
These results were driven by a 9% gain in Payments Volume, a 12% gain in Cross-Border Volume and a 9% gain in Processed Transactions.
Visa processed 66.1 billion transactions in the quarter.
During the quarter, Visa returned $9.2 billion to shareholders via dividends and share repurchases. Visa repurchased 25 million shares of class A common stock in the quarter for $7.9 billion.
It still has $13.2 billion available on its share repurchase authorization. It also authorized a new $20 billion share repurchase program.
Click here to download our most recent Sure Analysis report on Visa (preview of page 1 of 3 shown below):
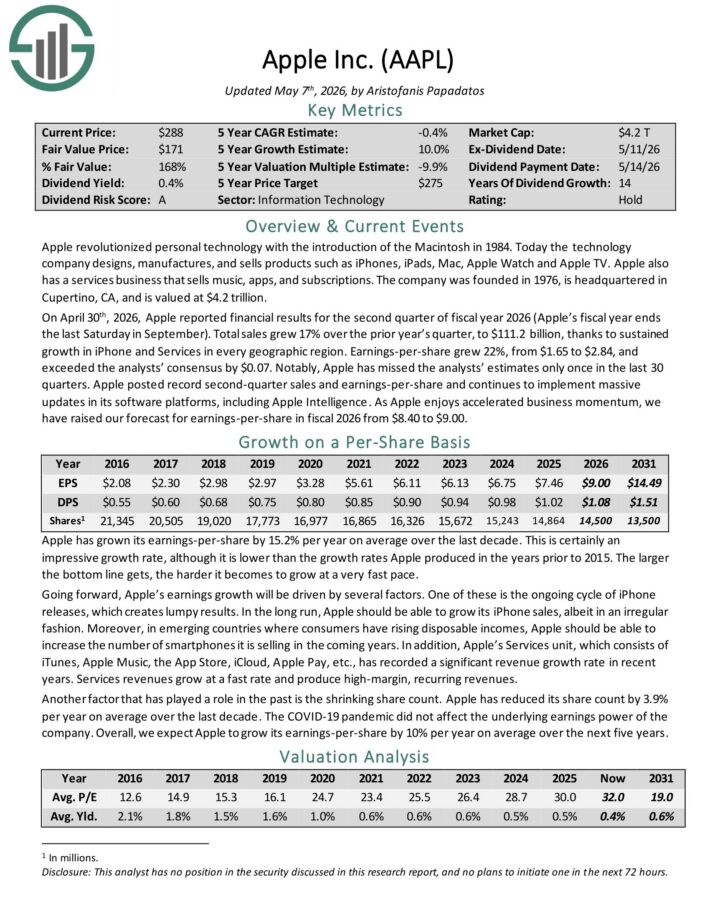
No. 3: Apple (AAPL)
Percentage of OUSA Portfolio: 5.3%
Apple is a technology company that designs, manufactures, and sells products such as iPhones, iPads, Mac, Apple Watch and Apple TV. Apple also has a services business that sells music, apps, and subscriptions.
On April 30th, 2026, Apple reported financial results for the second quarter of fiscal year 2026. Total sales grew 17% over the prior year’s quarter, to $111.2 billion, thanks to sustained growth in iPhone and Services in every geographic region.
Earnings-per-share grew 22%, from $1.65 to $2.84, and exceeded the analysts’ consensus by $0.07. Notably, Apple has missed the analysts’ estimates only once in the last 30 quarters.
Apple posted record second-quarter sales and earnings-per-share and continues to implement massive updates in its software platforms, including Apple Intelligence.
Click here to download our most recent Sure Analysis report on AAPL (preview of page 1 of 3 shown below):
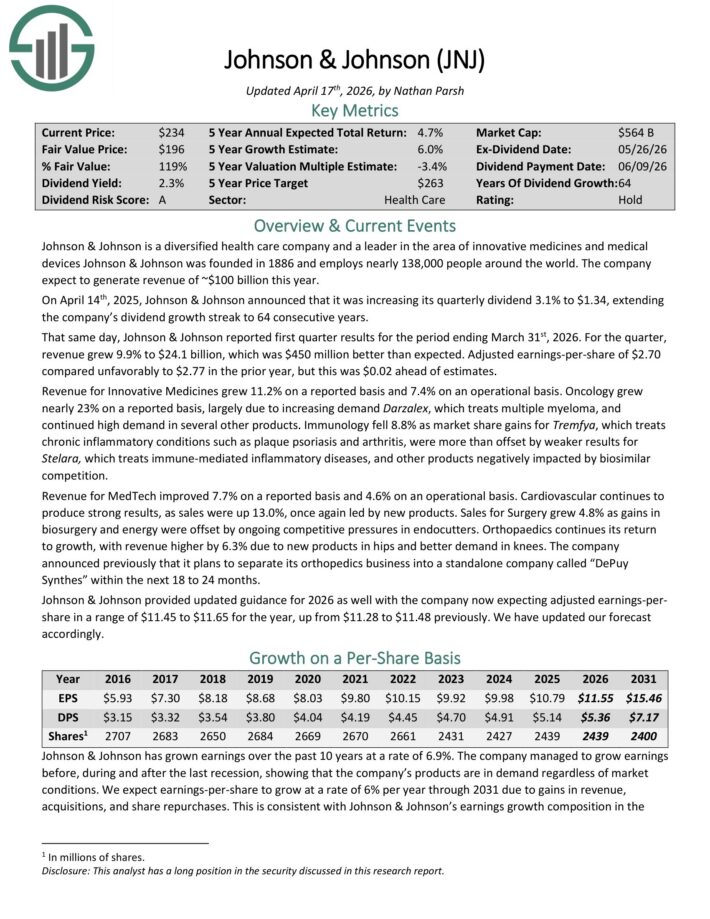
No. 2: Johnson & Johnson (JNJ)
Percentage of OUSA Portfolio: 5.4%
Johnson & Johnson is a diversified health care company and a leader in the area of innovative medicines and medical devices.
Johnson & Johnson was founded in 1886 and the company expects to generate revenue of ~$100 billion this year. J&J has increased its dividend for 64 consecutive years.
Johnson & Johnson reported first quarter results for the period ending March 31st, 2026. For the quarter, revenue grew 9.9% to $24.1 billion, which was $450 million better than expected.
Adjusted earnings-per-share of $2.70 compared unfavorably to $2.77 in the prior year, but this was $0.02 ahead of estimates.
Revenue for Innovative Medicines grew 11.2% on a reported basis and 7.4% on an operational basis. Oncology grew nearly 23% on a reported basis, largely due to increasing demand Darzalex, which treats multiple myeloma.
Revenue for MedTech improved 7.7% on a reported basis and 4.6% on an operational basis. Cardiovascular continues to produce strong results, as sales were up 13.0%, once again led by new products.
The company announced previously that it plans to separate its orthopedics business into a standalone company called “DePuy Synthes” within the next 18 to 24 months.
Johnson & Johnson provided updated guidance for 2026 as well with the company now expecting adjusted earnings-per-share in a range of $11.45 to $11.65 for the year.
Click here to download our most recent Sure Analysis report on JNJ (preview of page 1 of 3 shown below):
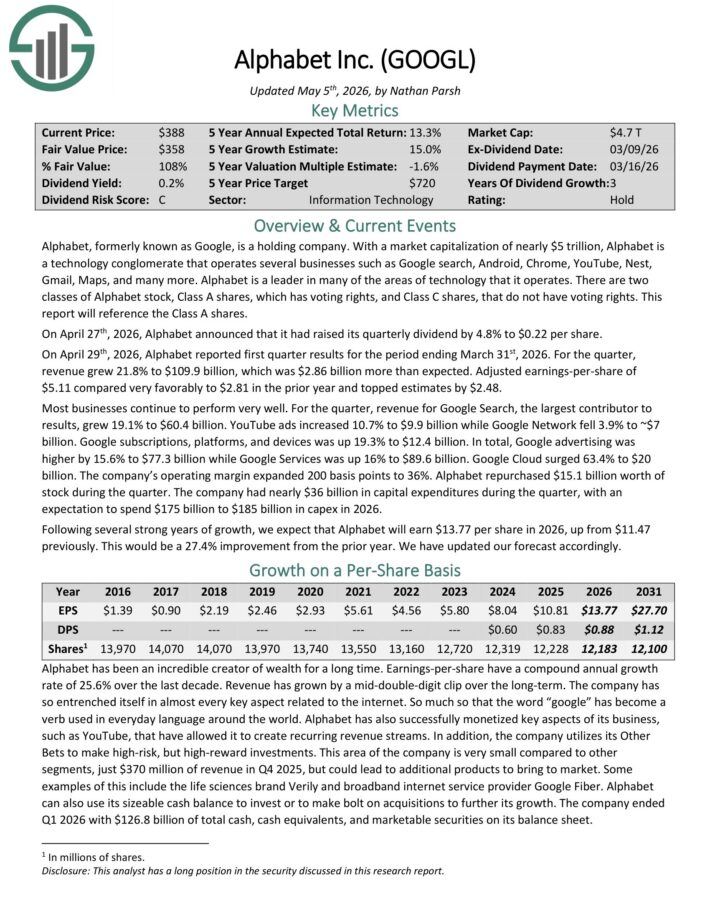
No. 1: Alphabet Inc. (GOOGL)
Percentage of OUSA Portfolio: 5.7%
Alphabet is a technology conglomerate that operates several businesses such as Google search, Android, Chrome, YouTube, Nest, Gmail, Maps, and many more. Alphabet is a leader in many of the areas of technology that it operates.
There are two classes of Alphabet stock, Class A shares, which has voting rights, and Class C shares, that do not have voting rights.
On April 27th, 2026, Alphabet announced that it had raised its quarterly dividend by 4.8% to $0.22 per share.
On April 29th, 2026, Alphabet reported first quarter results for the period ending March 31st, 2026. For the quarter, revenue grew 21.8% to $109.9 billion, which was $2.86 billion more than expected.
Adjusted earnings-per-share of $5.11 compared very favorably to $2.81 in the prior year and topped estimates by $2.48.
Most businesses continue to perform very well. For the quarter, revenue for Google Search, the largest contributor to results, grew 19.1% to $60.4 billion.
YouTube ads increased 10.7% to $9.9 billion while Google Network fell 3.9% to ~$7 billion. Google subscriptions, platforms, and devices was up 19.3% to $12.4 billion.
In total, Google advertising was higher by 15.6% to $77.3 billion while Google Services was up 16% to $89.6 billion.
Click here to download our most recent Sure Analysis report on GOOGL (preview of page 1 of 3 shown below):
Final Thoughts
Kevin O’Leary has become a household name due to his appearances on the TV show Shark Tank. But he is also a well-known asset manager, and his investment philosophy largely aligns with Sure Dividend’s.
Specifically, Mr. Wonderful typically invests in stocks with large and profitable businesses, with strong balance sheets and consistent dividend growth every year.
Not all of these stocks are currently rated as buys in the Sure Analysis Research Database, which ranks stocks based on expected total return due to a combination of earnings per share growth, dividends, and changes in the price-to-earnings multiple.
However, several of these 10 stocks are valuable holdings for a long-term dividend growth portfolio.
Additional Resources
If you are interested in finding more high-quality dividend growth stocks suitable for long-term investment, the following Sure Dividend databases will be useful:
- The Dividend Kings List is even more exclusive than the Dividend Aristocrats. It is comprised of 58 stocks with 50+ years of consecutive dividend increases.
- The 20 Highest Yielding Dividend Kings
- The Dividend Champions List: stocks that have increased their dividends for 25+ consecutive years.
Note: Not all Dividend Champions are Dividend Aristocrats because Dividend Aristocrats have additional requirements like being in The S&P 500. - The Monthly Dividend Stocks List: contains stocks that pay dividends each month, for 12 payments per year.
- The 20 Highest Yielding Monthly Dividend Stocks
- The High Dividend Stocks List: high dividend stocks are suited for investors that need income now (as opposed to growth later) by listing stocks with 5%+ dividend yields.
The major domestic stock market indices are another solid resource for finding investment ideas. Sure Dividend compiles the following stock market databases and updates them monthly: