Updated on June 16th, 2026 by Bob Ciura
The goal of most investors is to either:
- Maximize returns given a fixed level of risk
- Minimize risk given a particularly level of desired returns
Perhaps the best metric for analyzing both risk and return is the Sharpe Ratio. With that in mind, we’ve compiled a list of the 100 stocks in the S&P 500 Index with the highest Sharpe Ratios.
You can download your free list of high Sharpe Ratio stocks (along with relevant financial metrics like dividend yields and price-to-earnings ratios) by clicking on the link below:
Keep reading this article to learn more about using the Sharpe Ratio to analyze publicly-traded stocks.
Table Of Contents
The table of contents below provides for easy navigation of the article:
- What Is The Sharpe Ratio?
- How To Use The Sharpe Ratio Stocks List To Find Compelling Investment Ideas
- The Top 10 Sharpe Ratio Stocks Today
- Final Thoughts
What Is The Sharpe Ratio?
The Sharpe ratio is the financial industry’s favorite measure of risk-adjusted returns. It tells investors whether they are being appropriately rewarded for the risks they’re assuming in their investments.
There are three components to the Sharpe Ratio calculation:
- Investment return
- Risk free rate of return
- Investment standard deviation
For most investors, a suitable Risk-free rate of return is the current yield on 10-year U.S. government bonds. For this article, we have used a risk free rate of 0, as interest rates have declined significantly.
For our purposes here, the Investment return can be either a historical return or an expected annual return. It is expressed using a decimal; for example, 0.51 would represent a 51% return.
Note: We use 252 instead of 365 – the number of days in a year – for a one-year period because there are approximately 252 trading days in an average calendar year, or we may employ 757 or a slight variant of that for a specific three-year period.
We employ the calculated Investment standard deviation, usually based on daily variations, to take into account periodic fluctuations in the investment due to such things as dividends and stock splits.
Determination of the Sharpe ratio can require a large number of repetitive calculations. This can be done easily and conveniently via a Microsoft Excel spreadsheet, as will be demonstrated later.
The Sharpe ratio is calculated with the following formula:

The risk free rate of return can be different depending on your use case. For risk-free rate of return = 0, the equation for the Sharpe ratio reduces to:
 Examination of this simplified equation reveals the meaning of the Sharpe ratio. It displays the Investment Return as a comparative function of the Investment Risk, or the amount of principal involved.
As you might imagine, numerous complex variants of this simplified formula have been developed and used for a variety of investment purposes.
Here, we are primarily interested in a maximum return with minimal associated risk. This can be indicated by values that are larger or smaller, or by figures that are either positive or negative.
Such numbers must be viewed with the benefit of considerable investor judgment; they are not meant to be taken absolutely.
How To Use The Sharpe Ratio Stocks List To Find Compelling Investment Ideas
Having an Excel document with the 100 highest Sharpe Ratios in the S&P 500 can be extremely useful.
The resource becomes even more powerful when combined with a rudimentary knowledge of how to use the filter function of Microsoft Excel to find investment ideas.
With that in mind, this section will show you step-by-step how to implement a particular investing screen using the Sharpe Ratio stocks list.
More specifically, we’ll show you how to screen for stocks with Sharpe Ratios above 1 and price-to-earnings ratios below 15.
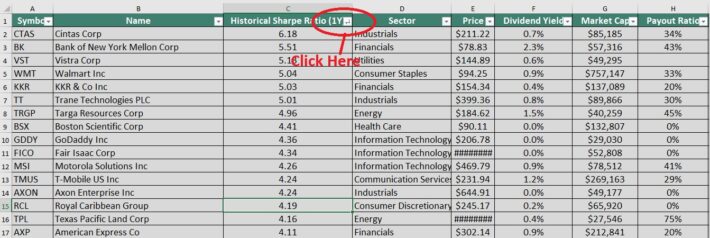
Step 1: Download the Sharpe Ratio Stocks List.
Step 2: Click the filter icon at the top of the Sharpe Ratio column, as shown below.
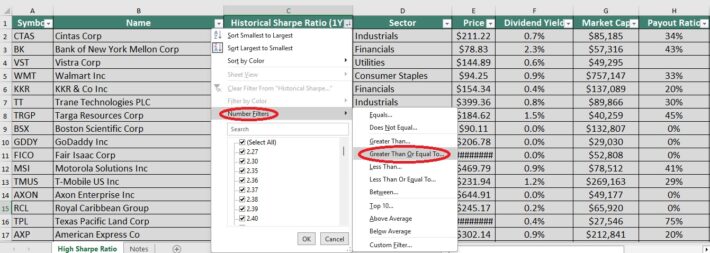
Step 3: Change the filter setting to “Greater Than Or Equal To”, input “1”, and click “OK”. This filters for S&P 500 stocks with Sharpe Ratios greater than or equal to 1.
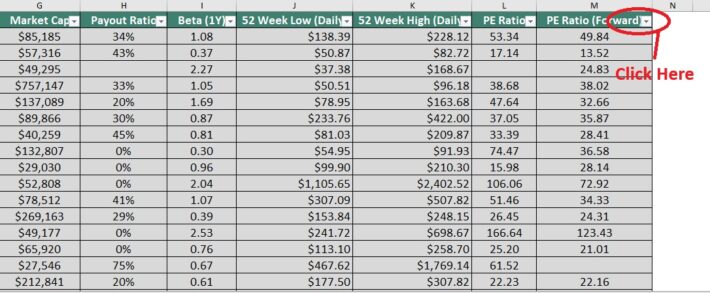
Step 4: Then, click the filter icon at the top of the forward P/E Ratio column, as shown below.
Step 5: Change the filter setting to “Less Than Or Equal To”, input “15”, and click “OK”. This filters for S&P 500 stocks with forward P/E ratios less than or equal to 15.
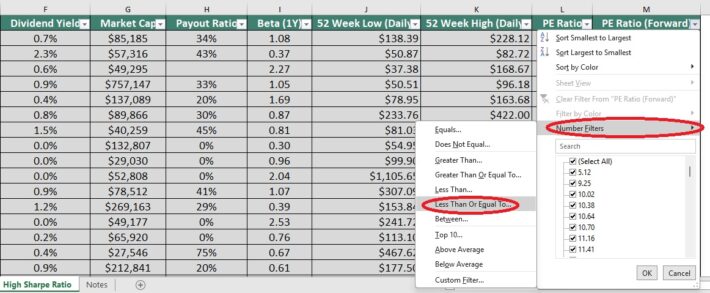
The remaining stocks in this Excel document are S&P 500 stocks with Sharpe Ratios higher than 1 and price-to-earnings ratios less than 15.
You now have a solid fundamental understanding of how to use the Sharpe Ratios list to find investment ideas.
The remainder of this article will provide more information on how to analyze stocks using the Sharpe Ratio.
The Top 10 Sharpe Ratio Stocks Today
The next section will list the top 10 Sharpe Ratio stocks now that are covered in the Sure Analysis Research Database, according to their 1-year Sharpe Ratios.
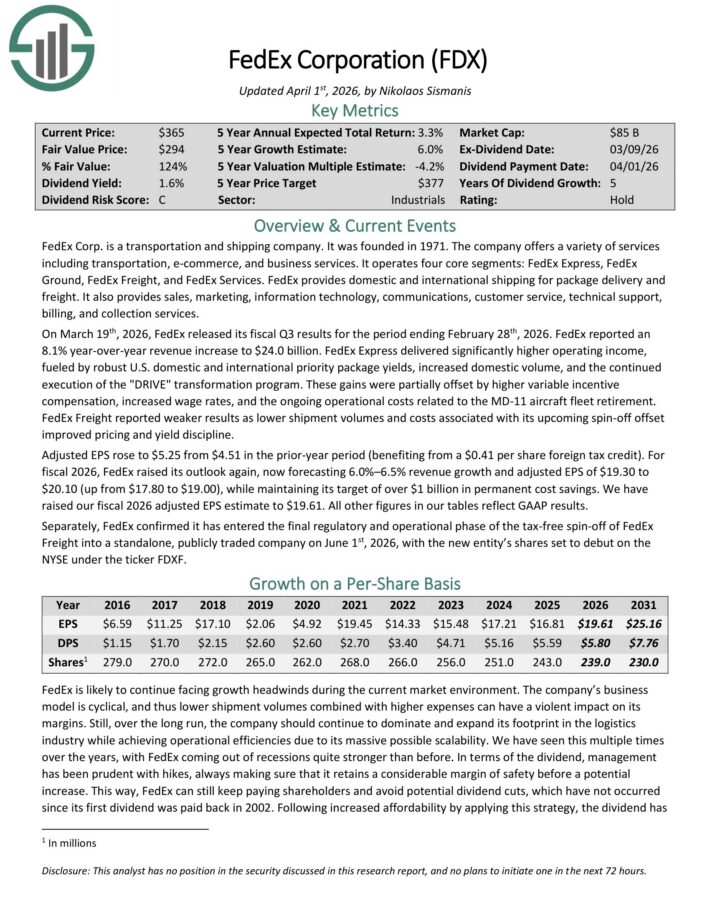
Sharpe Ratio Stock #10: FedEx Corp. (FDX)
- Sharpe Ratio: 3.39
FedEx Corp. is a transportation and shipping company founded in 1971. The company offers a variety of services including transportation, e-commerce, and business services.
It operates four core segments: FedEx Express, FedEx Ground, FedEx Freight, and FedEx Services.
FedEx provides domestic and international shipping for package delivery and freight. It also provides sales, marketing, information technology, communications, customer service, technical support, billing, and collection services.
On March 19th, 2026, FedEx released its fiscal Q3 results for the period ending February 28th, 2026. FedEx reported an 8.1% year-over-year revenue increase to $24.0 billion.
FedEx Freight reported weaker results as lower shipment volumes and costs associated with its upcoming spin-off offset improved pricing and yield discipline. Adjusted EPS rose to $5.25 from $4.51 in the prior-year period (benefiting from a $0.41 per share foreign tax credit).
For fiscal 2026, FedEx raised its outlook again, now forecasting 6.0%–6.5% revenue growth and adjusted EPS of $19.30 to $20.10 (up from $17.80 to $19.00), while maintaining its target of over $1 billion in permanent cost savings.
Click here to download our most recent Sure Analysis report on FDX (preview of page 1 of 3 shown below):
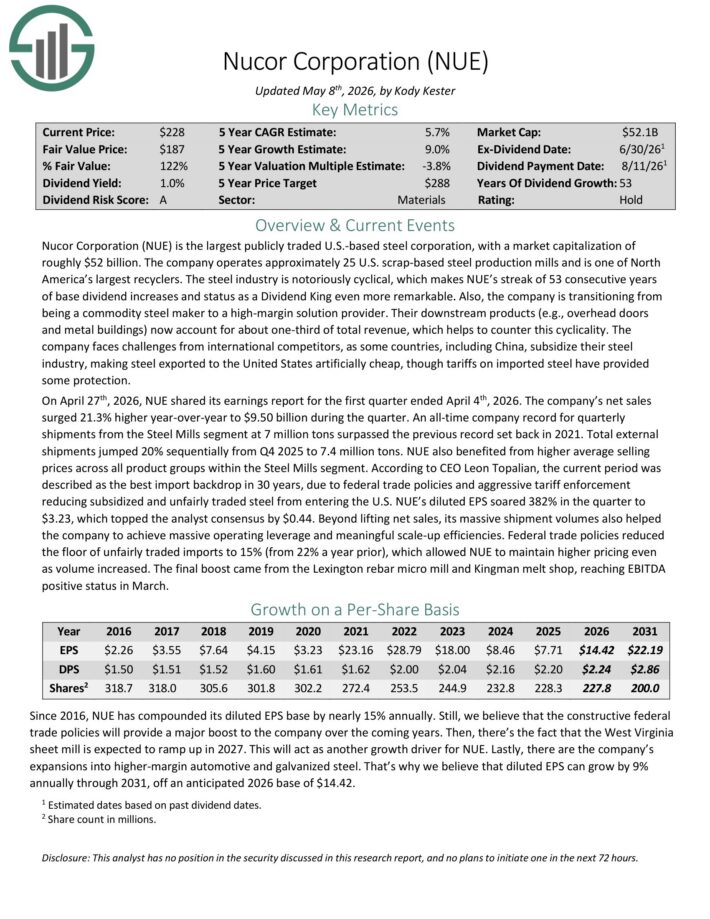
Sharpe Ratio Stock #9: Nucor Corp. (NUE)
- Sharpe Ratio: 3.48
Nucor is the largest publicly traded U.S.-based steel corporation. The company operates approximately 25 scrap-based steel production mills and is one of North America’s largest recyclers.
On April 27th, 2026, NUE shared its earnings report for the first quarter ended April 4th, 2026. The company’s net sales surged 21.3% higher year-over-year to $9.50 billion during the quarter.
An all-time company record for quarterly shipments from the Steel Mills segment at 7 million tons surpassed the previous record set back in 2021.
Total external shipments jumped 20% sequentially from Q4 2025 to 7.4 million tons. NUE also benefited from higher average selling prices across all product groups within the Steel Mills segment.
Click here to download our most recent Sure Analysis report on NUE (preview of page 1 of 3 shown below):
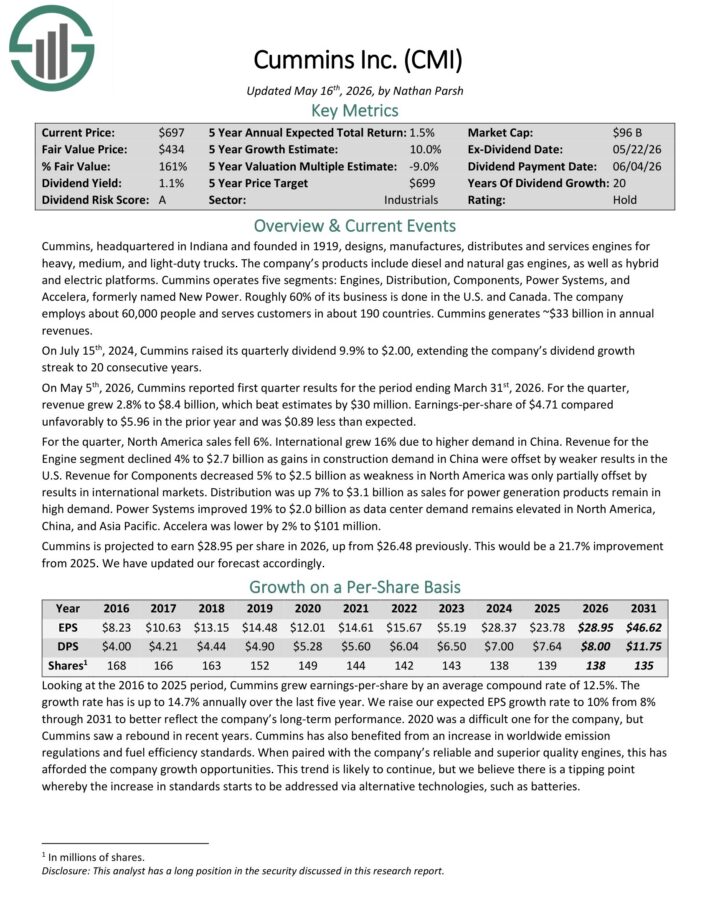
Sharpe Ratio Stock #8: Cummins Inc. (CMI)
- Sharpe Ratio: 3.67
Cummins, headquartered in Indiana and founded in 1919, designs, manufactures, distributes and services engines for heavy, medium, and light-duty trucks.
The company’s products include diesel and natural gas engines, as well as hybrid and electric platforms.
Cummins operates five segments: Engines, Distribution, Components, Power Systems, and Accelera, formerly named New Power. Roughly 60% of its business is done in the U.S. and Canada.
Cummins generates ~$33 billion in annual revenue.
On May 5th, 2026, Cummins reported first quarter results for the period ending March 31st, 2026. For the quarter, revenue grew 2.8% to $8.4 billion, which beat estimates by $30 million.
Earnings-per-share of $4.71 compared unfavorably to $5.96 in the prior year and was $0.89 less than expected.
For the quarter, North America sales fell 6%. International grew 16% due to higher demand in China. Revenue for the Engine segment declined 4% to $2.7 billion as gains in construction demand in China were offset by weaker results in the U.S.
Cummins is projected to earn $28.95 per share in 2026, up from $26.48 previously.
Click here to download our most recent Sure Analysis report on CMI (preview of page 1 of 3 shown below):
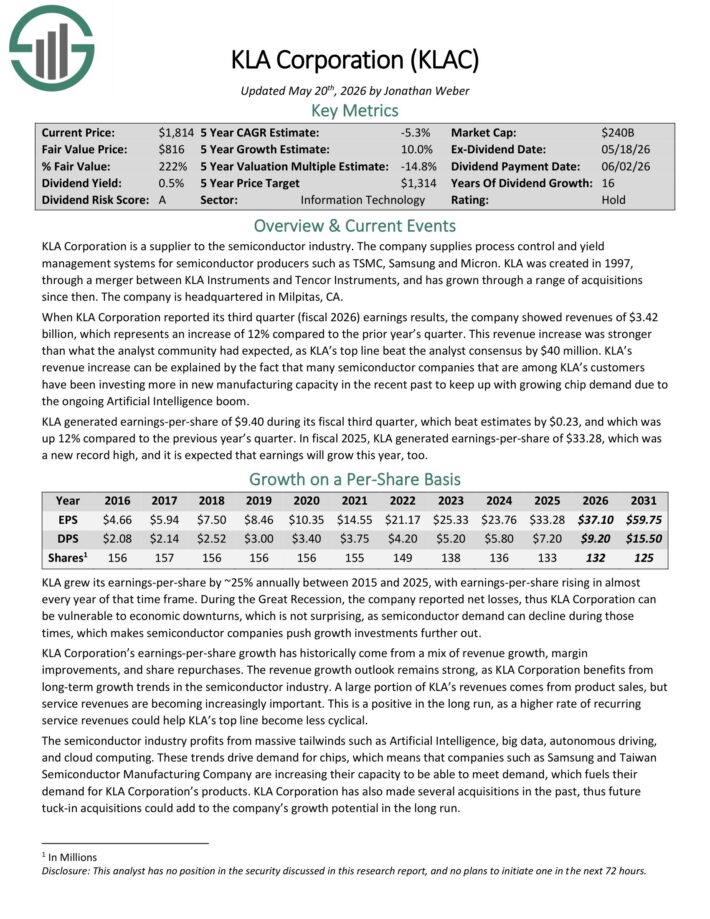
Sharpe Ratio Stock #7: KLA Corp. (KLA)
- Sharpe Ratio: 4.53
KLA Corporation is a supplier to the semiconductor industry. The company supplies process control and yield management systems for semiconductor producers such as TSMC, Samsung and Micron.
When KLA Corporation reported its third quarter (fiscal 2026) earnings results, the company showed revenue of $3.42 billion, which represents an increase of 12%.
This revenue increase was stronger than what the analyst community had expected, as KLA’s top line beat the analyst consensus by $40 million.
KLA’s revenue increase can be explained by the fact that many semiconductor companies that are among KLA’s customers have been investing more in new manufacturing capacity in the recent past to keep up with growing chip demand due to the ongoing Artificial Intelligence boom.
KLA generated earnings-per-share of $9.40 during its fiscal third quarter, which beat estimates by $0.23, and which was up 12%.
Click here to download our most recent Sure Analysis report on KLAC (preview of page 1 of 3 shown below):
Sharpe Ratio Stock #6: Applied Materials (AMAT)
- Sharpe Ratio: 4.61
Applied Materials generates more than $33 billion in annual revenue. Applied Materials has become a major player in the semiconductor market, which makes up the majority of its revenue.
Applied Materials released second quarter earnings on May 15th, 2026, and results were outstanding once again, including raised guidance. Adjusted earnings-per-share came to $2.86, which was 18 cents ahead of estimates.
Revenue was up 11.4% year-over-year to $7.91 billion, beating estimates by $220 million. Semiconductor Systems sales came to $5.97 billion, while Applied Global Services saw $1.67 billion.
China accounted for 27% of quarterly revenue at $2.09 billion, up from $1.77 billion in the year-ago period.
Guidance for the second quarter is for $8.45 billion to $9.45 billion, hugely above the estimated $8.15 billion even at the low end.
Adjusted earnings-per-share was expected to be $2.89, but management guided for $3.16 to $3.56, again well ahead of any sort of prior estimate.
Click here to download our most recent Sure Analysis report on AMAT (preview of page 1 of 3 shown below):

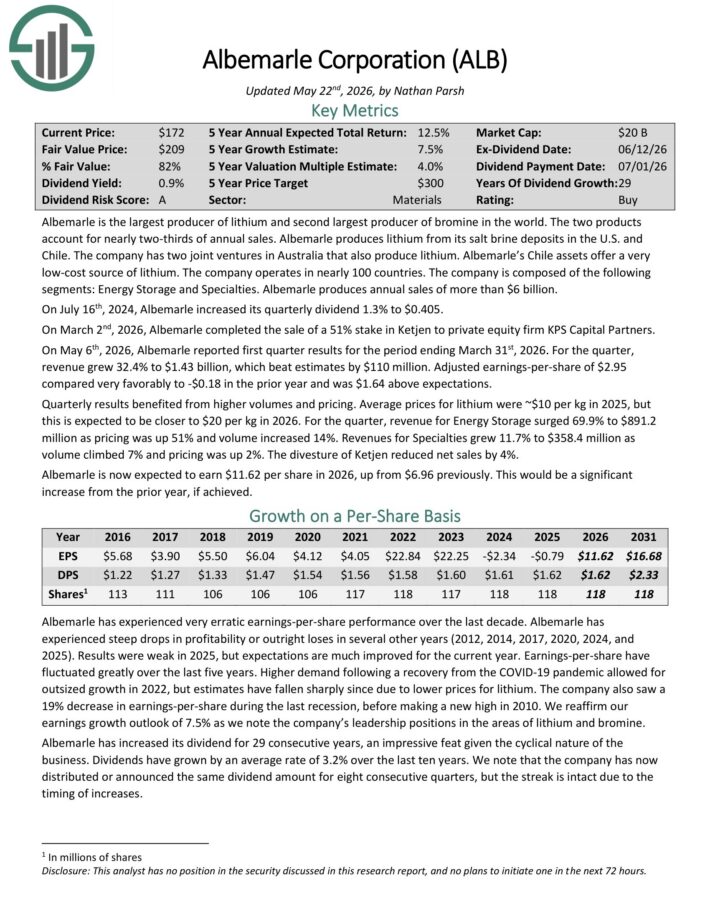
Sharpe Ratio Stock #5: Albemarle Corp. (ALB)
- Sharpe Ratio: 5.07
Albemarle is the largest producer of lithium and second largest producer of bromine in the world.
Albemarle produces lithium from its salt brine deposits in the U.S. and Chile. The company has two joint ventures in Australia that also produce lithium.
The company operates in nearly 100 countries. The company is composed of the following segments: Energy Storage and Specialties. Albemarle produces annual sales of more than $6 billion.
On May 6th, 2026, Albemarle reported first quarter results for the period ending March 31st, 2026. For the quarter, revenue grew 32.4% to $1.43 billion, which beat estimates by $110 million. Adjusted earnings-per-share of $2.95 compared very favorably to -$0.18 in the prior year and was $1.64 above expectations.
Quarterly results benefited from higher volumes and pricing. Average prices for lithium were ~$10 per kg in 2025, but this is expected to be closer to $20 per kg in 2026.
For the quarter, revenue for Energy Storage surged 69.9% to $891.2 million as pricing was up 51% and volume increased 14%.
Revenues for Specialties grew 11.7% to $358.4 million as volume climbed 7% and pricing was up 2%. The divesture of Ketjen reduced net sales by 4%.
Click here to download our most recent Sure Analysis report on ALB (preview of page 1 of 3 shown below):
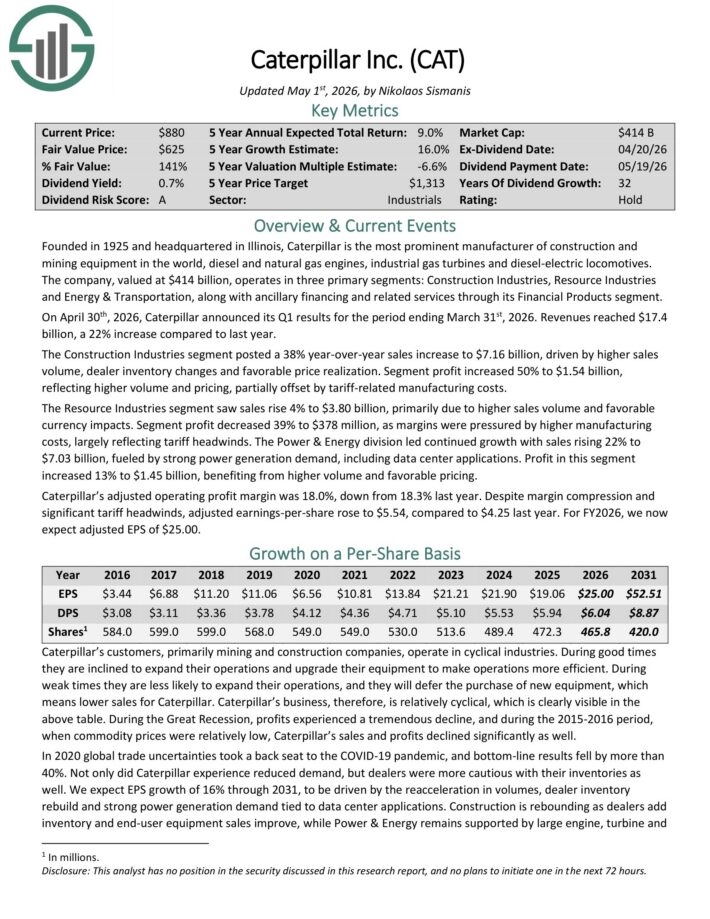
Sharpe Ratio Stock #4: Caterpillar Inc. (CAT)
- Sharpe Ratio: 5.32
Caterpillar is the most prominent manufacturer of construction and mining equipment in the world, diesel and natural gas engines, industrial gas turbines and diesel-electric locomotives.
The company operates in three primary segments: Construction Industries, Resource Industries and Energy & Transportation, along with ancillary financing and related services through its Financial Products segment.
On April 30th, 2026, Caterpillar announced its Q1 results for the period ending March 31st, 2026. Revenue reached $17.4 billion, a 22% increase compared to last year.
The Construction Industries segment posted a 38% year-over-year sales increase to $7.16 billion, driven by higher sales volume, dealer inventory changes and favorable price realization.
Segment profit increased 50% to $1.54 billion, reflecting higher volume and pricing, partially offset by tariff-related manufacturing costs.
The Resource Industries segment saw sales rise 4% to $3.80 billion, primarily due to higher sales volume and favorable currency impacts. Segment profit decreased 39% to $378 million, as margins were pressured by higher manufacturing costs, largely reflecting tariff headwinds.
The Power & Energy division led continued growth with sales rising 22% to $7.03 billion, fueled by strong power generation demand, including data center applications.
Profit in this segment increased 13% to $1.45 billion, benefiting from higher volume and favorable pricing.
Caterpillar’s adjusted operating profit margin was 18.0%, down from 18.3% last year. Despite margin compression and significant tariff headwinds, adjusted earnings-per-share rose to $5.54, compared to $4.25 last year.
Click here to download our most recent Sure Analysis report on CAT (preview of page 1 of 3 shown below):
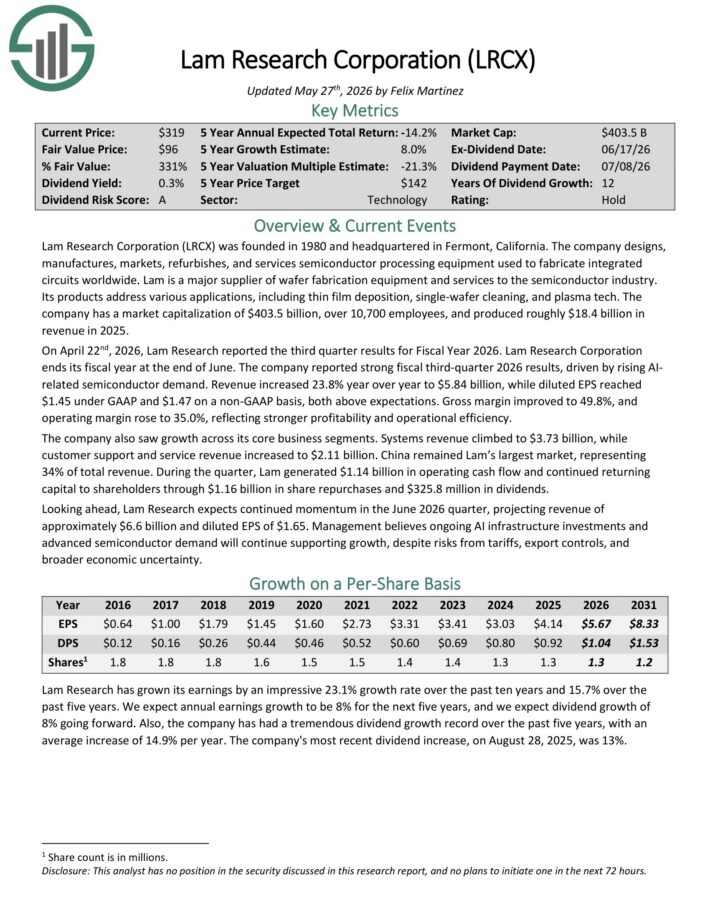
Sharpe Ratio Stock #3: Lam Research (LRCX)
- Sharpe Ratio: 6.82
Lam Research Corporation designs, manufactures, markets, refurbishes, and services semiconductor processing equipment used to fabricate integrated circuits worldwide.
Lam is a major supplier of wafer fabrication equipment and services to the semiconductor industry. Its products address various applications, including thin film deposition, single-wafer cleaning, and plasma tech.
On April 22nd, 2026, Lam Research reported the third quarter results for Fiscal Year 2026. Lam Research Corporation ends its fiscal year at the end of June.
The company reported strong fiscal third-quarter 2026 results, driven by rising AI-related semiconductor demand. Revenue increased 23.8% year over year to $5.84 billion, while diluted EPS reached $1.45 under GAAP and $1.47 on a non-GAAP basis, both above expectations.
Gross margin improved to 49.8%, and operating margin rose to 35.0%, reflecting stronger profitability and operational efficiency.
Click here to download our most recent Sure Analysis report on LRCX (preview of page 1 of 3 shown below):
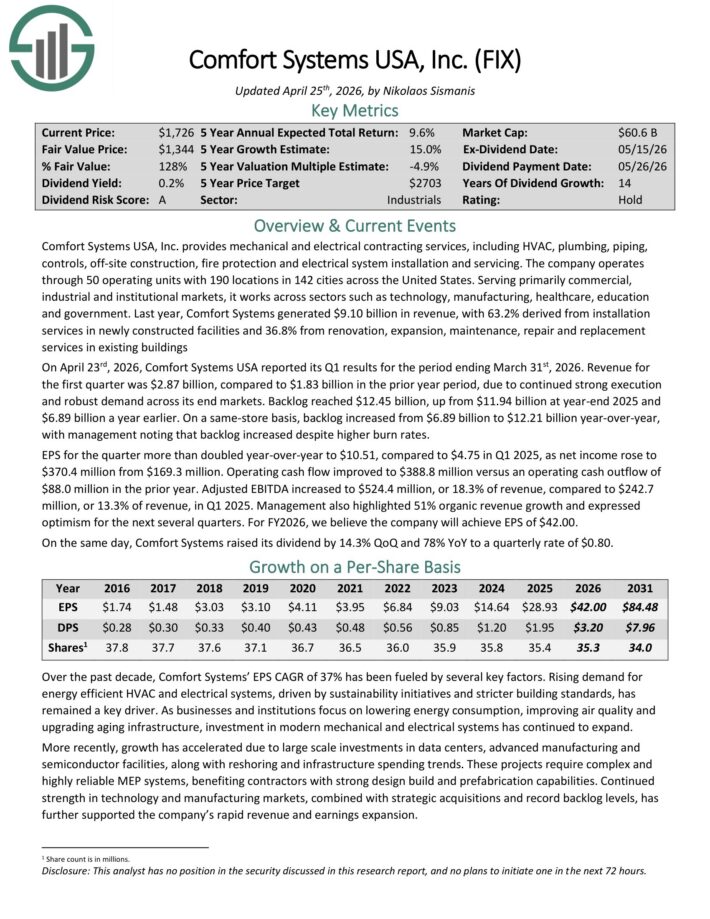
Sharpe Ratio Stock #2: Comfort Systems USA (FIX)
- Sharpe Ratio: 7.7
Comfort Systems USA, Inc. provides mechanical and electrical contracting services, including HVAC, plumbing, piping, controls, off-site construction, fire protection and electrical system installation and servicing.
The company operates through 50 operating units with 190 locations in 142 cities across the United States. Serving primarily commercial, industrial and institutional markets, it works across sectors such as technology, manufacturing, healthcare, education and government.
Last year, Comfort Systems generated $9.10 billion in revenue, with 63.2% derived from installation services in newly constructed facilities and 36.8% from renovation, expansion, maintenance, repair and replacement services in existing buildings.
On April 23rd, 2026, Comfort Systems USA reported its Q1 results for the period ending March 31st, 2026. Revenue for the first quarter was $2.87 billion, compared to $1.83 billion in the prior year period, due to continued strong execution and robust demand across its end markets.
Backlog reached $12.45 billion, up from $11.94 billion at year-end 2025 and $6.89 billion a year earlier. On a same-store basis, backlog increased from $6.89 billion to $12.21 billion year-over-year, with management noting that backlog increased despite higher burn rates.
EPS for the quarter more than doubled year-over-year to $10.51, compared to $4.75 in Q1 2025, as net income rose to $370.4 million from $169.3 million.
Click here to download our most recent Sure Analysis report on FIX (preview of page 1 of 3 shown below):
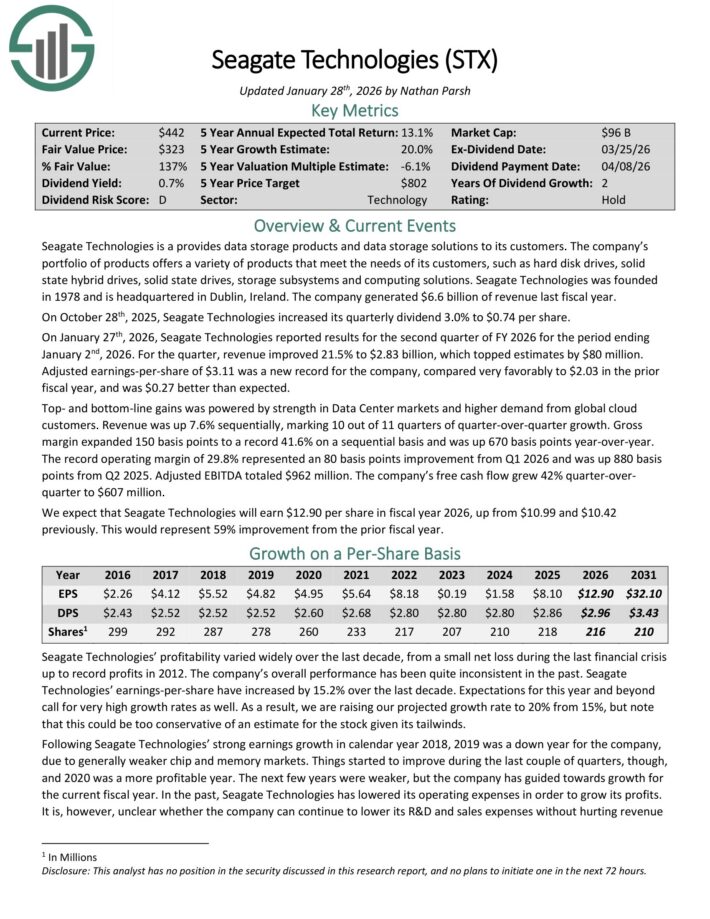
Sharpe Ratio Stock #1: Seagate Technology (STX)
- Sharpe Ratio: 9.8
Seagate Technologies provides data storage products and data storage solutions.
The company’s portfolio of products offers a variety of products that meet the needs of its customers, such as hard disk drives, solid state hybrid drives, solid state drives, storage subsystems and computing solutions.
On January 27th, 2026, Seagate Technologies reported results for the second quarter of FY 2026 for the period ending January 2nd, 2026. For the quarter, revenue improved 21.5% to $2.83 billion, which topped estimates by $80 million.
Adjusted earnings-per-share of $3.11 was a new record for the company, compared very favorably to $2.03 in the prior fiscal year, and was $0.27 better than expected.
Top- and bottom-line gains was powered by strength in Data Center markets and higher demand from global cloud customers.
Revenue was up 7.6% sequentially, marking 10 out of 11 quarters of quarter-over-quarter growth. Gross margin expanded 150 basis points to a record 41.6% on a sequential basis and was up 670 basis points year-over-year.
The record operating margin of 29.8% represented an 80 basis points improvement from Q1 2026 and was up 880 basis points from Q2 2025.
Adjusted EBITDA totaled $962 million. The company’s free cash flow grew 42% quarter-over quarter to $607 million.
We expect that Seagate Technologies will earn $12.90 per share in fiscal year 2026.
Click here to download our most recent Sure Analysis report on STX (preview of page 1 of 3 shown below):
Final Thoughts
Looking for stocks with strong historical Sharpe ratios is a useful way to find investment ideas.
With that said, this strategy is not the only way to find high-quality investments. To conclude this article, we’ll provide additional resources that you can use for your investment due diligence.
If you are looking for high-quality dividend growth stocks suitable for long-term investment, the following databases will be useful:
- The Dividend Aristocrats List: dividend stocks with 25+ years of consecutive dividend increases
- The Dividend Kings List is even more exclusive than the Dividend Aristocrats. It is comprised of 58 stocks with 50+ years of consecutive dividend increases.
- The Blue Chip Stocks List: stocks that qualify as Dividend Achievers, Dividend Aristocrats, and/or Dividend Kings
- The High Dividend Stocks List: stocks that appeal to investors interested in the highest yields of 5% or more.
- The Monthly Dividend Stocks List: stocks that pay dividends every month, for 12 dividend payments per year.
You may also be looking for appealing stocks from a certain stock market sector to ensure appropriate diversification within your portfolio. If that is the case, you will find the following resources useful:
- The Complete List Of Utility Stocks
- The Complete List Of Healthcare Stocks
- The Complete List Of Technology Stocks
- The Complete List Of Communication Services Stocks
- The Complete List Of Materials Stocks
- The Complete List Of Industrial Stocks
- The Complete List Of Consumer Discretionary Stocks
- The Complete List Of Consumer Staples Stocks
- The Complete List Of Energy Stocks
- The Complete List Of Financial Stocks
You may also wish to consider other investments within the major market indices. Our downloadable list of small-cap U.S. stocks can be accessed below: