Updated on November 9th, 2026 by Nikolaos Sismanis
Real estate investment trusts – or REITs, for short – are compelling investment vehicles.
That’s because:
- They provide diversified real estate exposure
- Without the high up-front cost of traditional real estate
- They often have high dividend yields well in excess of the S&P 500
- U.S. REITs must distribute at least 90% of taxable income, excluding net capital gains, to investors
Bonus: You can download your free 200+ REIT list spreadsheet, complete with metrics that matter, by clicking on the link below:
In addition to the downloadable Excel sheet of all REITs, this article discusses why income investors should pay particularly close attention to this asset class.
And, we also include our top 7 REITs today based on expected total returns.
Table Of Contents
In addition to the full downloadable Excel spreadsheet, this article covers our top 7 REITs today, as ranked using expected total returns from The Sure Analysis Research Database.
The table of contents below allows for easy navigation.
- Why Invest In REITs?
- REIT Financial Metrics
- The Top 7 REITs Today
- #7: Alpine Income Property Trust (PINE)
- #6: NexPoint Residential Trust (NXRT)
- #5: Rexford Industrial Realty (REXR)
- #4: Gaming and Leisure Properties (GLPI)
- #3: Gladstone Commercial (GOOD)
- #2: Innovative Industrial Properties (IIPR)
- #1: VICI Properties (VICI)
Why Invest in REITs?
REITs are, by design, a fantastic asset class for investors looking to generate income.
Thus, one of the primary benefits of investing in these securities is their high dividend yields.
The currently high dividend yields of REITs are not an isolated occurrence.
In fact, this asset class has traded at a higher dividend yield than the S&P 500 for decades.
The high dividend yields of REITs are due to the regulatory implications of doing business as a real estate investment trust.
To qualify for U.S. REIT tax treatment, a company generally must distribute at least 90% of its taxable income, excluding net capital gains, as dividends.
Many publicly traded REITs issue common shares, while some trusts issue units.
A REIT can have a payout ratio below 90% when the denominator is funds from operations rather than taxable income (more on that later).
REIT Financial Metrics
REITs run unique business models.
More than the vast majority of other business types, they are primarily involved in the ownership of long-lived assets.
From an accounting perspective, this means that REITs incur significant non-cash depreciation and amortization expenses.
How does this affect the bottom line of REITs?
Depreciation and amortization expenses reduce a company’s net income, so a REIT’s dividend can exceed its reported net income while remaining covered by cash flow.
To give a better sense of financial performance and dividend safety, REITs developed the financial metric funds from operations, or FFO.
Just like earnings, FFO can be reported per share or per unit, providing a more useful measure of operating performance for many REITs.
FFO generally starts with net income, adds back real estate depreciation, amortization, and qualifying impairment charges, and excludes gains or losses on property sales, with adjustments for joint ventures and other specified items.
Adjusted FFO, or AFFO, makes further company-specific adjustments, often including recurring capital expenditures and non-cash rent items, so investors should examine each REIT’s reconciliation when assessing dividend coverage.
For an example of how FFO is calculated, consider the following net income-to-FFO reconciliation from Realty Income (O), one of the largest and most popular REIT securities.
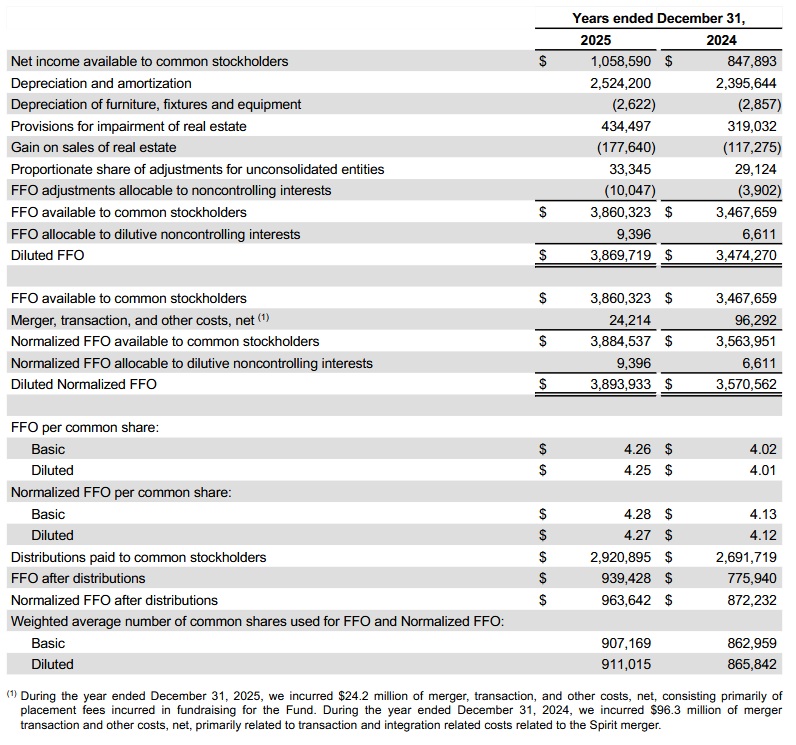
Source: Realty Income 2025 Annual Report
In 2025, net income available to common stockholders was approximately $1.06 billion, while FFO available to common stockholders was $3.86 billion, a sizable difference between the two metrics.
This shows the profound effect that depreciation and amortization can have on the GAAP financial performance of real estate investment trusts.
The Top 7 REITs Today
Below we have ranked our top 7 U.S. equity REITs today based on expected annualized total returns over the next five years. Mortgage REITs and international REITs are excluded.
Return and dividend-yield figures use the November 8th, 2026 Sure Analysis spreadsheet, with NXRT’s return updated using the assumptions in our completed November report.
Expected total returns are in turn made up from dividend yield, expected growth on a per-share or per-unit basis, and valuation multiple changes.
Expected total return investing takes into account income (dividend yield), growth, and value.
Note: The REITs below have not been vetted for safety.
These are high expected total return securities, but they may come with elevated risks.
We encourage investors to fully consider the risk/reward profile of these investments.
For the Top 10 REITs each month, based on expected total returns and safety, see our Top 10 REITs service.
Top REIT #7: Alpine Income Property Trust (PINE)
- Expected Total Return: 14.9%
- Dividend Yield: 7.7%
Alpine Income Property Trust owns single-tenant net lease properties and complements its rental portfolio with commercial real estate loans.
The REIT is externally managed by a subsidiary of CTO Realty Growth, which creates potential conflicts of interest alongside its access to management experience and tenant relationships.
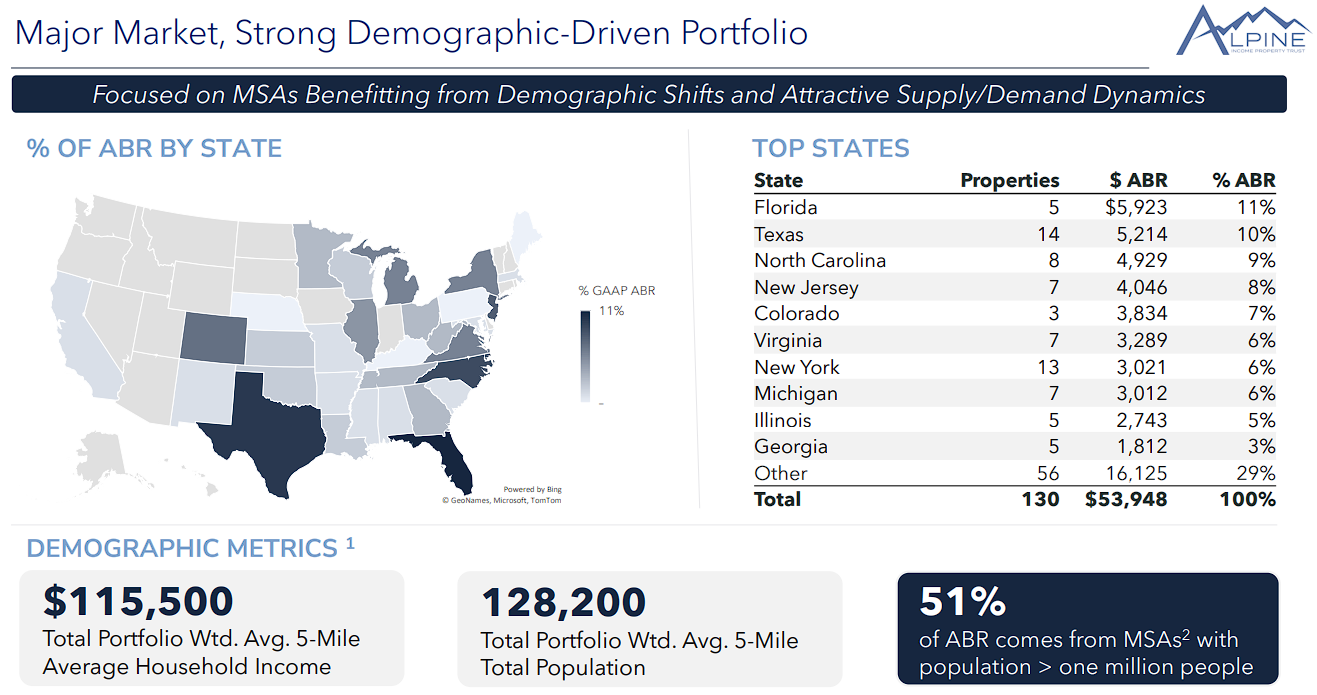
As of September 30th, 2026, Alpine owned 130 properties across 31 states, with 99.6% occupancy and an 8.7-year weighted-average remaining lease term.
Third-quarter revenue rose 40.5% to $20.5 million, while AFFO per diluted share increased to $0.55 from $0.46.
Much of the revenue growth came from commercial loan interest, making loan underwriting and the collection of payment-in-kind interest important considerations.
Management raised 2026 AFFO guidance to $2.20 to $2.22 per share, excluding any incentive management fee.
On October 30th, Alpine completed its $117.3 million purchase of 13 industrial properties, adding approximately 1.9 million square feet under fully occupied, long-term leases.
It also closed $175 million of additional unsecured financing capacity on October 29th, comprising a $100 million term loan and a $75 million increase in revolving commitments.
The quarterly dividend is $0.32 per share, or $1.28 annualized, representing roughly 58% of the spreadsheet’s projected AFFO.
That coverage provides a cushion, but tenant concentration, leverage, external management, and commercial loan credit risk remain material considerations.
Deep Dive: Click here to download (for free) our most recent 3-Page Sure Analysis PDF report on PINE.
Top REIT #6: NexPoint Residential Trust (NXRT)
- Expected Total Return: 15.2%
- Dividend Yield: 13.0%
NexPoint Residential Trust owns middle-income apartment communities with value-add potential in large Sun Belt markets across the Southeastern and Southwestern United States.
Its strategy centers on renovating units and improving amenities.
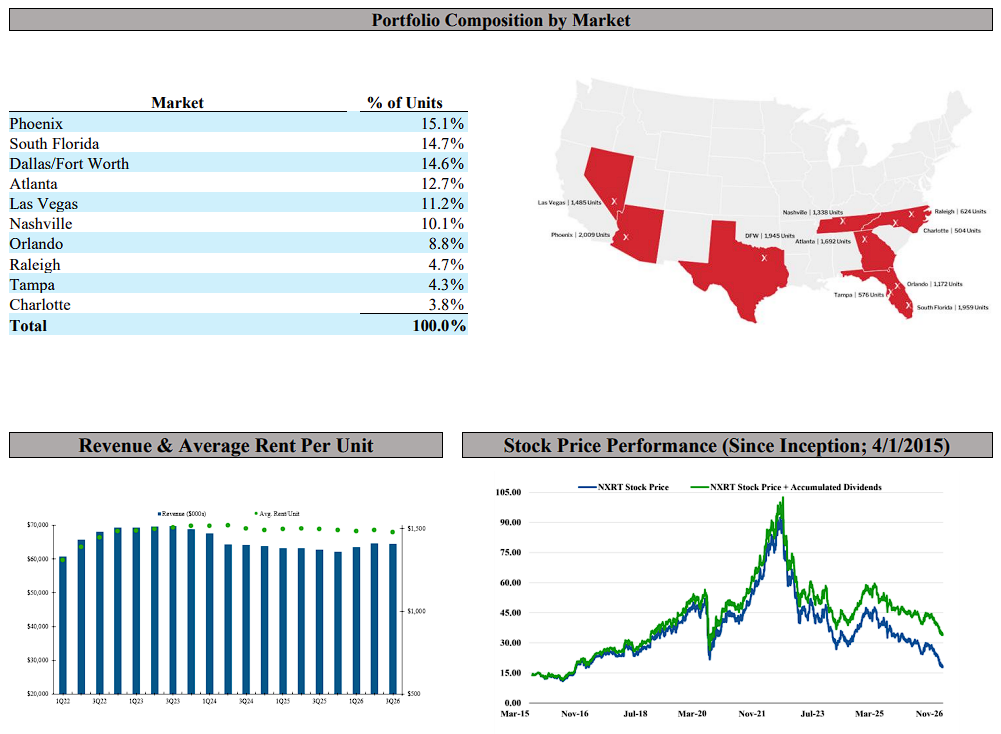
Third-quarter revenue increased to $64.5 million from $62.8 million, but same-store revenue declined 0.7%, and same-store NOI fell 8.2%.
Core FFO decreased to $0.52 per share from $0.70, while AFFO fell to $0.63 from $0.80.
The 36-property portfolio contained 13,305 units as of September 30th, with 92.8% physical occupancy and a $1,489 weighted-average effective monthly rent.
NXRT completed 708 full and partial upgrades during the quarter and leased 425 upgraded units, achieving a 21.1% return on investment.
Management lowered its full-year outlook again, with AFFO guidance at a $2.64-per-share midpoint and Core FFO at $2.22.
The October dividend declaration maintained $0.53 quarterly, or $2.12 annualized.
That dividend represents approximately 80% of the new AFFO midpoint and 95% of Core FFO; third-quarter Core FFO was below the quarterly payout.
AFFO also adds back stock compensation and does not deduct recurring maintenance capital spending, so cash coverage is thinner than the AFFO payout ratio alone suggests.
After quarter-end, NXRT acquired a $32 million Raleigh apartment community, and its board authorized a new $150 million repurchase program.
Weak rents and NOI, leverage, and refinancing costs increase the risk of dividend reductions.
Deep Dive: Click here to download (for free) our most recent 3-Page Sure Analysis PDF report on NXRT.
Top REIT #5: Rexford Industrial Realty (REXR)
- Expected Total Return: 15.4%
- Dividend Yield: 4.6%
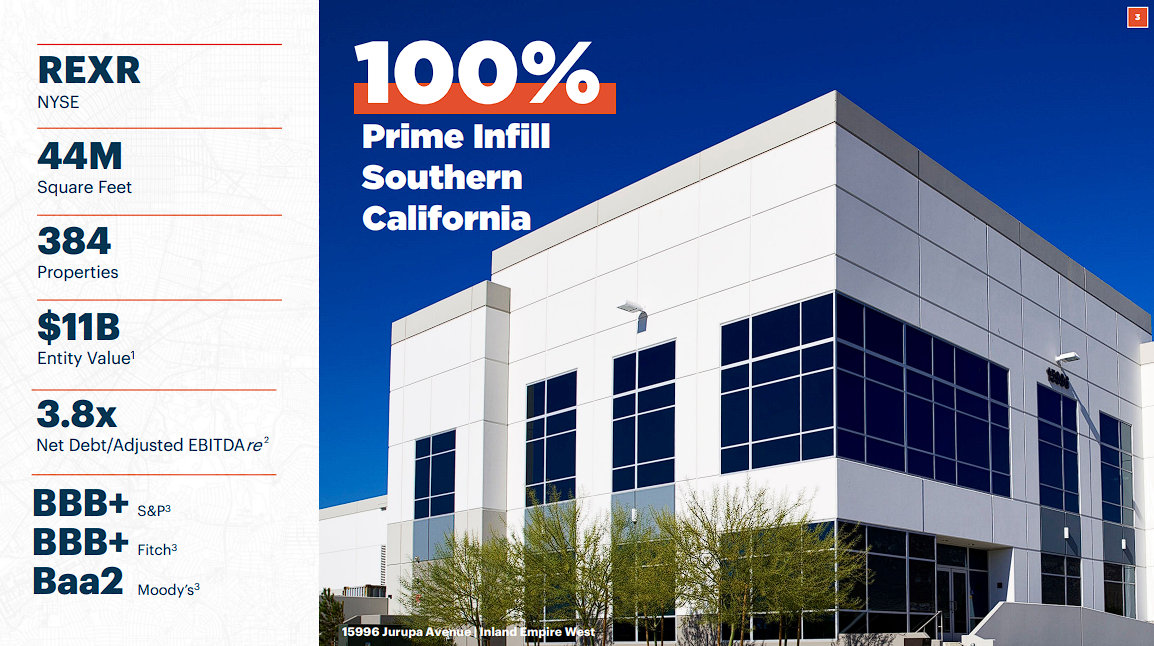
Rexford Industrial Realty owns, operates, and redevelops industrial properties in infill Southern California, where limited land supports long-term demand.
Third-quarter Core FFO per share was unchanged year over year at $0.60.
Same-property cash NOI declined 1.1%, while same-property NOI on a net-effective basis fell 2.6%.
Ending same-property occupancy improved to 96.9%, up 200 basis points from June, although it remained slightly below the prior-year level.
Comparable leasing rents increased 7.1% on a net-effective basis but declined 3.0% on a cash basis.
Rexford completed $1.5 billion of property sales through September, including the previously announced $1.2 billion portfolio transaction.
It repaid $485 million of debt during the quarter, and year-to-date share repurchases reached $708.7 million through October 22nd.
Net debt to adjusted EBITDAre declined to 3.8 times from 4.5 times at June 30th, strengthening financial flexibility.
The quarter also included $71.8 million of non-cash real estate impairments associated with the portfolio realignment.
Management raised 2026 Core FFO guidance to $2.41 to $2.44 per share.
The October declaration maintained the quarterly dividend at $0.435 per share, or $1.74 annualized, following 12 years of annual growth.
That payout represents approximately 72% of projected Core FFO. Stabilizing rents and redeploying capital effectively remain essential to the return outlook.
Deep Dive: Click here to download (for free) our most recent 3-Page Sure Analysis PDF report on REXR.
Top REIT #4: Gaming and Leisure Properties (GLPI)
- Expected Total Return: 15.7%
- Dividend Yield: 8.4%
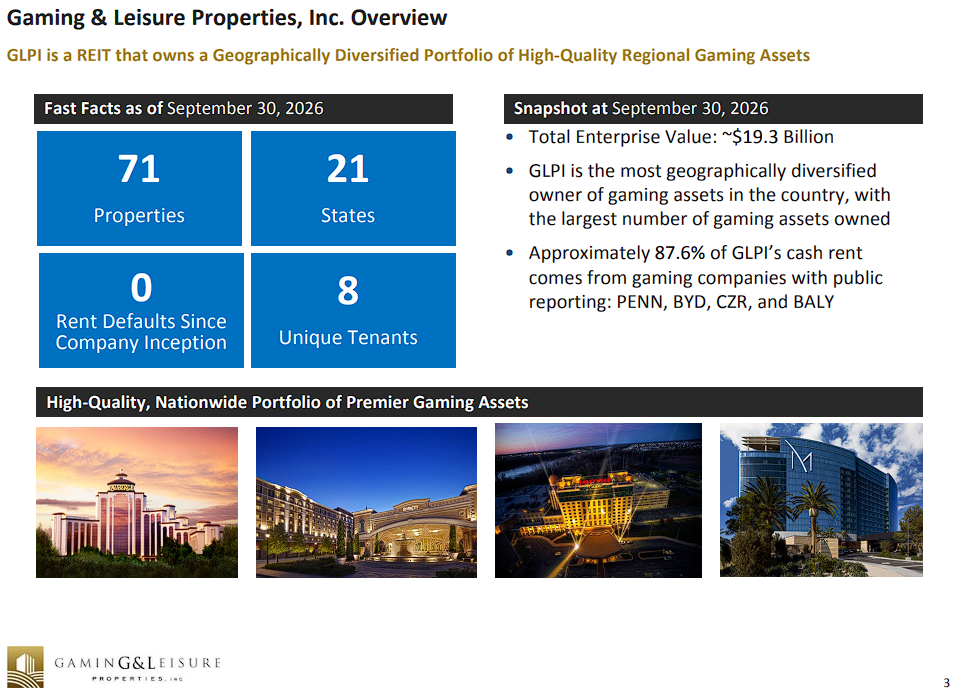
Gaming and Leisure Properties had interests in 71 gaming and related facilities across 21 states at September 30th, 2026, and leases them to casino operators under long-term triple-net agreements.
This structure places property-level expenses with tenants and gives the REIT contractual rent streams, although operator concentration remains an important risk.
Third-quarter revenue increased 9.5% to $435.4 million, while adjusted FFO rose 10.5% to $311.7 million.
Adjusted FFO per share advanced 7.2% to $1.04, supported by acquisitions, development funding, and contractual rent increases.
Management narrowed 2026 AFFO guidance upward to $4.11 to $4.12 per share, from $4.10 to $4.12.
The outlook incorporates approximately $800 million of development spending for the full year, including another $265 million following the third quarter.
In October, GLPI agreed to form a joint venture with Prologis to redevelop the former Hollywood Casino Joliet site into an industrial park.
Development is expected to occur in phases over roughly five years and remains subject to approvals and other conditions.
The quarterly dividend was raised 5.1% in May to $0.82 per share and was maintained at that rate in September, equaling $3.28 annualized.
The dividend consumes roughly 80% of projected adjusted FFO, although GLPI reduced its cash dividend during the 2020 pandemic.
Long leases and current coverage support the payout, but tenant health, development funding, and net leverage of approximately 4.8 times adjusted EBITDA remain important risks.
Deep Dive: Click here to download (for free) our most recent 3-Page Sure Analysis PDF report on GLPI.
Top REIT #3: Gladstone Commercial (GOOD)
- Expected Total Return: 16.0%
- Dividend Yield: 11.7%
Gladstone Commercial invests in net-leased industrial and office properties across the United States and pays monthly common dividends.
The company is recycling non-core assets while emphasizing industrial investments, with tenant credit quality and lease renewals central to its strategy.
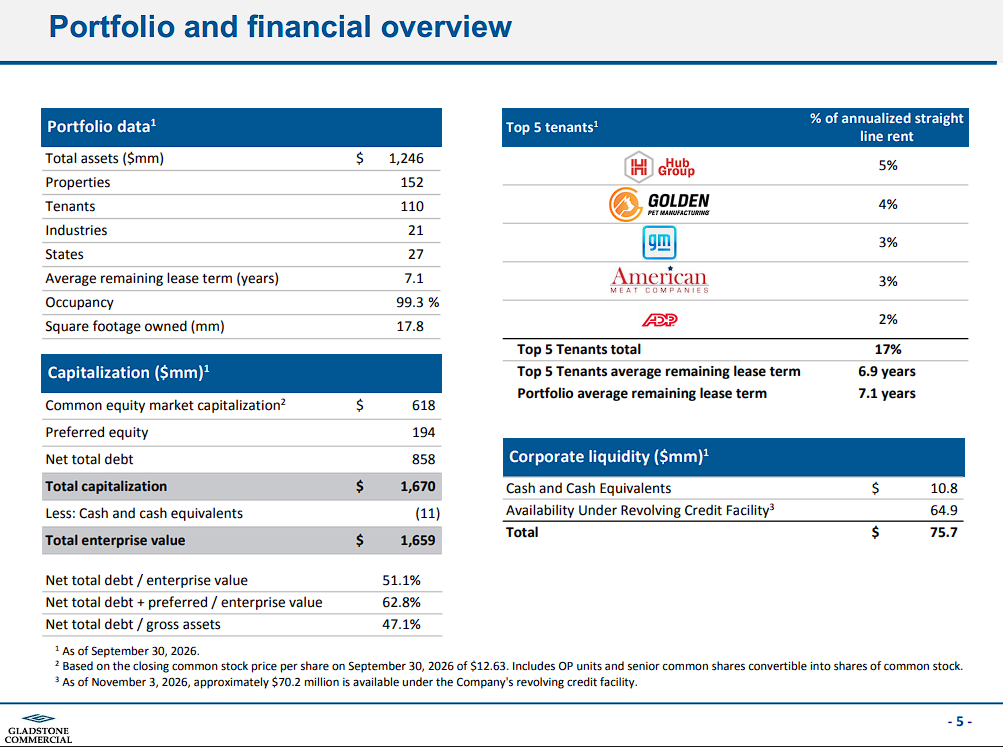
As of September 30th, 2026, it owned 152 properties totaling approximately 17.8 million square feet, with 99.3% of the space leased.
Third-quarter operating revenue was $42.4 million, down 3.6% from the second quarter.
Core FFO declined 7.8% sequentially to $16.9 million, or $0.35 per share, from $0.38 in the preceding quarter.
Higher property and interest costs, together with the absence of a prior-quarter lease termination fee, weighed on results.
The quarter also included a $6.5 million property impairment, contributing to a common-shareholder net loss of $0.11 per share.
Rent collection remained strong: Gladstone collected all cash rents due during the third quarter and October.
It acquired a fully occupied industrial property for $6.6 million during the quarter and continued renewing leases after September.
The board maintained monthly common distributions of $0.10 for October, November, and December, equivalent to $1.20 annualized.
That payout equals about 86% of the spreadsheet’s $1.40 full-year FFO estimate and of annualized third-quarter Core FFO.
The yield comes with meaningful office exposure, financing costs, and payout risk; Gladstone cut its common dividend in 2023 and has no current annual dividend-growth streak.
Deep Dive: Click here to download (for free) our most recent 3-Page Sure Analysis PDF report on GOOD.
Top REIT #2: Innovative Industrial Properties (IIPR)
- Expected Total Return: 16.5%
- Dividend Yield: 13.8%
Innovative Industrial Properties is an internally managed specialty REIT that owns regulated-cannabis cultivation and processing facilities, alongside selected life-science investments.
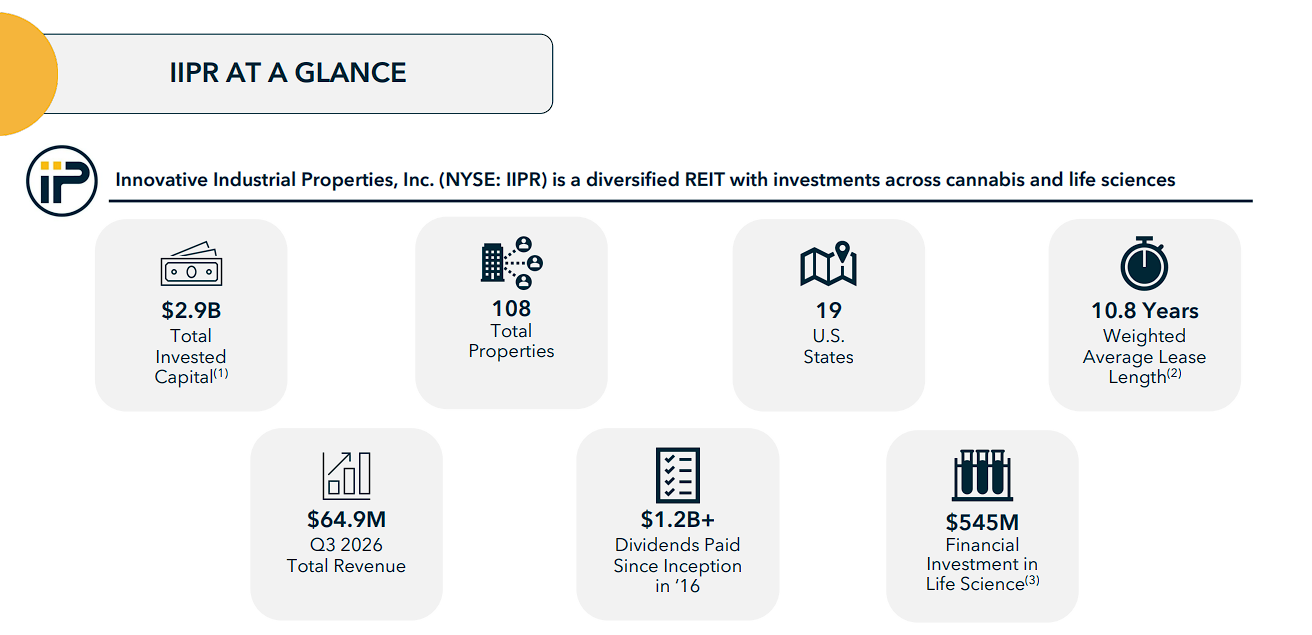
Third-quarter revenue increased 0.4% to $64.9 million, while AFFO per share rose to $1.96 from $1.71 a year earlier.
The improvement partly reflected investment income: IQHQ-related interest and dividends contributed $10.4 million during the quarter.
Cannabis tenant distress remains substantial. IIPR applied $3.8 million of security deposits to defaulted leases, terminated 16 leases, and signed six new leases during the quarter.
All PharmaCann leases had been terminated by September 30th, making successful re-leasing and cash rent collection important to future results.
The company committed $245 million to an Alewife Park life-science mezzanine loan, funding approximately $111 million initially, and invested another $30 million in IQHQ preferred equity.
After quarter-end, it recovered $49 million of seller financing, raised $54.2 million through 9.25% preferred stock, and extended its $87.5 million revolver to January 2027.
The latest declared common dividend remained $1.90 per quarter, or $7.60 annualized, with the quarterly rate unchanged since 2024.
The payout was covered by third-quarter AFFO but represents 100% of the spreadsheet’s full-year forecast, leaving little room for setbacks.
The high yield therefore carries significant tenant-credit, re-leasing, life-science financing, and dividend-cut risks.
Deep Dive: Click here to download (for free) our most recent 3-Page Sure Analysis PDF report on IIPR.
Top REIT #1: VICI Properties (VICI)
- Expected Total Return: 17.2%
- Dividend Yield: 7.4%
VICI Properties is an experiential net-lease REIT whose portfolio includes major gaming, hospitality, wellness, entertainment, and leisure destinations.
Its long-term triple-net leases shift property expenses to tenants and generally include contractual rent escalators, creating a predictable base of rental income.
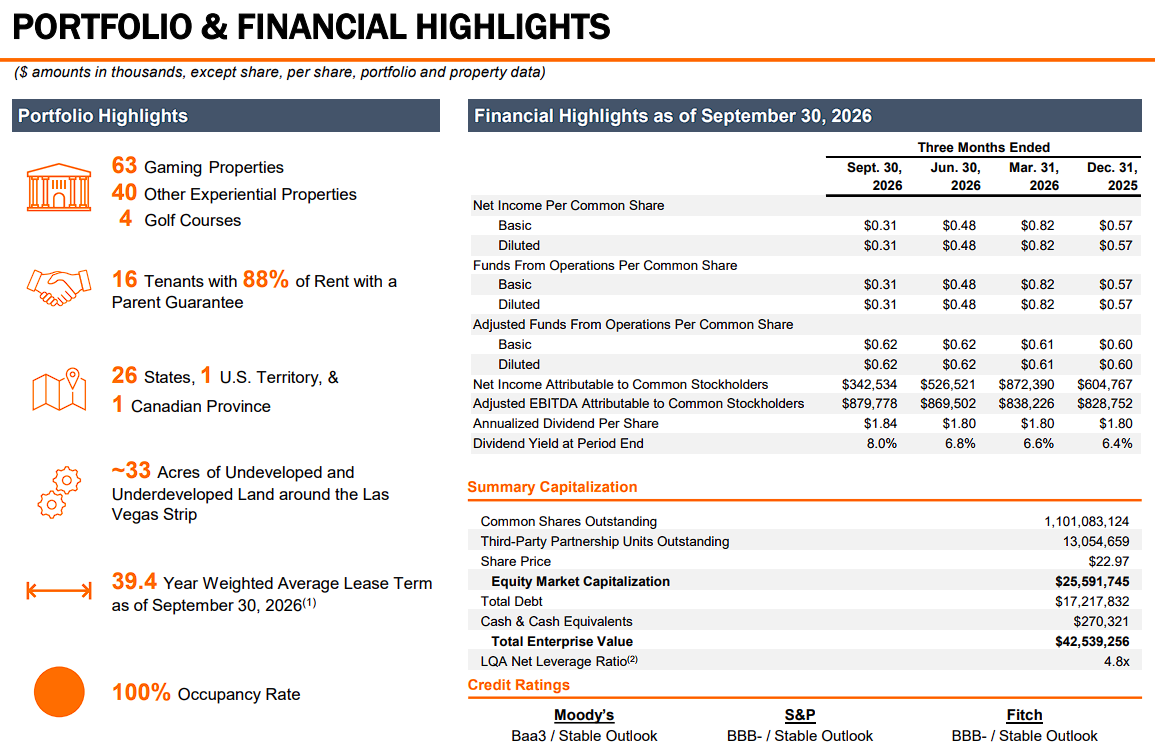
Third-quarter revenue increased 5.8% to $1.1 billion, while AFFO attributable to common shareholders grew 7.5% to $685.2 million.
AFFO per share rose 4.3% to $0.62, and management raised full-year guidance to $2.47 to $2.48 per share.
Reported net income and FFO per share both fell to $0.31, principally reflecting a change in the expected credit-loss allowance. That decline should not be confused with the growth in adjusted FFO.
VICI agreed to add Highfield Investment Group as a tenant through a new master lease covering two Alberta racinos, subject to the related transaction closing.
The change would diversify the tenant roster without changing aggregate rent collected from those assets.
The company also completed its $1.75 billion notes offering to refinance 2026 maturities, and the board subsequently authorized a $2 billion share repurchase program.
On September 3rd, VICI raised its quarterly dividend 2.2% to $0.46 per share, or $1.84 annualized, extending its annual dividend-growth record to nine years.
The payout represents approximately 74% of projected AFFO.
Caesars and MGM remain important tenant concentrations, while credit-loss assumptions, acquisition underwriting, and borrowing costs warrant monitoring.
Deep Dive: Click here to download (for free) our most recent 3-Page Sure Analysis PDF report on VICI.
Final Thoughts
Our REITs Spreadsheet provides a broad starting point for researching publicly traded real estate investment trusts, while the seven names above represent the highest expected returns in the current Sure Analysis universe.
The opportunities span several property types.
For example, NexPoint offers Sun Belt apartments, while VICI and Gaming and Leisure Properties provide gaming-related net leases.
Rexford focuses on Southern California industrial real estate, while Innovative Industrial Properties serves regulated cannabis operators and makes life-science investments.
Meanwhile, Gladstone Commercial owns industrial and office properties, and Alpine combines net leased properties with commercial real estate loans.
These high projected returns should not be confused with uniformly low risk.
Several companies face meaningful tenant, leverage, refinancing, occupancy, or payout challenges, and the estimates rely partly on valuation recovery that may not occur on schedule.
Investors should therefore examine AFFO coverage, balance-sheet strength, tenant quality, and property-level fundamentals alongside the headline yield and expected-return estimate.
Other Sure Dividend Resources
- Dividend Kings: 50+ years of rising dividends
- Dividend Champions: 25+ years of rising dividends
- Dividend Aristocrats: 25+ years of rising dividends and in the S&P 500
- High Dividend Stocks: 4%+ dividend yields
- Monthly Dividend Stocks: Individual securities that pay out every month
- Royalty Stocks: Detailed royalty stocks list
- MLPs: Detailed MLP list
- BDCs: Detailed BDC list