Updated on June 24th, 2025 by Bob Ciura
The goal of most investors is to either:
- Maximize returns given a fixed level of risk
- Minimize risk given a particularly level of desired returns
Perhaps the best metric for analyzing both risk and return is the Sharpe Ratio. With that in mind, we’ve compiled a list of the 100 stocks in the S&P 500 Index with the highest Sharpe Ratios.
You can download your free list of high Sharpe Ratio stocks (along with relevant financial metrics like dividend yields and price-to-earnings ratios) by clicking on the link below:
Keep reading this article to learn more about using the Sharpe Ratio to analyze publicly-traded stocks.
Table Of Contents
The table of contents below provides for easy navigation of the article:
- What Is The Sharpe Ratio?
- How To Use The Sharpe Ratio Stocks List To Find Compelling Investment Ideas
- The Top 10 Sharpe Ratio Stocks Today
- Final Thoughts
What Is The Sharpe Ratio?
The Sharpe ratio is the financial industry’s favorite measure of risk-adjusted returns. It tells investors whether they are being appropriately rewarded for the risks they’re assuming in their investments.
There are three components to the Sharpe Ratio calculation:
- Investment return
- Risk free rate of return
- Investment standard deviation
For most investors, a suitable Risk-free rate of return is the current yield on 10-year U.S. government bonds. For this article, we have used a risk free rate of 0, as interest rates have declined significantly.
For our purposes here, the Investment return can be either a historical return or an expected annual return. It is expressed using a decimal; for example, 0.51 would represent a 51% return.
Note: We use 252 instead of 365 – the number of days in a year – for a one-year period because there are approximately 252 trading days in an average calendar year, or we may employ 757 or a slight variant of that for a specific three-year period.
We employ the calculated Investment standard deviation, usually based on daily variations, to take into account periodic fluctuations in the investment due to such things as dividends and stock splits.
Determination of the Sharpe ratio can require a large number of repetitive calculations. This can be done easily and conveniently via a Microsoft Excel spreadsheet, as will be demonstrated later.
The Sharpe ratio is calculated with the following formula:

The risk free rate of return can be different depending on your use case. For risk-free rate of return = 0, the equation for the Sharpe ratio reduces to:
 Examination of this simplified equation reveals the meaning of the Sharpe ratio. It displays the Investment Return as a comparative function of the Investment Risk, or the amount of principal involved.
As you might imagine, numerous complex variants of this simplified formula have been developed and used for a variety of investment purposes.
Here, we are primarily interested in a maximum return with minimal associated risk. This can be indicated by values that are larger or smaller, or by figures that are either positive or negative.
Such numbers must be viewed with the benefit of considerable investor judgment; they are not meant to be taken absolutely.
How To Use The Sharpe Ratio Stocks List To Find Compelling Investment Ideas
Having an Excel document with the 100 highest Sharpe Ratios in the S&P 500 can be extremely useful.
The resource becomes even more powerful when combined with a rudimentary knowledge of how to use the filter function of Microsoft Excel to find investment ideas.
With that in mind, this section will show you step-by-step how to implement a particular investing screen using the Sharpe Ratio stocks list.
More specifically, we’ll show you how to screen for stocks with Sharpe Ratios above 1 and price-to-earnings ratios below 15.
Step 1: Download the Sharpe Ratio Stocks List.
Step 2: Click the filter icon at the top of the Sharpe Ratio column, as shown below.
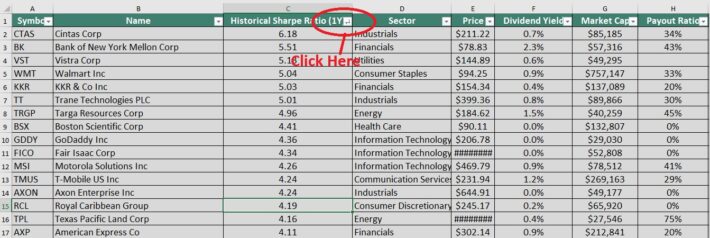
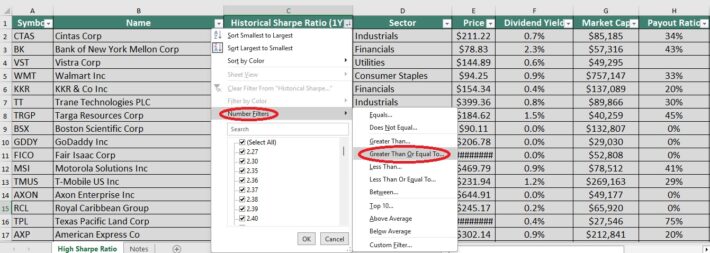
Step 3: Change the filter setting to “Greater Than Or Equal To”, input “1”, and click “OK”. This filters for S&P 500 stocks with Sharpe Ratios greater than or equal to 1.
Step 4: Then, click the filter icon at the top of the forward P/E Ratio column, as shown below.
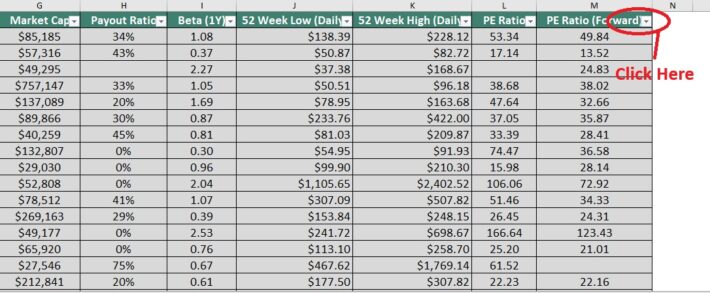
Step 5: Change the filter setting to “Less Than Or Equal To”, input “15”, and click “OK”. This filters for S&P 500 stocks with forward P/E ratios less than or equal to 15.
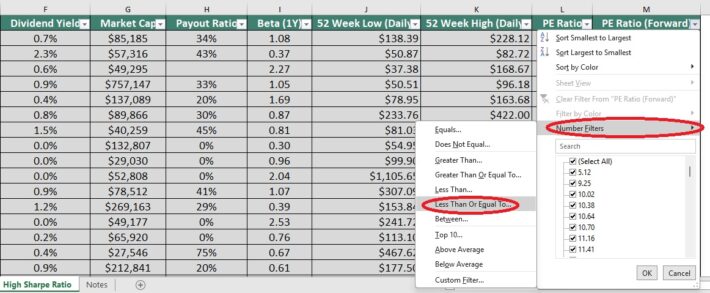
The remaining stocks in this Excel document are S&P 500 stocks with Sharpe Ratios higher than 1 and price-to-earnings ratios less than 15.
You now have a solid fundamental understanding of how to use the Sharpe Ratios list to find investment ideas.
The remainder of this article will provide more information on how to analyze stocks using the Sharpe Ratio.
The Top 10 Sharpe Ratio Stocks Today
The next section will list the top 10 Sharpe Ratio stocks now that are covered in the Sure Analysis Research Database, according to their 1-year Sharpe Ratios.
Sharpe Ratio Stock #10: The Goldman Sachs Group (GS)
- Sharpe Ratio: 3.96
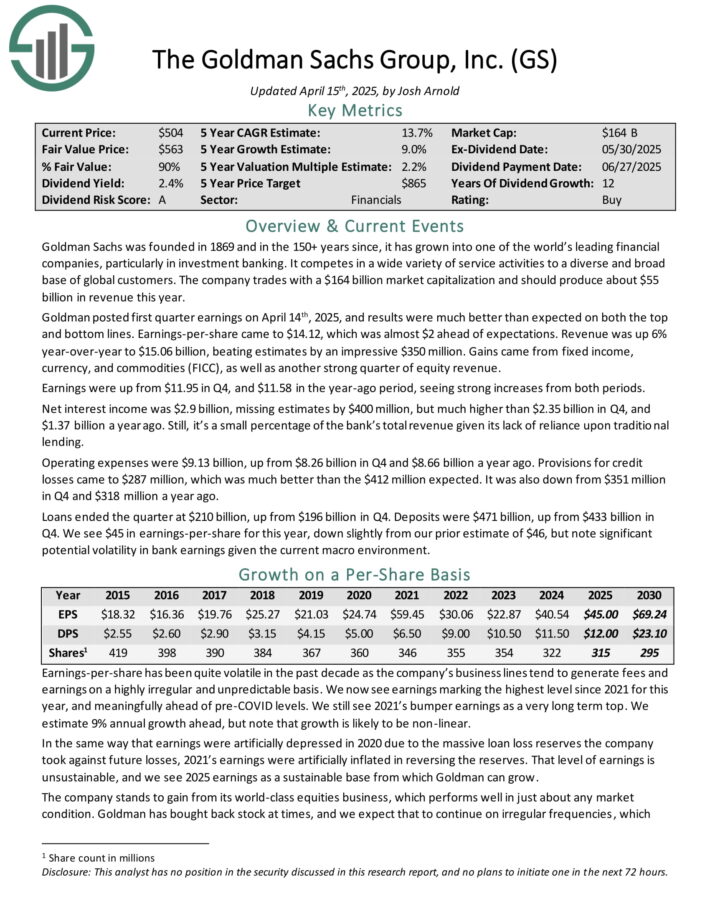
Goldman Sachs was founded in 1869 and in the 150+ years since, it has grown into one of the world’s leading financial companies, particularly in investment banking.
It competes in a wide variety of service activities to a diverse and broad base of global customers. The company should produce about $55 billion in revenue this year.
Goldman posted first quarter earnings on April 14th, 2025, and results were much better than expected on both the top and bottom lines. Earnings-per-share came to $14.12, which was almost $2 ahead of expectations.
Revenue was up 6% year-over-year to $15.06 billion, beating estimates by an impressive $350 million. Gains came from fixed income, currency, and commodities (FICC), as well as another strong quarter of equity revenue.
Earnings were up from $11.95 in Q4, and $11.58 in the year-ago period, seeing strong increases from both periods. Net interest income was $2.9 billion, missing estimates by $400 million, but much higher than $2.35 billion in Q4, and $1.37 billion a year ago.
Click here to download our most recent Sure Analysis report on GS (preview of page 1 of 3 shown below):
Sharpe Ratio Stock #9: Iron Mountain (IRM)
- Sharpe Ratio: 4.02
Iron Mountain is a storage and information management REIT. Its services include record management, destruction, fulfillment services, data protection and recovery, server and computer backup services, and safeguarding of electronic and physical media.
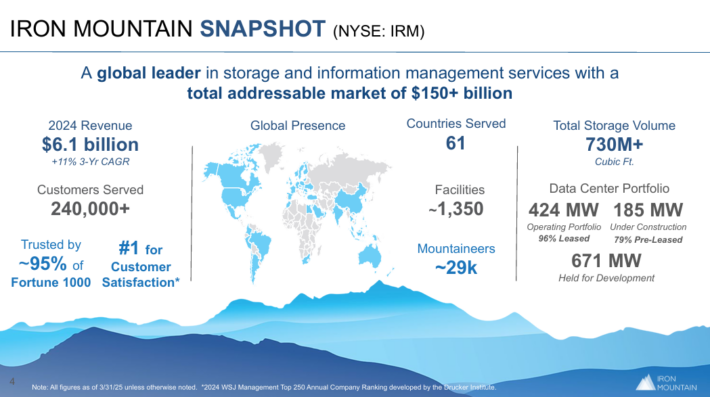
Source: Investor Presentation
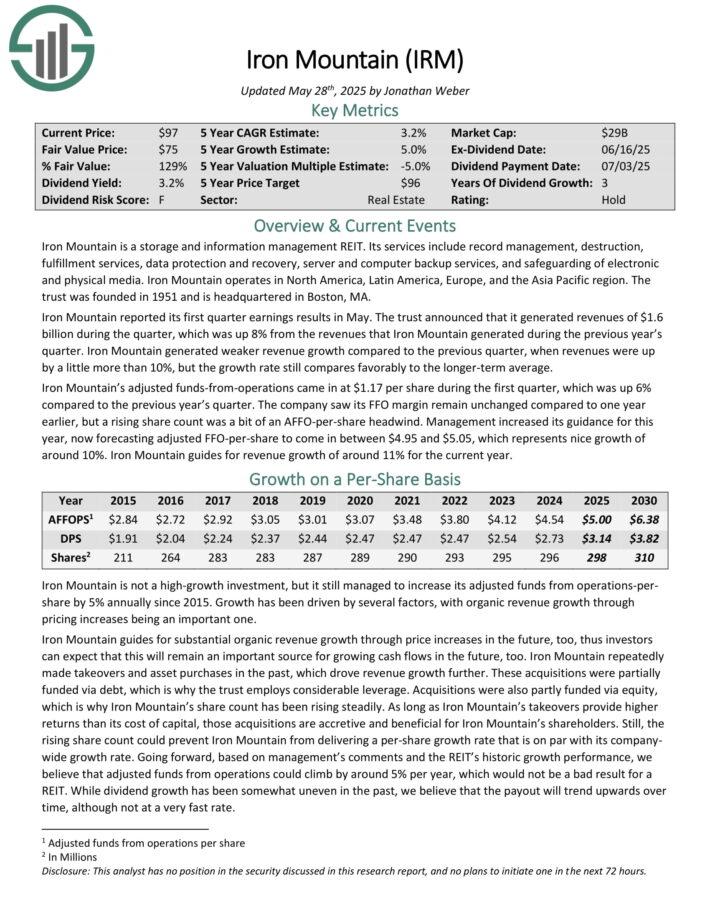
Iron Mountain reported its first quarter earnings results in May. It generated revenues of $1.6 billion during the quarter, which was up 8% year-over-year.
Adjusted funds-from-operations came in at $1.17 per share during the first quarter, which was up 6% compared to the previous year’s quarter. The company saw its FFO margin remain unchanged compared to one year earlier, but a rising share count was a bit of an AFFO-per-share headwind.
Management increased its guidance for this year, now forecasting adjusted FFO-per-share to come in between $4.95 and $5.05, which represents nice growth of around 10%. Iron Mountain guides for revenue growth of around 11% for the current year.
Click here to download our most recent Sure Analysis report on IRM (preview of page 1 of 3 shown below):
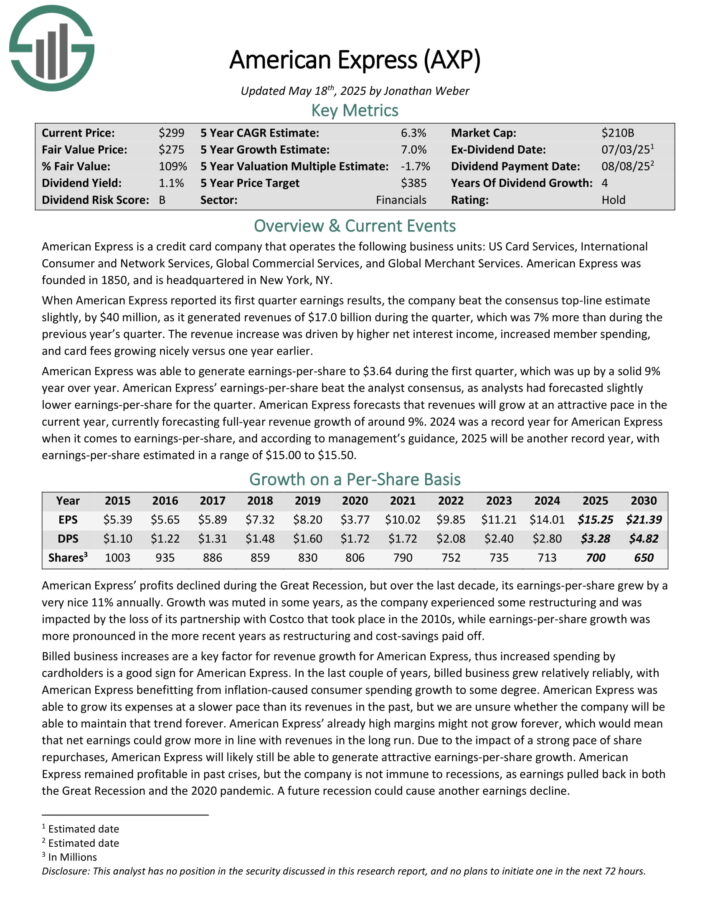
Sharpe Ratio Stock #8: American Express (AXP)
- Sharpe Ratio: 4.11
American Express is a credit card company that operates the following business units: US Card Services, International Consumer and Network Services, Global Commercial Services, and Global Merchant Services.
When American Express reported its first quarter earnings results, the company beat the consensus top-line estimate slightly, by $40 million, as it generated revenues of $17.0 billion during the quarter, which was 7% more than during the previous year’s quarter.
The revenue increase was driven by higher net interest income, increased member spending, and card fees growing nicely versus one year earlier.
American Express was able to generate earnings-per-share to $3.64 during the first quarter, which was up by 9% year over year. American Express’ earnings-per-share beat the analyst consensus, as analysts had forecast slightly lower earnings-per-share for the quarter.
American Express forecasts that revenues will grow at an attractive pace in the current year, currently forecasting full-year revenue growth of around 9%.
Click here to download our most recent Sure Analysis report on AXP (preview of page 1 of 3 shown below):
Sharpe Ratio Stock #7: Motorola Solutions (MSI)
- Sharpe Ratio: 4.26
Motorola Solutions offers purpose-built public safety and enterprise security solutions, providing technologies in Land Mobile Radio Communications (LMR), Video Security and Access Control, and Command Center software.
The company serves 100,000 public safety and commercial customers in more than 100 countries through two segments: Products and Systems Integration and Software and Services.
Motorola Solutions reported Q1 2025 results on May 1st, 2025. Sales reached a first quarter record of $2.5 billion, reflecting a 6% increase year-over-year, led by strong performance in North America.
The Products and Systems Integration segment grew 4%, driven by Land Mobile Radio Communications. In addition, the Software and Services segment rose 9%, supported by growth in Video Security, LMR services, and Command Centre software.
GAAP EPS was $2.53, and non-GAAP EPS rose 13% to $3.18. Operating cash flow hit a record $510 million for the quarter, up from $382 million in the prior year. Free cash flow increased to $473 million.
Click here to download our most recent Sure Analysis report on MSI (preview of page 1 of 3 shown below):

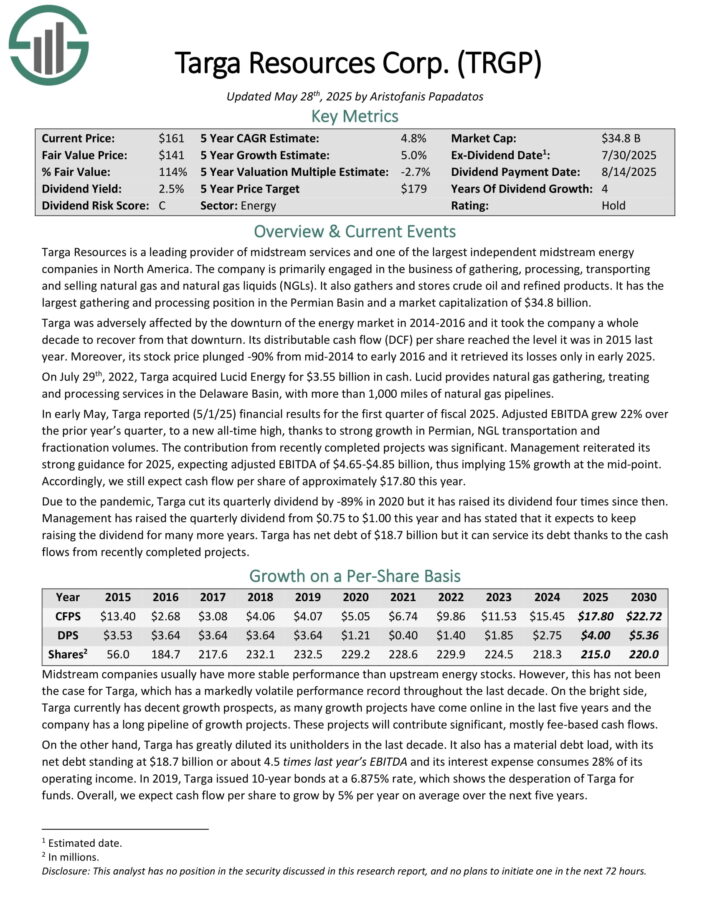
Sharpe Ratio Stock #6: Targa Resources (TRGP)
- Sharpe Ratio: 4.96
Targa Resources is a leading provider of midstream services and one of the largest independent midstream energy companies in North America.
The company is primarily engaged in the business of gathering, processing, transporting and selling natural gas and natural gas liquids (NGLs).
It also gathers and stores crude oil and refined products. It has the largest gathering and processing position in the Permian Basin.
In early May, Targa reported (5/1/25) financial results for the first quarter of fiscal 2025. Adjusted EBITDA grew 22% over the prior year’s quarter, to a new all-time high, thanks to strong growth in Permian, NGL transportation and fractionation volumes. The contribution from recently completed projects was significant.
Management reiterated its strong guidance for 2025, expecting adjusted EBITDA of $4.65-$4.85 billion, thus implying 15% growth at the mid-point. Accordingly, we still expect cash flow per share of approximately $17.80 this year.
Click here to download our most recent Sure Analysis report on TRGP (preview of page 1 of 3 shown below):
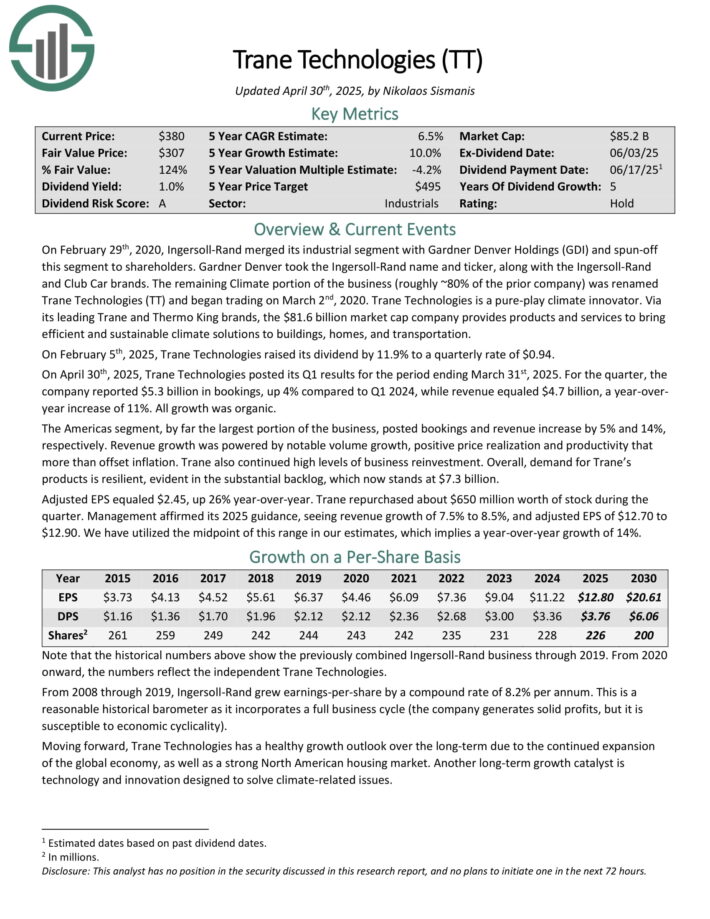
Sharpe Ratio Stock #5: Trane Technologies (TT)
- Sharpe Ratio: 5.01
Trane Technologies is a pure-play climate innovator. Through its leading Trane and Thermo King brands, the company provides products and services to bring efficient and sustainable climate solutions to buildings, homes, and transportation.
On February 5th, 2025, Trane Technologies raised its dividend by 11.9% to a quarterly rate of $0.94.
On April 30th, 2025, Trane Technologies posted its Q1 results for the period ending March 31st, 2025. For the quarter, the company reported $5.3 billion in bookings, up 4% compared to Q1 2024, while revenue equaled $4.7 billion, a year-over-year increase of 11%. All growth was organic.
The Americas segment, by far the largest portion of the business, posted bookings and revenue increase by 5% and 14%, respectively. Revenue growth was powered by notable volume growth, positive price realization and productivity that more than offset inflation.
Adjusted EPS equaled $2.45, up 26% year-over-year. Trane repurchased about $650 million worth of stock during the quarter. Management affirmed its 2025 guidance, seeing revenue growth of 7.5% to 8.5%, and adjusted EPS of $12.70 to $12.90.
Click here to download our most recent Sure Analysis report on TT (preview of page 1 of 3 shown below):
Sharpe Ratio Stock #4: KKR & Co. (KKR)
- Sharpe Ratio: 5.03
KKR & Co is a global investment company with assets under management (AUM) of $496 billion. KKR operates on four business lines: Private markets, public markets, capital markets, and principal activities.
KKR manages private equity funds that invest capital for long-term appreciation through the Private Markets business line.
KKR & Co released Q1 2025 results on May 1st, 2025. In Q1, KKR reported fee-related earnings of $823 million, up 23% year-over-year, and total operating earnings of $1.1 billion, which was a 16% increase.
Adjusted net income reached $1.0 billion, marking a 20% rise. Fee-related earnings grew 37% to $3.4 billion for the last twelve months, while total operating earnings climbed 32% to $4.5 billion.
Adjusted net income totaled $4.4 billion, reflecting a 37% increase. KKR’s assets under management (AUM) rose 15% year-over-year to $664 billion, with fee-paying AUMs up 12% to $526 billion.
Click here to download our most recent Sure Analysis report on KKR (preview of page 1 of 3 shown below):

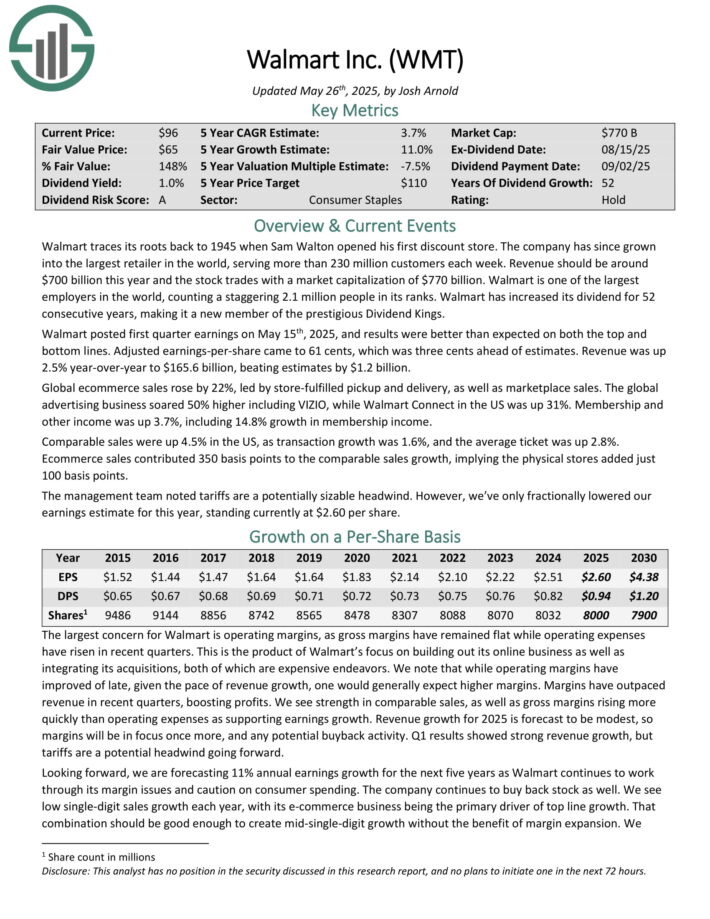
Sharpe Ratio Stock #3: Walmart Inc. (WMT)
- Sharpe Ratio: 5.04
Walmart is the largest retailer in the world, serving more than 230 million customers each week. Revenue should be around $700 billion this year and the stock trades with a market capitalization of $780 billion.
Walmart has increased its dividend for 52 consecutive years, making it a new member of the prestigious Dividend Kings.
Walmart posted first quarter earnings on May 15th, 2025, and results were better than expected on both the top and bottom lines. Adjusted earnings-per-share came to 61 cents, which was three cents ahead of estimates. Revenue was up 2.5% year-over-year to $165.6 billion, beating estimates by $1.2 billion.
Global e-commerce sales rose by 22%, led by store-fulfilled pickup and delivery, as well as marketplace sales. The global advertising business soared 50% higher including VIZIO, while Walmart Connect in the US was up 31%. Membership and other income was up 3.7%, including 14.8% growth in membership income.
Comparable sales were up 4.5% in the US, as transaction growth was 1.6%, and the average ticket was up 2.8%. E-commerce sales contributed 350 basis points to the comparable sales growth, implying the physical stores added just
100 basis points.
Click here to download our most recent Sure Analysis report on WMT (preview of page 1 of 3 shown below):
Sharpe Ratio Stock #2: Bank of New York Mellon (BK)
- Sharpe Ratio: 5.51
Bank of New York Mellon is present in 35 countries around the world and acts as more of an investment manager than a traditional bank.
Indeed, BNY Mellon’s stated goal is to help its customers manage their assets throughout the investment lifecycle. As such, BNY Mellon’s revenue is mostly derived from fees, not traditional interest income.
BNY Mellon posted first quarter earnings on April 11th, 2025, and results were better than expected on both the top and bottom lines. Adjusted earnings-per-share came to $1.58, which was nine cents ahead of estimates. Revenue was up 5.7% year-over-year to $4.79 billion, beating estimates by $20 million.
Fee revenue was up 3%, primarily reflecting net new business and higher market values, which was partially offset by the mix of assets under management flows. Investment and other revenue primarily reflect an asset disposal gain that was recorded.
Net interest income rose 11% year-over-year, primarily reflecting the reinvestment of maturing investment securities at higher yields, which was partially offset by changes in deposit mix. Assets under custody and administration rose 9%, reflecting inflows and higher market values.
Click here to download our most recent Sure Analysis report on BK (preview of page 1 of 3 shown below):

Sharpe Ratio Stock #1: Cintas Corp. (CTAS)
- Sharpe Ratio: 6.18
Cintas Corporation is the U.S. industry leader in uniform design, manufacturing & rental. The company also offers first aid supplies, safety services, and other business-related services.
Cintas qualifies to be a member of the Dividend Aristocrats Index with an impressive 42 years of consecutive dividend increases.
Cintas posted third quarter earnings on March 26th, 2025, and results were better than expected on both the top and bottom lines. The company posted third quarter earnings of $1.13 per share, seven cents ahead of expectations. Revenue was up 8.3% year-on-year to $2.16 billion, beating estimates by $10 million.
Organic revenue was up 7.9%, with strength from First Aid and Safety Services, as well as Fire Protection Services, all of which saw double-digit increases. The larger Uniform Rental and Facility Services segment was up 7%. The balance of revenue growth was due to the net of acquisitions and divestitures.
Gross margin was 50.6% of revenue, which was an all-time high from the company. This gain was due to robust operational efficiencies, including supply chain initiatives and technology-driven process enhancements.
Click here to download our most recent Sure Analysis report on CTAS (preview of page 1 of 3 shown below):

Final Thoughts
Looking for stocks with strong historical Sharpe ratios is a useful way to find investment ideas.
With that said, this strategy is not the only way to find high-quality investments. To conclude this article, we’ll provide additional resources that you can use for your investment due diligence.
If you are looking for high-quality dividend growth stocks suitable for long-term investment, the following databases will be useful:
- The Dividend Aristocrats List: dividend stocks with 25+ years of consecutive dividend increases
- The Dividend Kings List is even more exclusive than the Dividend Aristocrats. It is comprised of 55 stocks with 50+ years of consecutive dividend increases.
- The Blue Chip Stocks List: stocks that qualify as Dividend Achievers, Dividend Aristocrats, and/or Dividend Kings
- The High Dividend Stocks List: stocks that appeal to investors interested in the highest yields of 5% or more.
- The Monthly Dividend Stocks List: stocks that pay dividends every month, for 12 dividend payments per year.
You may also be looking for appealing stocks from a certain stock market sector to ensure appropriate diversification within your portfolio. If that is the case, you will find the following resources useful:
- The Complete List Of Utility Stocks
- The Complete List Of Healthcare Stocks
- The Complete List Of Technology Stocks
- The Complete List Of Communication Services Stocks
- The Complete List Of Materials Stocks
- The Complete List Of Industrial Stocks
- The Complete List Of Consumer Discretionary Stocks
- The Complete List Of Consumer Staples Stocks
- The Complete List Of Energy Stocks
- The Complete List Of Financial Stocks
You may also wish to consider other investments within the major market indices. Our downloadable list of small-cap U.S. stocks can be accessed below: