Updated on August 1st, 2024 by Bob Ciura
Data updated daily
Retirees who rely on a portfolio of high-quality dividend growth stocks to cover their living expenses have their work cut out for them. Creating a portfolio that pays a similar amount of dividend income each month is harder than it sounds.
That’s where Sure Dividend comes in. We maintain databases of stocks that pay dividends in each month of the calendar year.
You can download our complete list of August dividend stocks (along with important financial metrics like price-to-earnings ratios and dividend yields) by clicking on the link below:
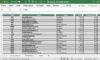
The list of stocks that pay dividends in August available for download above contains the following metrics for every security in the database:
- Last dividend payment date in August
- Stock price
- Dividend yield
- Dividend payout ratio
- Market capitalization
- Price-to-earnings ratio
- Price-to-book ratio
- Return on equity
Keep reading this article to learn more about our list of stocks that pay dividends in August.
Note: Constituents for the spreadsheet and table above are from the Wilshire 5000 index, with data provided by Ycharts and updated annually. Securities outside the Wilshire 5000 index are not included in the spreadsheet and table.
How To Use The List of Stocks That Pay Dividends in August to Find Investment Ideas
Having a spreadsheet database with the names, tickers, and financial information of every stock that pays dividends in August is very useful.
This document becomes even more powerful when combined with a working knowledge of how to use Microsoft Excel to find investment ideas.
With that in mind, this tutorial will demonstrate how you can implement two actionable investing screens to our list of stocks that pay dividends in August.
The first screen that we’ll implement is for value stocks. More specifically, we’ll screen for stocks with price-to-earnings ratios below 11 and price-to-book ratios below 1.5.
Screen 1: Price-to-Earnings Ratios Below 11, Price-to-Book Ratios Below 1.5
Step 1: Download your free list of stocks that pay dividends in August by clicking here.
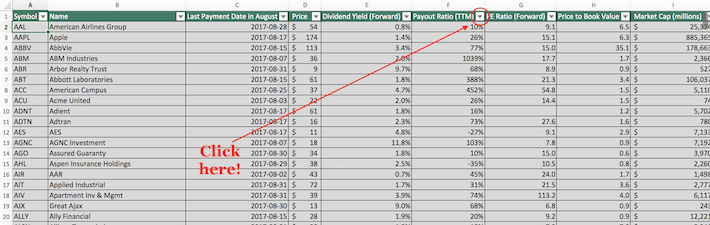
Step 2: Click the filter icon at the top of the price-to-earnings ratio column, as shown below.
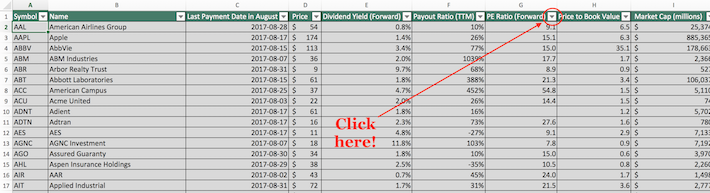
Step 3: Change the filter setting to “Less Than” and input 11 into the field beside it, as shown below. This will filter for stocks that pay dividends in August with price-to-earnings ratios below 11.
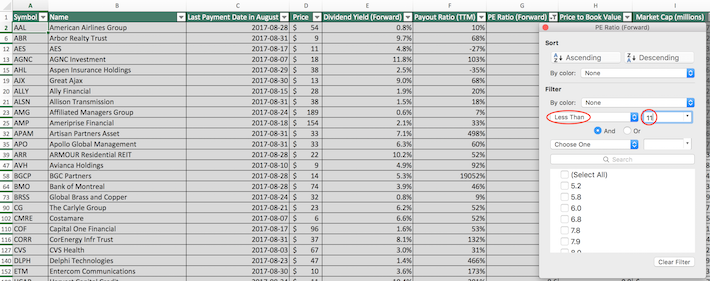
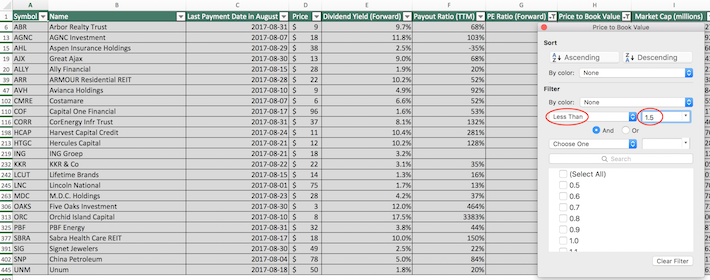
Step 4: Close out of the filter window (by clicking the exit button, not by clicking the “Clear Filter” button in the bottom right corner). Next, click the filter icon at the top of the price-to-book ratio column, as shown below.
Step 5: Change the filter setting to “Less Than” and input 1.5 into the field beside it. This will filter for stocks that pay dividends in August with price-to-book ratios less than 1.5.
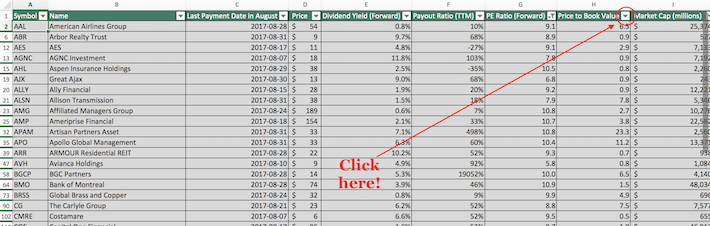
The remaining stocks in this spreadsheet are stocks that pay dividends in August with price-to-earnings ratios less than 11 and price-to-book ratios less than 1.5.
The next screen that we’ll demonstrate is for stocks that retain the majority of their earnings to fund internal growth while simultaneously trading at low multiples of these earnings.
More specifically, we’ll filter for stocks with payout ratios below 50% and price-to-earnings ratios below 15.
Screen 2: Payout Ratio Below 50%, Price-to-Earnings Ratios Below 15
Step 1: Download your free list of stocks that pay dividends in August by clicking here.
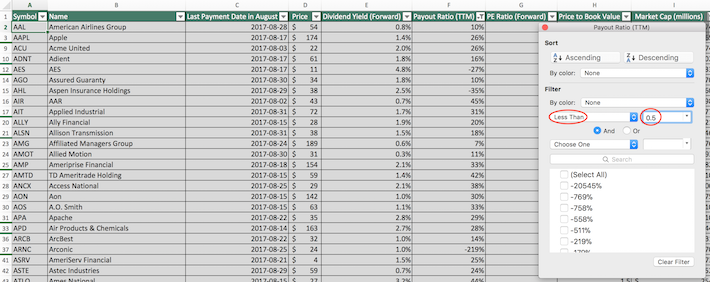
Step 2: Click the filter icon at the top of the payout ratio column, as shown below.
Step 3: Change the filter setting to “Less Than” and input 0.5 into the field beside it, as shown below. Since payout ratio is measured in percentage points, this will filter for stocks that pay dividends in August with payout ratios below 50%.
Step 4: Close out of the filter window (by clicking the exit button, not by clicking the “Clear Filter” button in the bottom right corner). Next, click the filter icon at the top of the price-to-earnings ratios column, as shown below.
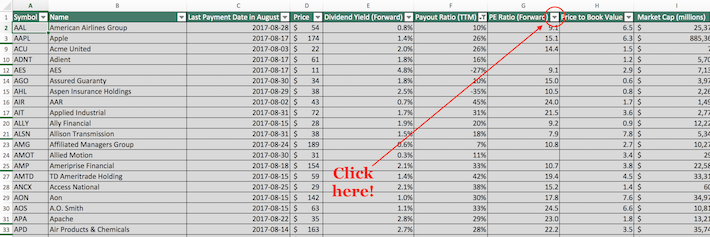
Step 5: Change the filter setting to “Less Than” and input 15 into the field beside it, as shown below. This will filter for stocks that pay dividends in August with price-to-earnings ratios below 15.
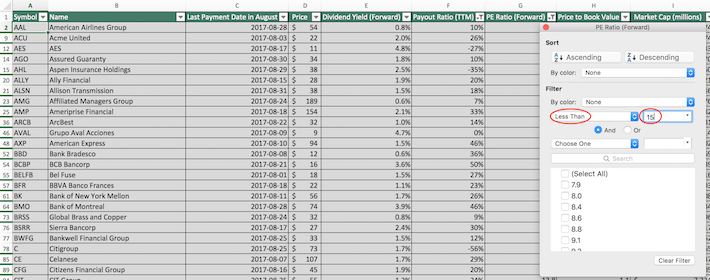
The remaining stocks in this spreadsheet are stocks that pay dividends in August with payout ratios below 50% and price-to-earnings ratios below 15.
You now have a solid, fundamental understanding of how to use our list of stocks that pay dividends in August to find investment ideas.
To close out this article, we’ll introduce several other investing resources that you can use to improve your portfolio management decision-making.
Final Thoughts: Other Useful Investing Resources
Having an Excel document with the financial information for every stock that pays dividends in August becomes much more powerful when combined with similar documents for the other 11 months of the calendar year.
Fortunately, Sure Dividend maintains databases for every other month, which you can download below:
- January Dividend Stocks
- February Dividend Stocks
- March Dividend Stocks
- April Dividend Stocks
- May Dividend Stocks
- June Dividend Stocks
- July Dividend Stocks
- September Dividend Stocks
- October Dividend Stocks
- November Dividend Stocks
- December Dividend Stocks
These databases will allow investors to appropriately diversify their investment portfolio so that a similar amount of dividend income is generated during each month of the calendar year.
Another important aspect of diversification is sector diversification. Obviously, having 500 different energy stocks will not protect your wealth if oil prices plunge.
For this reason, Sure Dividend maintains similar stock market databases for each of the 10 major stock market sectors. You can download these databases below:
- The Complete List of Energy Stocks
- The Complete List of Consumer Discretionary Stocks
- The Complete List of Consumer Staples Stocks
- The Complete List of Financial Sector Stocks
- The Complete List of Industrial Stocks
- The Complete List of Utility Stocks
- The Complete List of Materials Stocks
- The Complete List of Healthcare Stocks
- The Complete List of Communications Services Stocks
- The Complete List of Technology Stocks
Aside from diversification, our research at Sure Dividend suggests that some of the best returns in the stock market can be achieved by investing in stocks with long histories of steadily increasing dividend payments:
- The Dividend Aristocrats: S&P 500 stocks with 25+ years of consecutive dividend increases
- The Dividend Achievers: dividend stocks with 10+ years of consecutive dividend increases
- The Dividend Kings: dividend stocks with 50+ years of consecutive dividend increases
In fact, we have two premium research publications whose content is based on finding the best businesses for dividend growth into the future. You can read about our two newsletters below:
- The Sure Dividend Newsletter: high-quality dividend growth stocks
- The Sure Retirement Newsletter: high-yield dividend stocks