Updated on March 1st, 2024
Spreadsheet data updated daily
In the accumulation stage, investors do not need to generate meaningful income from their investment portfolios. They are instead focused on generating the maximum return possible for a given level of risk.
Retired investors face entirely different challenges. They need to generate consistent dividend income that varies little on a month-to-month basis. This means retirees are required to dilligently structure their portfolio so that they receive the same amount of dividends each month.
With this in mind, we have constructed a list of stocks that pay dividends in March, which you can download below:
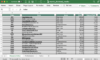
The list of stocks that pay dividends in March available for download at the link above contains the following metrics for each stock in the database:
- Name
- Ticker
- Stock price
- Dividend yield
- Market capitalization
- P/E Ratio
- Payout Ratio
- Beta
Keep reading this article to learn more about how to use the list of stocks that pay dividends in March to find investment ideas.
Note: Constituents for the spreadsheet and table above are from the Wilshire 5000 index, with data provided by Ycharts and updated annually. Securities outside the Wilshire 5000 index are not included in the spreadsheet and table.
How To Use The March Dividend Stocks List To Find Investment Ideas
Having an Excel database that contains every stock that pays dividends in March is very useful for the income-oriented investor.
This document becomes even more useful when combined with a working knowledge of Microsoft Excel.
With that in mind, this tutorial will show you how to implement two additional investing screens to the stocks in the March dividend stocks database.
The first screen that we’ll implement is for stocks that trade with low price-to-earnings multiples and above-average dividend yields.
Screen 1: Price-to-Earnings Below 15, Dividends Yields Above 3%
Step 1: Download your free list of stocks that pay dividends in March by clicking here. Apply Excel’s filter function to every column in the spreadsheet.
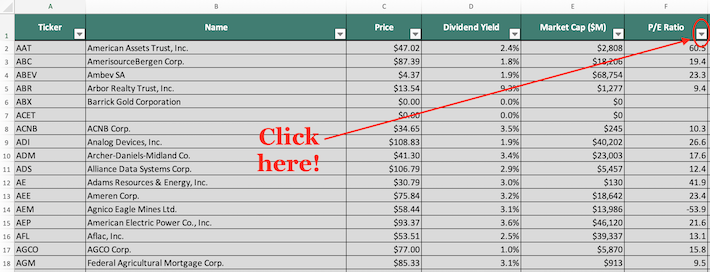
Step 2: Click the filter icon at the top of the price-to-earnings ratio column, as shown below.
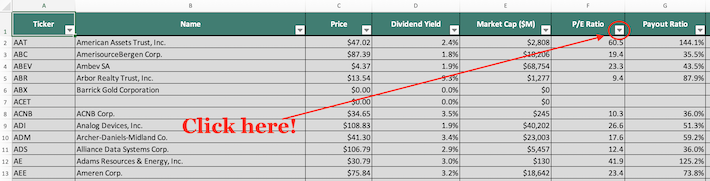
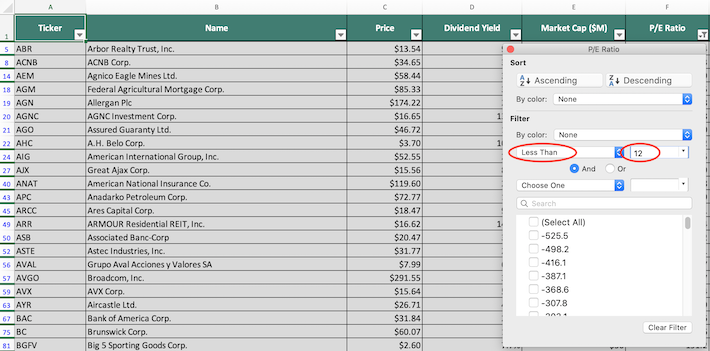
Step 3: Change the filter setting to “Less Than” and input 15 into the field beside it, as shown below. 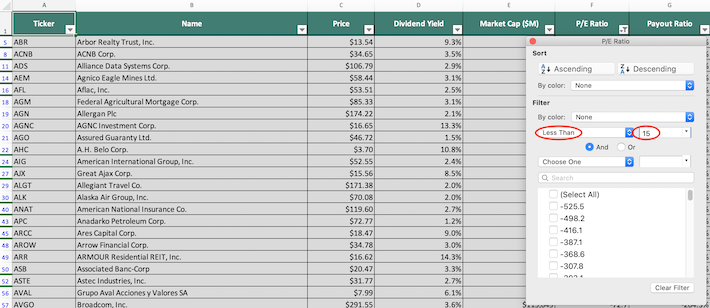
Step 4: Close out of the filter window (by clicking the exit button, not by clicking the “Clear Filter” button in the bottom right corner). Then, click on the filter button at the top of the dividend yield column, as shown below.
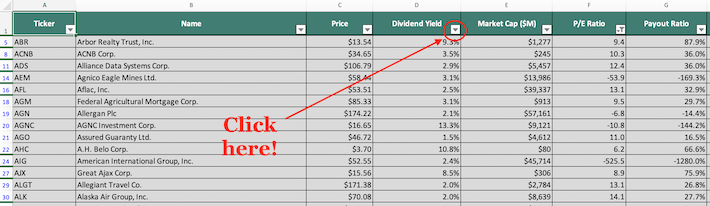
Step 5: Change the filter setting to “Greater Than” and input 0.03 into the field beside it, as shown below. Note that since dividend yield is measured in percentage points, filtering for stocks with a dividend yield above “0.03” is equivalent to filtering for stocks with dividend yields above 3%.
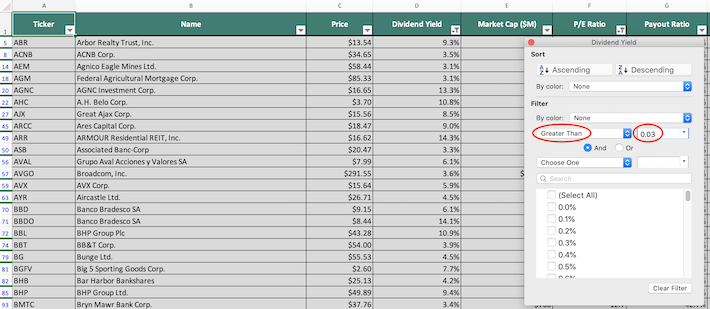
The remaining stocks in this spreadsheet are stocks that pay dividends in March that have price-to-earnings ratios below 15 and dividend yields above 3%.
The next screen that we’ll demonstrate how to implement is for small- and mid-cap value stocks. More specifically, the filter will look for stocks that pay dividends in March with price-to-earnings ratios below 12 and market capitalizations below $10 billion.
Screen 2: Price-to-Earnings Ratios Below 12, Market Capitalizations Below $10 Billion
Step 1: Download your free list of stocks that pay dividends in March by clicking here. Apply Excel’s filter function to every column in the spreadsheet.
Step 2: Click the filter icon at the top of the price-to-earnings ratio column, as shown below.
Step 3: Change the filter setting to “Less Than” and input 12 into the field beside it, as shown below. This will filter for stocks that pay dividends in March with price-to-earnings ratios less than 12.
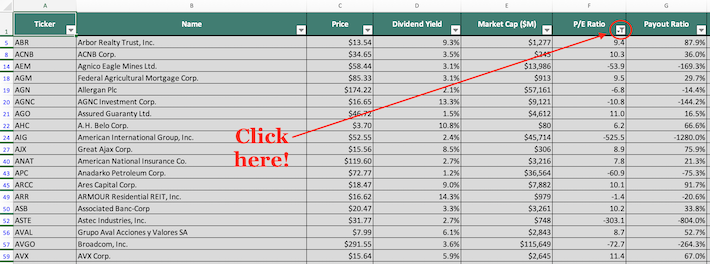
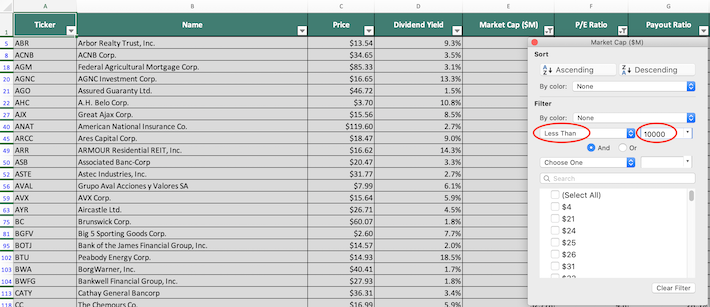
Step 4: Close out of the filter window (by clicking the exit button, not by clicking the “Clear Filter” button in the bottom right corner). Next, click the filter icon at the top of the market capitalization column, as shown below.
Step 5: Change the filter setting to “Less Than” and input 10000 into the field beside it, as shown below. Since market capitalization is measured in millions of dollars in this spreadsheet, filtering for stocks with market capitalizations below “$10,000 million” is equivalent to screening for securities with aggregate capitalizations below $10 billion.
You now have a solid, fundamental understanding of how to use the March dividend stocks list to find investment ideas.
The remainder of this article will introduce other investing resources that have the ability to improve your long-term investing outcomes.
Final Thoughts: Other Useful Investing Resources
Having an Excel document that contains the name, tickers, and financial information for all stocks that pay dividends in March is quite useful – but it becomes far more useful when combined with other databases for the non-March months of the calendar year.
Fortunately, Sure Dividend also maintains similar databases for the other 11 months of the year. You can access these databases below:
- The Complete List of Stocks That Pay Dividends in January
- The Complete List of Stocks That Pay Dividends in February
- The Complete List of Stocks That Pay Dividends in April
- The Complete List of Stocks That Pay Dividends in May
- The Complete List of Stocks That Pay Dividends in June
- The Complete List of Stocks That Pay Dividends in July
- The Complete List of Stocks That Pay Dividends in August
- The Complete List of Stocks That Pay Dividends in September
- The Complete List of Stocks That Pay Dividends in October
- The Complete List of Stocks That Pay Dividends in November
- The Complete List of Stocks That Pay Dividends in December
Having a database of every stock that pays dividends in March allows you to diversify your dividend income based on which month it is paid.
However, this is not all the diversification that an investor really needs. They should also be diversified by sector.
With this in mind, Sure Dividend maintains sector-specific stock market databases which you can download (for free) at the links below:
- The Complete List of Industrial Stocks
- The Complete List of Communication Services Stocks
- The Complete List of Materials Stocks
- The Complete List of Utility Stocks
- The Complete List of Consumer Staples Stocks
- The Complete List of Consumer Discretionary Stocks
- The Complete List of Technology Stocks
- The Complete List of Healthcare Stocks
- The Complete List of Energy Stocks
- The Complete List of Financial Stocks
Another form of diversification is by size. Investors should own a healthy balance of small-capitalization stocks, mid-capitalization stocks, and mega-cap stocks:
- The Mega-Cap Stocks List: Stocks With Market Capitalizations Above $200 Billion
- The Complete List of NASDAQ-100 Stocks
- The Complete List of Russell 2000 Stocks
Diversification aside, there is a substantial body of evidence that proves that stocks that consistently raise their dividends over time tend to outperform the broader stock market. With this in mind, the following databases contain some of the most promising businesses in our investing universes:
- The Dividend Aristocrats: S&P 500 stocks with 25+ years of consecutive dividend increases
- The Dividend Achievers: dividend stocks with 10+ years of consecutive dividend increases
- The Dividend Kings: considered to be the best-of-the-best among dividend growth stocks, the Dividend Kings is comprised of dividend stocks with 50+ years of consecutive dividend increases.
- Blue Chip Stocks: Stocks that are on either the Dividend Achievers, Dividend Aristocrats, and/or Dividend Kings lists.