Spreadsheet data updated daily
Retirees face many unique situations from the perspective of maximizing the utility of their investment portfolio.
In fact, perhaps the most difficult challenge is structuring your portfolio such that it generates a consistent amount of dividend income each month.
This goal is essentially impossible without detailed databases of dividend stocks divided by the calendar month of their payment dates.
That’s where Sure Dividend comes in. We maintain databases of stocks that pay dividends in each month of the calendar year.
You can download our database for stocks that pay dividends in December below:
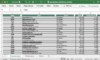
The list of stocks that pay dividends in December available for download at the link above contains the following information for each stock in the index:
- Name
- Ticker
- Stock price
- Dividend yield
- Market capitalization
- P/E Ratio
- Payout Ratio
- Beta
Keep reading this article to learn more about how to use our list of stocks that pay dividends in December to improve your investing outcomes.
Note: Constituents for the spreadsheet and table above are from the Wilshire 5000 index, with data provided by Ycharts and updated annually.
Securities outside the Wilshire 5000 index are not included in the spreadsheet and table.
How To Use Our List of Stocks That Pay Dividends in December to Find Investment Ideas
Having a list of every stock that pays dividends in December can be extremely useful.
This database becomes even more valuable when combined with a working knowledge of Microsoft Excel.
With that in mind, this tutorial will show you how to implement two interesting investing screens to the list of stocks that pay dividends in December.
The first screen that we’ll implement is for stocks that pay dividends in December with price-to-earnings ratios below 15 and dividend payout ratios between 50% and 100%.
Screen 1: Price-to-Earnings Ratios Below 15 and Payout Ratios Between 50% and 100%
Step 1: Download your free list of stocks that pay dividends in December by clicking here. Apply the filter function to every column in the spreadsheet.
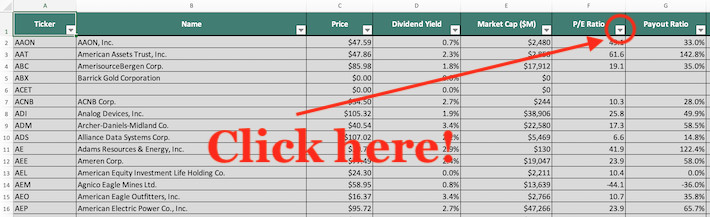
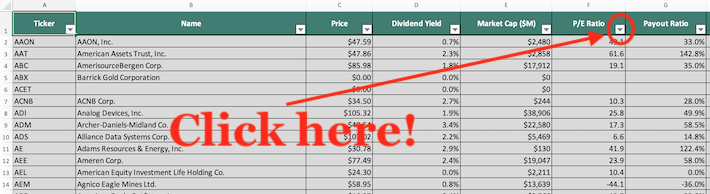
Step 2: Click the filter icon at the top of the price-to-earnings ratio column, as shown below.
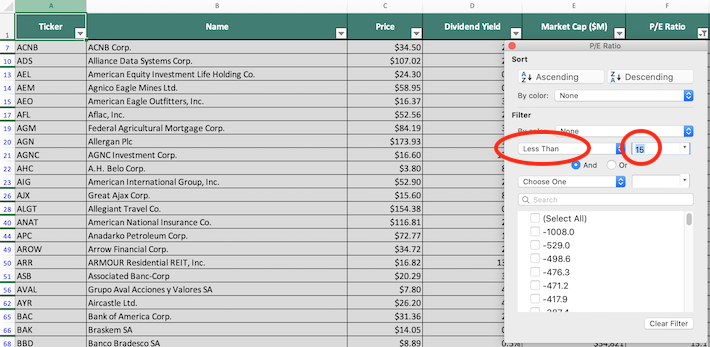
Step 3: Change the filter setting to “Less Than: and input 15 into the field beside it, as shown below. This will filter for stocks that pay dividends in December with price-to-earnings ratios below 15.
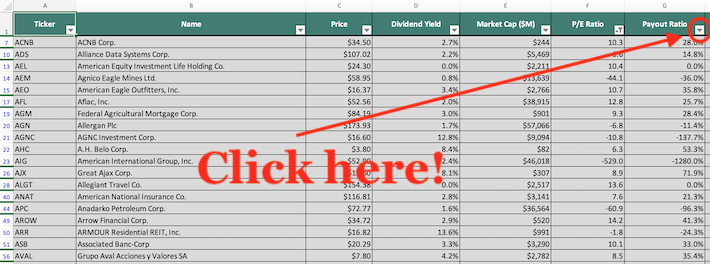
Step 4: Close out of the filter window (by clicking the exit button, not by clicking the “Clear Filter” button in the bottom right corner). Next, click the filter icon at the top of the payout ratio column, as shown below.
Step 5: Change the primary filter setting to “Less Than” and input 1 into the field beside it, as shown below. This will filter for stocks that pay dividends in December with dividend payout ratios below 100%.
Next, change the secondary filter setting to “Greater Than” and input 50% into the field beside it, as shown below.
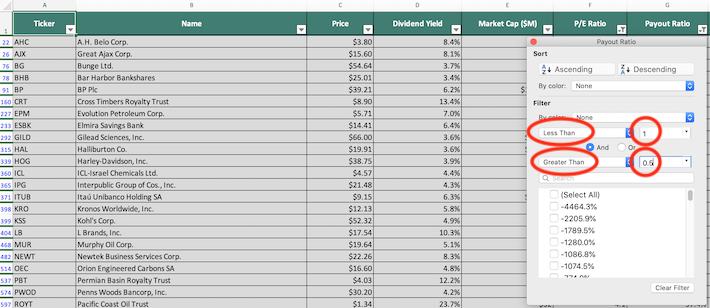
The remaining stocks that show in this Excel sheet are stocks that pay dividends in December with price-to-earnings below 15 and dividend payout ratios between 50% and 100%.
The next screen that we’ll demonstrate how to implement is a filter designed to eliminate overvalued stocks. More specifically, we’ll demonstrate how to search for stocks with price-to-earnings ratios below 20 and dividend yields above 2%
Screen 2: Price-to-Earnings Ratios Below 20, Dividend Yield Above 2%
Step 1: Download your free list of stocks that pay dividends in December by clicking here. Apply the filter function to every column in the spreadsheet.
Step 2: Click the filter icon at the top of the price-to-earnings ratio column, as shown below.
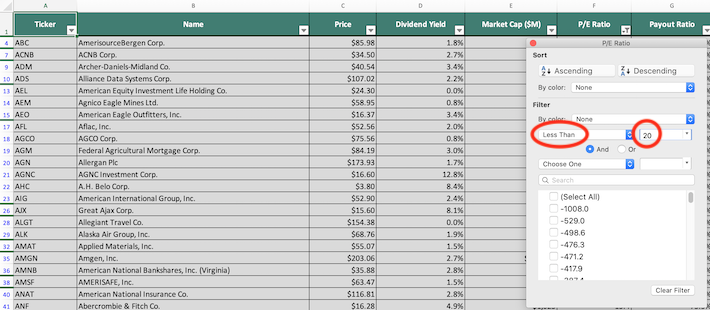
Step 3: Change the filter setting to “Less Than” and input 20 into the field beside it, as shown below. This will filter for stocks that pay dividends in December with price-to-earnings ratios below 20.
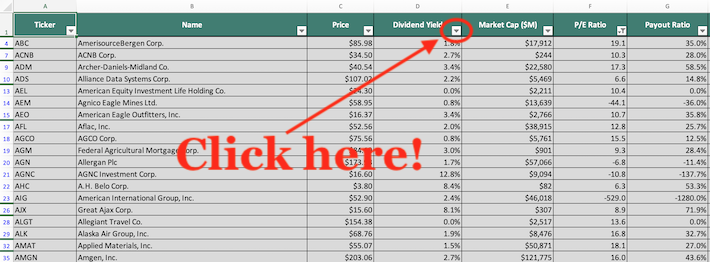
Step 4: Close out of the filter window (by clicking the exit button, not by clicking the “Clear Filter” button in the bottom right corner). Next, click the filter icon at the top of the dividend yield column, as shown below.
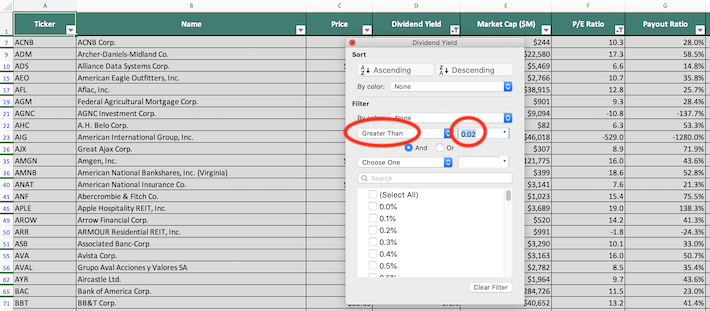
Step 5: Change the filter setting to “Greater Than” and type 2% into the field beside it, as shown below. This will filter for stocks that pay dividends in December with dividend yields above 2%.
The remaining stocks that show in this spreadsheet are stocks that pay dividends in December with price-to-earnings ratios below 20 and dividend yields above 2%.
You now have a solid, fundamental understanding of how to use the list of stocks that pay dividends in December to find investment ideas.
To close this article, we will introduce to you several other investing resources that will help you to make better decisions along your investing journey.
Final Thoughts: Other Useful Investing Resources
Having an Excel document that contains the name, tickers, and financial information for all stocks that pay dividends in December is quite useful – but it becomes far more useful when combined with other databases for the non-December months of the calendar year.
Fortunately, Sure Dividend also maintains similar databases for the other 11 months of the year. You can access these databases below:
- The Complete List of Stocks That Pay Dividends in January
- The Complete List of Stocks That Pay Dividends in February
- The Complete List of Stocks That Pay Dividends in March
- The Complete List of Stocks That Pay Dividends in April
- The Complete List of Stocks That Pay Dividends in May
- The Complete List of Stocks That Pay Dividends in June
- The Complete List of Stocks That Pay Dividends in July
- The Complete List of Stocks That Pay Dividends in August
- The Complete List of Stocks That Pay Dividends in September
- The Complete List of Stocks That Pay Dividends in October
- The Complete List of Stocks That Pay Dividends in November
These databases, used in conjunction with one another, will allow you to create a portfolio whose dividend income is diversified by calendar month.
Another important aspect of a well-diversified investment portfolio is sector diversification. For obvious reasons, having all of your money invested in energy stocks does not mean you’re diversified – even if you own 500 different energy stocks.
With this in mind, Sure Dividend maintains databases for each of the 10 major sectors of the stock market. You can download these databases below:
- The Complete List of Utility Stocks
- The Complete List of Consumer Cyclical Stocks
- The Complete List of Consumer Staples Stocks
- The Complete List of Financial Sector Stocks
- The Complete List of Telecommunications Stocks
- The Complete List of Energy Stocks
- The Complete List of Technology Stocks
- The Complete List of Materials Stocks
- The Complete List of Healthcare Stocks
- The Complete List of Industrial Stocks
Diversification aside, we believe that some of the most compelling investment opportunities in the public markets exist with companies that have consistently increased their annual dividend payments.
With that principle in mind, the following Sure Dividend databases are great places to look for investment ideas:
- The Dividend Aristocrats List: S&P 500 stocks with 25+ years of consecutive dividend increases
- The Dividend Achievers List: dividend stocks with 10+ years of consecutive dividend increases
- The Dividend Kings List: dividend stocks with 50+ years of consecutive dividend increases
In fact, Sure Dividend’s entire research philosophy is focused on identifying companies with above-average total return potential combined with strong dividend growth prospects.
We publish our research findings in the following monthly research publications:
- The Sure Dividend Newsletter: high-quality dividend growth stocks
- The Sure Retirement Newsletter: high yield (4%+) dividend stocks