Updated on July 21st, 2025 by Bob Ciura
Spreadsheet data updated daily
In the world of investing, volatility matters.
Investors are reminded of this every time there is a downturn in the broader market and individual stocks that are more volatile than others experience enormous swings in price in both directions.
That volatility can increase the risk in an individual’s stock portfolio relative to the broader market.
The volatility of a security or portfolio against a benchmark – is called Beta. In short, Beta is measured via a formula that calculates the price risk of a security or portfolio against a benchmark, which is typically the broader market as measured by the S&P 500 Index.
It is helpful in understanding the overall price risk level for investors during market downturns in particular.
Here’s how to read stock betas:
- A beta of 1.0 means the stock moves equally with the S&P 500
- A beta of 2.0 means the stock moves twice as much as the S&P 500
- A beta of 0.0 means the stocks moves don’t correlate with the S&P 500
- A beta of -1.0 means the stock moves precisely opposite the S&P 500
Interestingly, low beta stocks have historically outperformed the market… But more on that later.
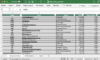
You can download a spreadsheet of the 100 lowest beta stocks (along with financial metrics like price-to-earnings ratios and dividend yields) by clicking on the link below:
This article will discuss how to calculate beta, the difference between high-beta and low-beta stocks, as well as individual analysis of the one stock in the S&P 500 Index with negative beta right now.
The table of contents provides for easy navigation of the article:
Table of Contents
- High Beta Stocks Versus Low Beta Stocks
- How To Calculate Beta
- Beta & The Capital Asset Pricing Model (CAPM)
- Analysis On The S&P 500 Stock With Negative Beta
- Final Thoughts
High Beta Stocks Versus Low Beta
Beta is helpful in understanding the overall price risk level for investors during market downturns in particular. The lower the Beta value, the less volatility the stock or portfolio should exhibit against the benchmark.
This is beneficial for investors for obvious reasons, particularly those that are close to or already in retirement, as drawdowns should be relatively limited against the benchmark.
Low or high Beta simply measures the size of the moves a security makes; it does not mean necessarily that the price of the security stays nearly constant.
Securities can be low Beta and still be caught in long-term downtrends, so this is simply one more tool investors can use when building a portfolio.
Intuitively, it would make sense that high Beta stocks would outperform during bull markets. After all, these stocks should be achieving more than the benchmark’s returns given their high Beta values.
While this can be true over short periods of time – particularly the strongest parts of the bull market – the high Beta names are generally the first to be sold heavily by investors.
This excellent paper from the CFA Institute theorizes that this is true because investors are able to use leverage to bid up momentum names with high Beta values and thus, on average, these stocks have lower prospective returns at any given time.
In addition, leveraged positions are among the first to be sold by investors during weak periods because of margin requirements or other financing concerns that come up during bear markets.
While high Beta names may outperform while the market is strong, as signs of weakness begin to show, high Beta names are the first to be sold and generally, much more strongly than the benchmark.
Evidence suggests that during good years for the market, high Beta names capture 138% of the market’s total returns.
Therefore, if the market returned 10% in a year, high Beta names would, on average, produce 13.8% returns. However, during down years, high Beta names capture 243% of the market’s returns.
In a similar example, if the market lost 10% during a year, the group of high Beta names would have returned -24.3%.
Given this relatively small outperformance during good times and vast underperformance during weak periods, it is easy to see why we prefer low Beta stocks.
While low Beta stocks aren’t completely immune from downturns in the market, it is much easier to make the case over the long run for low Beta stocks versus high Beta given how each group performs during bull and bear markets.
How To Calculate Beta
The formula to calculate a security’s Beta is fairly straightforward. The result, expressed as a number, shows the security’s tendency to move with the benchmark.
Beta of 1.00 means that the security in question should move virtually in lockstep with the benchmark (as discussed briefly in the introduction of this article).
Beta of 2.00 means moves should be twice as large in magnitude.
Finally, a negative Beta means that returns in the security and benchmark are negatively correlated; these securities tend to move in the opposite direction from the benchmark.
This sort of security would be helpful to mitigate broad market weakness in one’s portfolio as negatively correlated returns would suggest the security in question would rise while the market falls.
For those investors seeking high Beta, stocks with values in excess of 1.3 would be the ones to seek out. These securities would offer investors at least 1.3X the market’s returns for any given period.
Here’s a look at the formula to compute Beta:
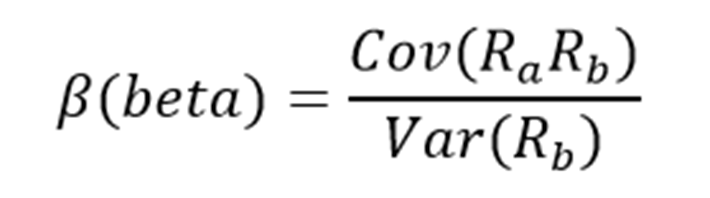
The numerator is the covariance of the asset in question while the denominator is the variance of the market. These complicated-sounding variables aren’t actually that difficult to compute.
Here’s an example of the data you’ll need to calculate Beta:
- Risk-free rate (typically Treasuries at least two years out)
- Your asset’s rate of return over some period (typically one year to five years)
- Your benchmark’s rate of return over the same period as the asset
To show how to use these variables to do the calculation of Beta, we’ll assume a risk-free rate of 2%, our stock’s rate of return of 14% and the benchmark’s rate of return of 8%.
You start by subtracting the risk-free rate of return from both the security in question and the benchmark. In this case, our asset’s rate of return net of the risk-free rate would be 12% (14% – 2%). The same calculation for the benchmark would yield 6% (8% – 2%).
These two numbers – 12% and 6%, respectively – are the numerator and denominator for the Beta formula. Twelve divided by six yields a value of 2.00, and that is the Beta for this hypothetical security.
On average, we’d expect an asset with this Beta value to be 200% as volatile as the benchmark.
Thinking about it another way, this asset should be about twice as volatile than the benchmark while still having its expected returns correlated in the same direction.
That is, returns would be correlated with the market’s overall direction, but would return double what the market did during the period.
This would be an example of a very high Beta stock and would offer a significantly higher risk profile than an average or low Beta stock.
Beta & The Capital Asset Pricing Model
The Capital Asset Pricing Model, or CAPM, is a common investing formula that utilizes the Beta calculation to account for the time value of money as well as the risk-adjusted returns expected for a particular asset.
Beta is an essential component of the CAPM because without it, riskier securities would appear more favorable to prospective investors as their risk wouldn’t be accounted for in the calculation.
The CAPM formula is as follows:

The variables are defined as:
- ERi = Expected return of investment
- Rf = Risk-free rate
- βi = Beta of the investment
- ERm = Expected return of market
The risk-free rate is the same as in the Beta formula, while the Beta that you’ve already calculated is simply placed into the CAPM formula.
The expected return of the market (or benchmark) is placed into the parentheses with the market risk premium, which is also from the Beta formula. This is the expected benchmark’s return minus the risk-free rate.
To continue our example, here is how the CAPM actually works:
ER = 2% + 2.00(8% – 2%)
In this case, our security has an expected return of 14% against an expected benchmark return of 8%.
In theory, this security should vastly outperform the market to the upside but keep in mind that during downturns, the security would suffer significantly larger losses than the benchmark.
If we changed the expected return of the market to -8% instead of +8%, the same equation yields expected returns for our hypothetical security of -18%.
This security would theoretically achieve stronger returns to the upside but certainly much larger losses on the downside, highlighting the risk of high Beta names during anything but strong bull markets.
While the CAPM certainly isn’t perfect, it is relatively easy to calculate and gives investors a means of comparison between two investment alternatives.
Analysis On The S&P 500 Stock With Negative Beta
Now, we’ll take a look at the S&P 500 stock that currently has a negative beta value. At the time of publication, there was only one stock in the S&P 500 Index with a negative beta value, according to a stock screen from FinViz.
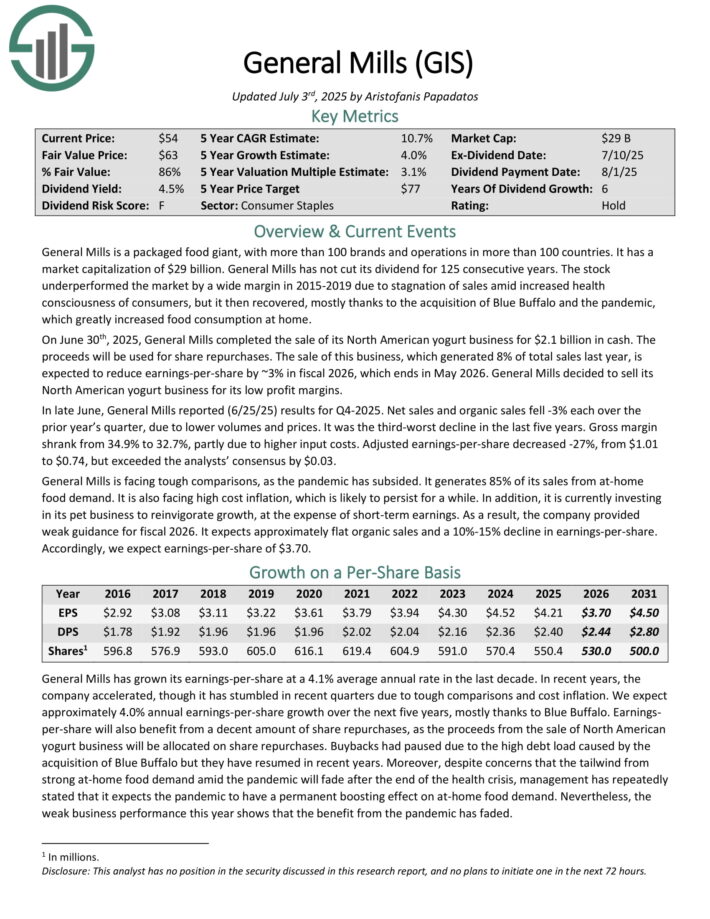
Negative Beta Stock: General Mills (GIS)
General Mills is a packaged food giant, with more than 100 brands and operations in more than 100 countries. General Mills has not cut its dividend for 125 consecutive years. According to a Finviz screen, GIS stock has a negative beta value of -0.01.
On June 30th, 2025, General Mills completed the sale of its North American yogurt business for $2.1 billion in cash. The proceeds will be used for share repurchases. The sale of this business, which generated 8% of total sales last year, is expected to reduce earnings-per-share by ~3% in fiscal 2026.
In late June, General Mills reported (6/25/25) results for Q4-2025. Net sales and organic sales fell -3% each over the prior year’s quarter, due to lower volumes and prices. It was the third-worst decline in the last five years.
Gross margin shrank from 34.9% to 32.7%, partly due to higher input costs. Adjusted earnings-per-share decreased -27%, from $1.01 to $0.74, but exceeded the analysts’ consensus by $0.03.
Click here to download our most recent Sure Analysis report on GIS (preview of page 1 of 3 shown below)
Final Thoughts
Beta is one of the most widely-used measures of stock market volatility. Beta can be a valuable tool for investors when analyzing stocks for inclusion in their portfolios.
Stocks with negative betas are expected to move inversely to the broader market. Negative-beta stocks could be particularly appealing in a recession or a market downturn.
If you are interested in finding more high-quality dividend growth stocks suitable for long-term investment, the following Sure Dividend databases will be useful:
- The Dividend Kings List is even more exclusive than the Dividend Aristocrats. It is comprised of 53 stocks with 50+ years of consecutive dividend increases.
- The Dividend Achievers List: a group of stocks with 10+ years of consecutive dividend increases.
- The Dividend Champions List: stocks that have increased their dividends for 25+ consecutive years.
Note: Not all Dividend Champions are Dividend Aristocrats because Dividend Aristocrats have additional requirements like being in The S&P 500. - The Dividend Contenders List: 10-24 consecutive years of dividend increases.
- The Dividend Challengers List: 5-9 consecutive years of dividend increases.
- The Monthly Dividend Stocks List: contains stocks that pay dividends each month, for 12 payments per year.
- The 20 Highest Yielding Monthly Dividend Stocks
The major domestic stock market indices are another solid resource for finding investment ideas. Sure Dividend compiles the following stock market databases and updates them regularly: