Updated on November 22nd, 2024 by Bob Ciura
Many that follow the dividend growth investment strategy aim to live off the income their portfolio provides in retirement.
We believe that those that follow this strategy can have a more worry-free retirement experience as the investor’s portfolio can provide income regardless of the state of the economy.
This is why we believe that investors should focus on owning high-quality dividend-paying stocks such as the Dividend Aristocrats, which are those companies that have raised their dividends for at least 25 consecutive years.
Membership in this group is so exclusive that just 66 companies qualify as Dividend Aristocrat.
We have compiled a list of all 66 Dividend Aristocrats and relevant financial metrics like dividend yield and P/E ratios.
You can download the full list of Dividend Aristocrats by clicking on the link below:
Disclaimer: Sure Dividend is not affiliated with S&P Global in any way. S&P Global owns and maintains The Dividend Aristocrats Index. The information in this article and downloadable spreadsheet is based on Sure Dividend’s own review, summary, and analysis of the S&P 500 Dividend Aristocrats ETF (NOBL) and other sources, and is meant to help individual investors better understand this ETF and the index upon which it is based. None of the information in this article or spreadsheet is official data from S&P Global. Consult S&P Global for official information.
In a perfect world, investors would receive the same or similar amount of income from their portfolio every month as expenses are usually consistent.
But this is not the case as many companies typically distribute their dividends at the end of each quarter, which is usually in March, June, September, and December.
This can make for uneven cash flows throughout the year, which presents some issues for investors that require similar income month-to-month.
Still, investors can construct a diversified portfolio with high-quality, dividend-paying stocks that can provide similar amounts of income every month of the year.
To that end, we have created a model portfolio of 15 stocks. Each stock has at least nine years of dividend growth, with the average position having a dividend growth streak of 25 years.
Stocks were selected from various sectors, giving the investor a diversified portfolio that would provide income each month of the year.
January, April, July, and October Payments
PepsiCo, Inc. (PEP)
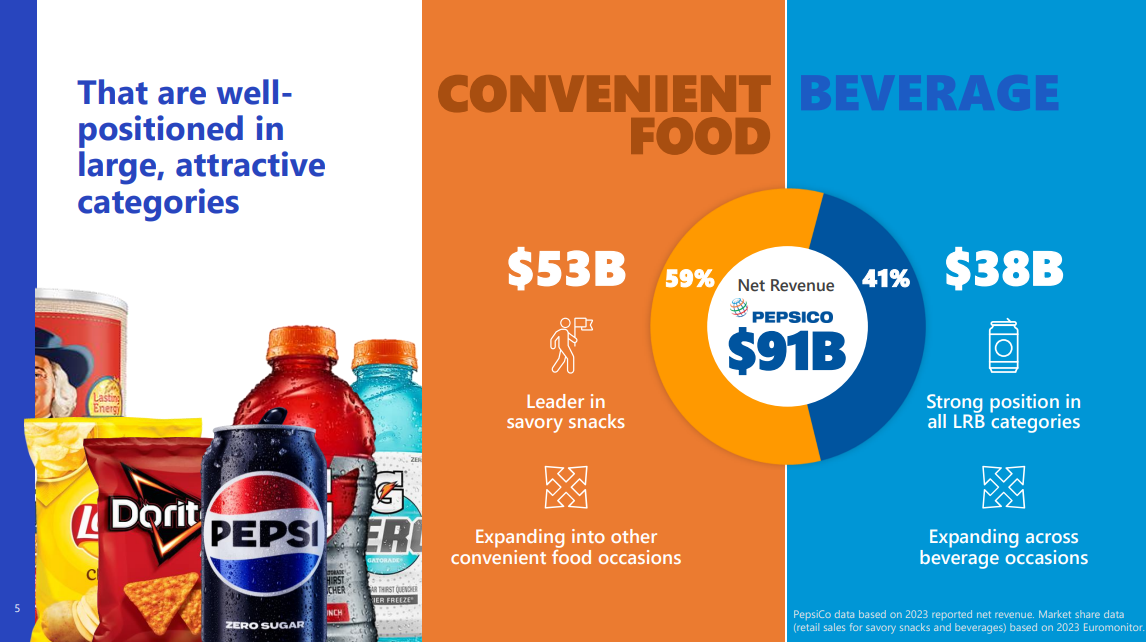
PepsiCo is a global food and beverage company that generates $89 billion in annual sales. The company’s products include Pepsi, Mountain Dew, Frito-Lay chips, Gatorade, Tropicana orange juice and Quaker foods.
Its business is split roughly 60-40 in terms of food and beverage revenue. It is also balanced geographically between the U.S. and the rest of the world.
Source: Investor Presentation
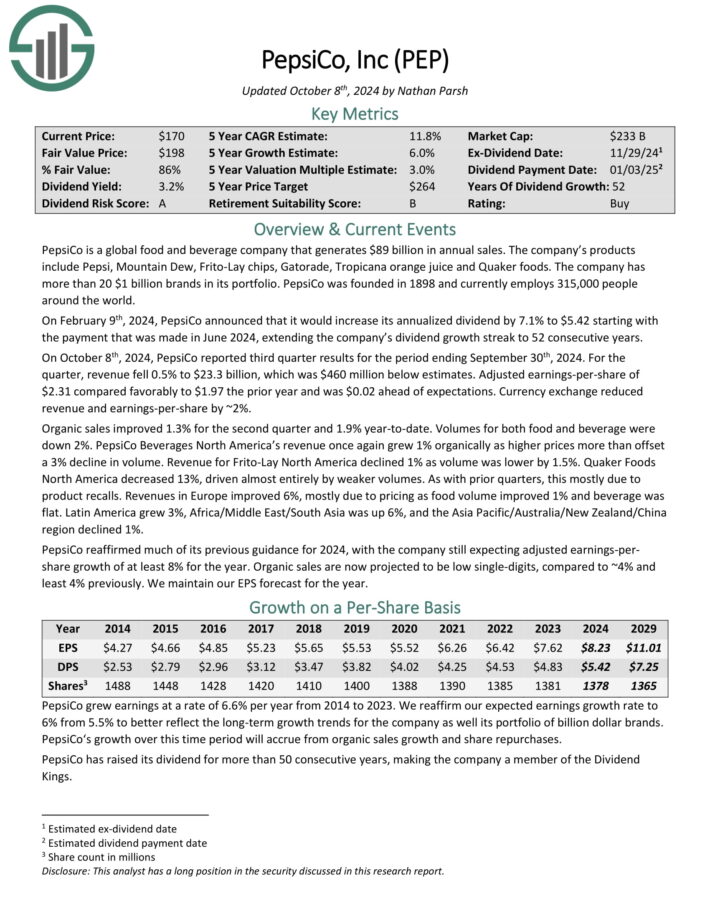
On October 8th, 2024, PepsiCo reported third quarter results for the period ending September 30th, 2024. For the quarter, revenue fell 0.5% to $23.3 billion, which was $460 million below estimates.
Adjusted earnings-per-share of $2.31 compared favorably to $1.97 the prior year and was $0.02 ahead of expectations. Currency exchange reduced revenue and earnings-per-share by ~2%.
Organic sales improved 1.3% for the second quarter and 1.9% year-to-date. Volumes for both food and beverage were down 2%.
PepsiCo Beverages North America’s revenue once again grew 1% organically as higher prices more than offset a 3% decline in volume.
Click here to download our most recent Sure Analysis report on PEP (preview of page 1 of 3 shown below):
Medtronic plc (MDT)
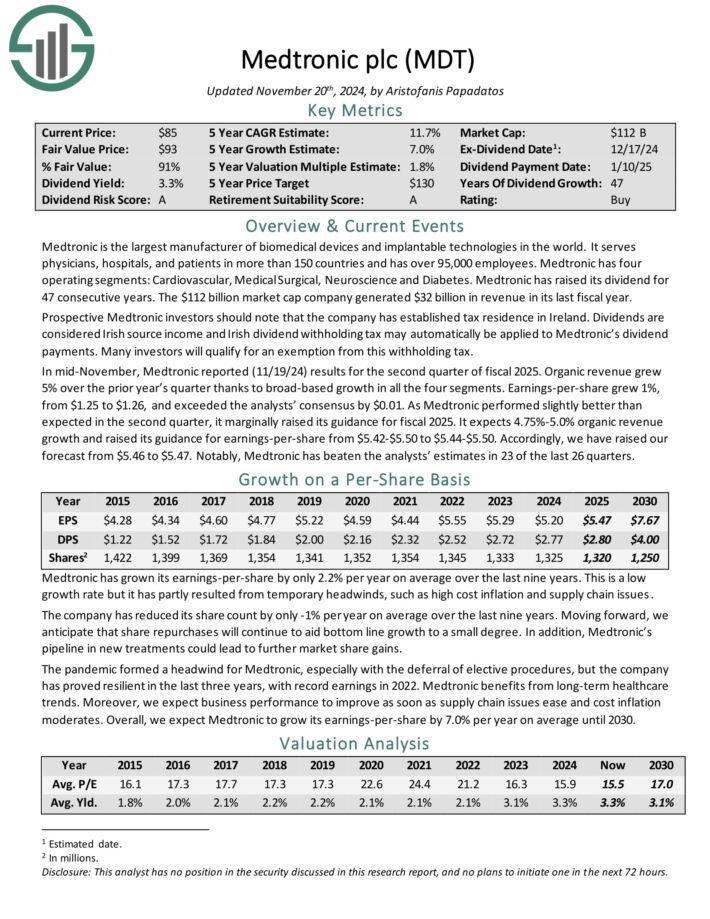
Medtronic, which has operations in more than 150 countries, is the world’s largest manufacturer of biomedical devices and implantable technologies. The company consists of segments, including Cardiovascular, Medical Surgical, Neuroscience, and Diabetes.
Aging worldwide demographics should provide a tailwind to the company’s business as increased access to healthcare products and services becomes more necessary. There are nearly 70 million Baby Boomers in the U.S. alone that will need increasing amounts of medical care as they age.
In mid-November, Medtronic reported (11/19/24) results for the second quarter of fiscal 2025. Organic revenue grew 5% over the prior year’s quarter thanks to broad-based growth in all the four segments. Earnings-per-share grew 1%, from $1.25 to $1.26, and exceeded the analysts’ consensus by $0.01.
As Medtronic performed slightly better than expected in the second quarter, it marginally raised its guidance for fiscal 2025.
Click here to download our most recent Sure Analysis report on Medtronic plc (MDT) (preview of page 1 of 3 shown below):
Philip Morris International (PM)
After being spun off from parent company Altria Group (MO) in 2008, Philip Morris is one of the largest international marketers of tobacco products. The company offers many products, but Marlboro is its most well-known brand.
Tobacco usage is falling in the U.S., but Philip Morris is not exposed to this market after separating from its parent company.
On October 22nd, 2024, Philip Morris reported its Q3 results for the period ending September 30th, 2024. For the quarter, the company posted net revenues of $9.91 billion, up 8.4% year-over-year. Adjusted EPS was $1.91, up 14.4% compared to Q3 2023. In constant currency, adjusted EPS grew by an even greater 18.0%.
Total shipment volumes were up 2.9% collectively, driven by growth across the board. It was also encouraging to see that combustibles experienced a rise in volume, effectively sustaining their positive trajectory after years of declines.
Specifically, shipment volumes in cigarettes, heated tobacco, and oral products rose 2.9%, 8.9%, and 22.2%, respectively. The Swedish Match buyout significantly contributed to the increase in oral products’ shipment volumes.
Click here to download our most recent Sure Analysis report on Philip Morris International (PM) (preview of page 1 of 3 shown below):
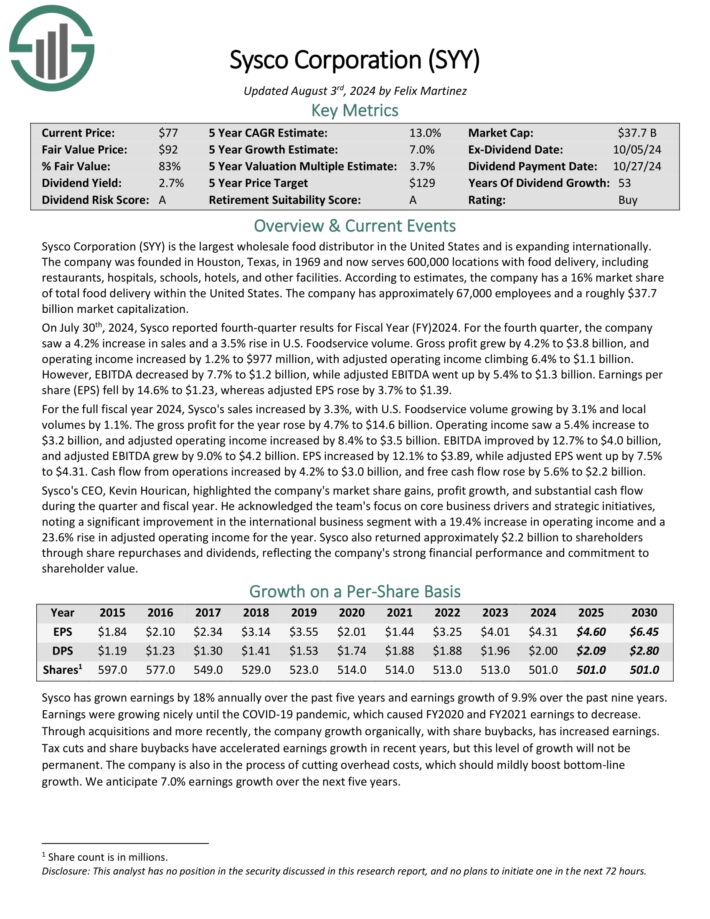
Sysco Corporation (SYY)
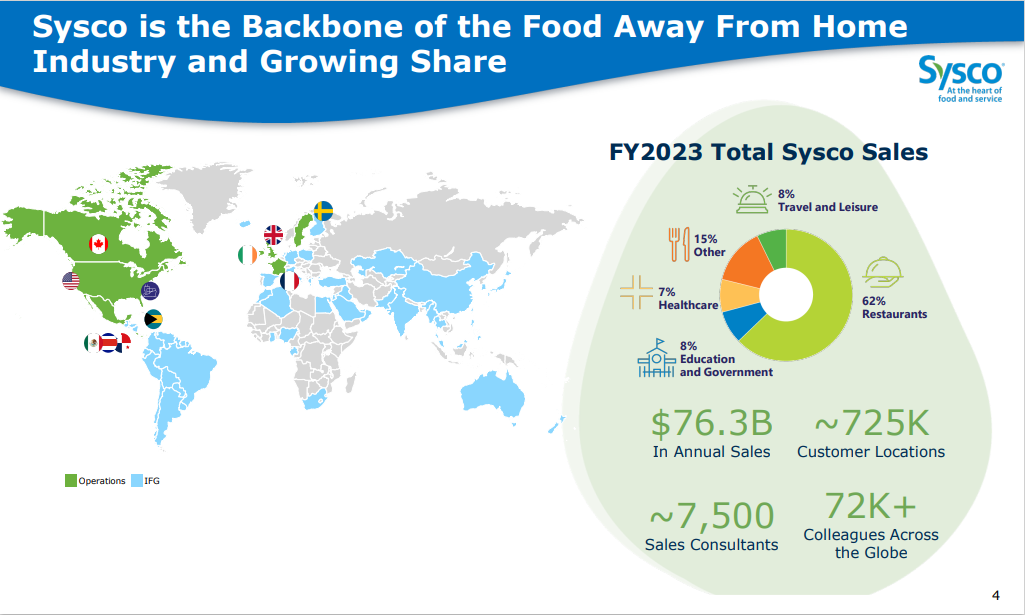
Sysco Corporation is the largest wholesale food distributor in the United States. The company serves 600,000 locations with food delivery, including restaurants, hospitals, schools, hotels, and other facilities.
Source: Investor Presentation
On July 30th, 2024, Sysco reported fourth-quarter results for Fiscal Year (FY) 2024. For the fourth quarter, the company saw a 4.2% increase in sales and a 3.5% rise in U.S. Foodservice volume.
Gross profit grew by 4.2% to $3.8 billion, and operating income increased by 1.2% to $977 million, with adjusted operating income climbing 6.4% to $1.1 billion.
However, EBITDA decreased by 7.7% to $1.2 billion, while adjusted EBITDA went up by 5.4% to $1.3 billion. Earnings per share (EPS) fell by 14.6% to $1.23, whereas adjusted EPS rose by 3.7% to $1.39.
Click here to download our most recent Sure Analysis report on SYY (preview of page 1 of 3 shown below):
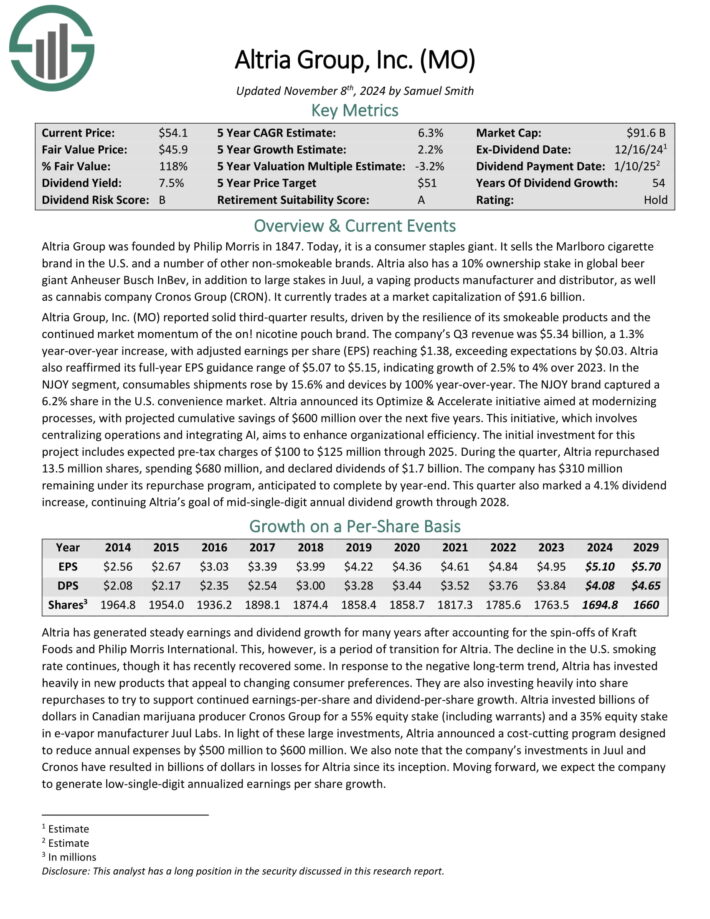
Altria Group (MO)
Altria Group was founded by Philip Morris in 1847 and today has grown into a consumer staples giant. While it is primarily known for its tobacco products, it is significantly involved in the beer business due to its 10% stake in global beer giant Anheuser-Busch InBev.
Altria reported solid third-quarter results, driven by the resilience of its smokeable products and the continued market momentum of the on! nicotine pouch brand. The company’s Q3 revenue was $5.34 billion, a 1.3% year-over-year increase, with adjusted earnings per share (EPS) reaching $1.38, exceeding expectations by $0.03.
Altria also reaffirmed its full-year EPS guidance range of $5.07 to $5.15, indicating growth of 2.5% to 4% over 2023.
During the quarter, Altria repurchased 13.5 million shares, spending $680 million, and declared dividends of $1.7 billion. The company has $310 million remaining under its repurchase program, anticipated to complete by year-end.
Click here to download our most recent Sure Analysis report on Altria (preview of page 1 of 3 shown below):
February, May, August, and November Payments
Pentair plc (PNR)
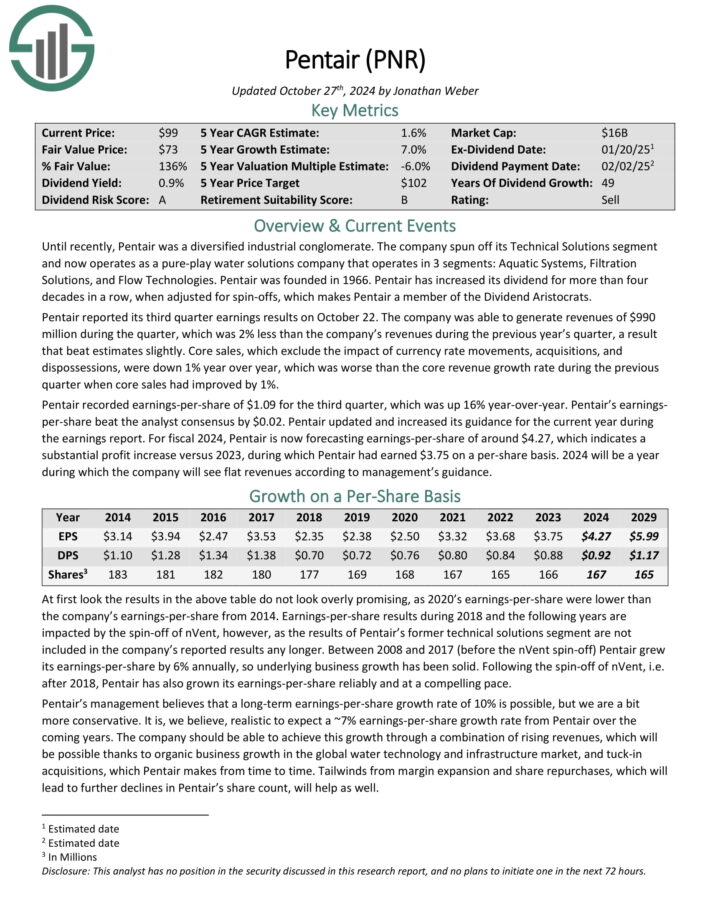
Pentair is a water solutions company that operates in 3 segments: Aquatic Systems, Filtration Solutions, and Flow Technologies. Pentair was founded in 1966.
Pentair has increased its dividend for more than four decades in a row, when adjusted for spin-offs. Pentair is one of the top water stocks.
Pentair reported its third quarter earnings results on October 22. The company was able to generate revenues of $990 million during the quarter, which was 2% less than the company’s revenues during the previous year’s quarter, a result that beat estimates slightly.
Core sales, which exclude the impact of currency rate movements, acquisitions, and dispossessions, were down 1% year over year, which was worse than the core revenue growth rate during the previous quarter when core sales had improved by 1%.
Pentair recorded earnings-per-share of $1.09 for the third quarter, which was up 16% year-over-year. Pentair’s earnings-per-share beat the analyst consensus by $0.02.
Click here to download our most recent Sure Analysis report on Pentair (preview of page 1 of 3 shown below):
Artesian Resources (ARTNA)
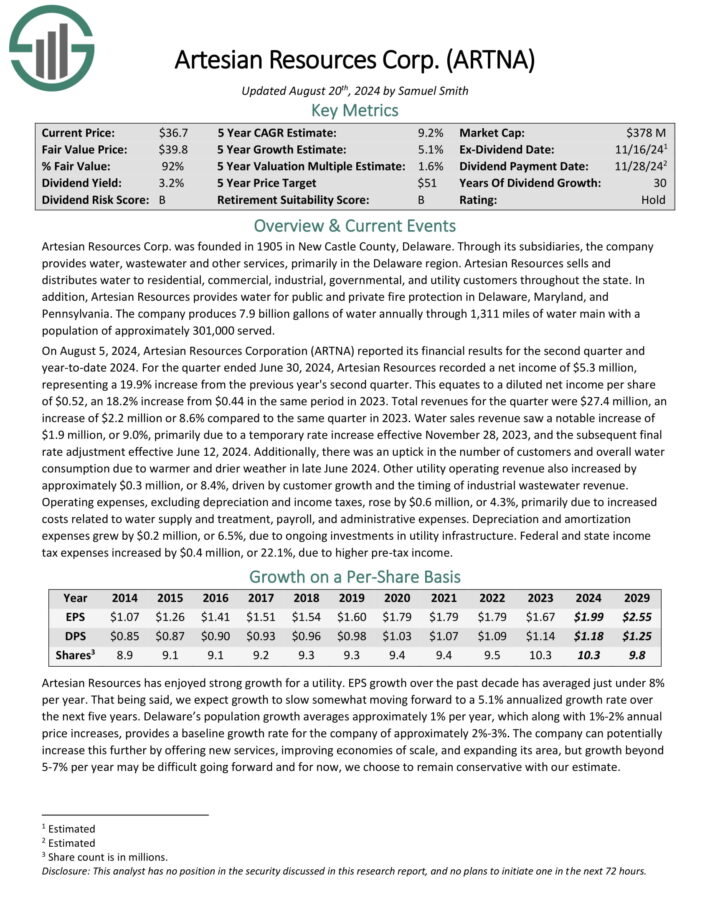
Artesian Resources Corp. was founded in 1905 in New Castle County, Delaware. Through its subsidiaries, the company provides water, wastewater and other services, primarily in the Delaware region.
Artesian Resources sells and distributes water to residential, commercial, industrial, governmental, and utility customers throughout the state.
In addition, Artesian Resources provides water for public and private fire protection in Delaware, Maryland, and Pennsylvania. The company produces 7.9 billion gallons of water annually through 1,311 miles of water main with a population of approximately 301,000 served.
On August 5, 2024, Artesian Resources Corporation (ARTNA) reported its financial results for the second quarter and year-to-date 2024. For the quarter ended June 30, 2024, Artesian Resources recorded a net income of $5.3 million, representing a 19.9% increase from the previous year’s second quarter.
This equates to a diluted net income per share of $0.52, an 18.2% increase from $0.44 in the same period in 2023. Total revenues for the quarter were $27.4 million, an increase of $2.2 million or 8.6% compared to the same quarter in 2023.
Click here to download our most recent Sure Analysis report on ARTNA (preview of page 1 of 3 shown below):
Westamerica Bancorp (WABC)
Westamerica Bancorporation is the holding company for Westamerica Bank. Westamerica Bancorporation is a regional community bank with 79 branches in Northern and Central California. The company can trace its origins back to 1884. Westamerica Bancorporation offers clients access to savings, checking and money market accounts.
The company’s loan portfolio consists of both commercial and residential real estate loans, as well as construction loans. Westamerica Bancorporation is the seventh largest bank headquartered in California. It has annual revenues of about $325 million.
On October 17th, 2024 Westamerica Bancorporation reported third quarter results for the period ending September 30th, 2024. For the quarter, revenue decreased 10.8% to $74.4 million, but this was $3.6 million more than expected. GAAP earnings-per-share of $1.31 compared unfavorably to $1.33 in the prior year, but this was $0.07 above estimates.
Total loans fell 8% to $831.4 million million as commercial loans were lower by 10.1% and consumer loans fell 22.1%. Commercial real estate loans, which make up more than half of the total loan portfolio, were unchanged. As of the end of the quarter, nonperforming loans decreased 25.8% to $919,000 year-over-year.
As with the second quarter, this period had no provisions for credit losses, compared to $400,000 in the third quarter of 2024. Net interest income was $62.5 million, which compares to $64.1 million for the second quarter of 2024 and $72.1 million in the third quarter of 2023.
Click here to download our most recent Sure Analysis report on WABC (preview of page 1 of 3 shown below):
Matthews International (MATW)
Matthews International Corporation provides brand solutions, memorialization products and industrial technologies on a global scale.
The company’s three business segments are diversified. The SGK Brand Solutions provides brand development services, printing equipment, creative design services, and embossing tools to the consumer-packaged goods and packaging industries.
The Memorialization segment sells memorialization products, caskets, and cremation equipment to funeral home industries.
The Industrial technologies segment is smaller than the other two businesses and designs, manufactures and distributes marking, coding and industrial automation technologies and solutions.
Matthews International reported third quarter results on August 1st, 2024. The company reported sales of $428 million, a 9.3% decline compared to the same prior year period.
The decrease was the result of a significant 30% sales decline in its Industrial Technologies segment.
Adjusted earnings were $0.56 per share, a 24% decrease from $0.74 a year ago. The company’s net debt leverage ratio rose sequentially from 3.6 to 3.8.
Click here to download our most recent Sure Analysis report on MATW (preview of page 1 of 3 shown below):
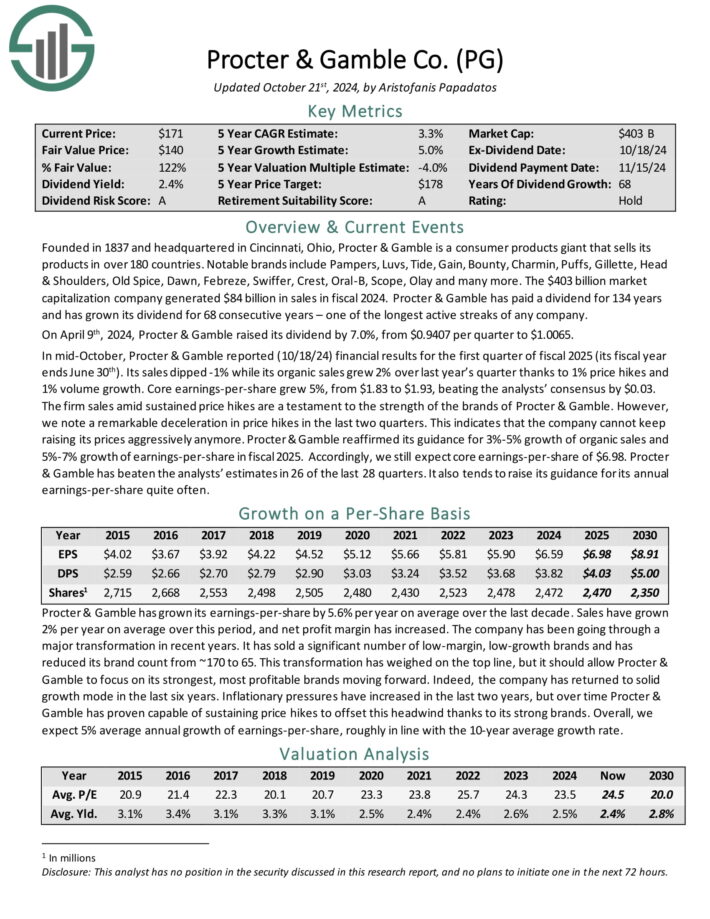
Procter & Gamble Co. (PG)
Procter & Gamble is a consumer staple giant in its own right. The company has been in business since the 1830s and has built a stable of well-known brands, including Pampers, Charmin, Gillette, Old Spice, Oral-B, and Head & Shoulders.
Over the past few years, the company has been on an extensive thinning of its product lines, going from nearly 170 brands to just 65 core names.
In mid-October, Procter & Gamble reported (10/18/24) financial results for the first quarter of fiscal 2025 (its fiscal year ends June 30th). Its sales dipped -1% while its organic sales grew 2% over last year’s quarter thanks to 1% price hikes and 1% volume growth. Core earnings-per-share grew 5%, from $1.83 to $1.93, beating the analysts’ consensus by $0.03.
The firm sales amid sustained price hikes are a testament to the strength of the brands of Procter & Gamble. However, we note a remarkable deceleration in price hikes in the last two quarters.
This indicates that the company cannot keep raising its prices aggressively anymore. Procter & Gamble reaffirmed its guidance for 3%-5% growth of organic sales and 5%-7% growth of earnings-per-share in fiscal 2025.
Click here to download our most recent Sure Analysis report on Procter & Gamble Co. (PG) (preview of page 1 of 3 shown below):
March, June, September, and December Payments
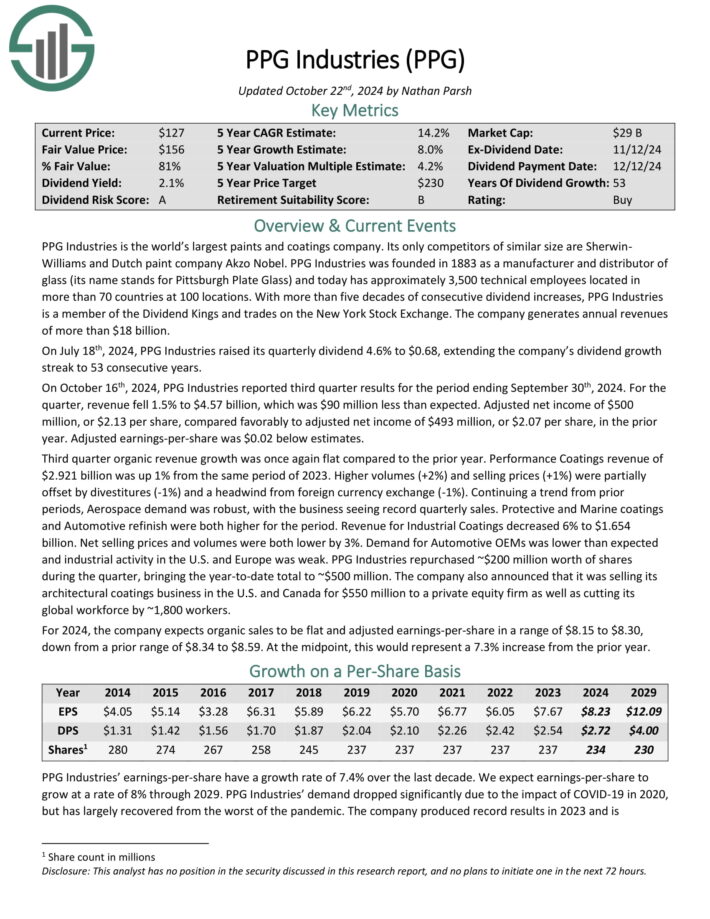
PPG Industries (PPG)
PPG Industries is the world’s largest paints and coatings company. Its only competitors of similar size are Sherwin-Williams and Dutch paint company Akzo Nobel.
On October 16th, 2024, PPG Industries reported third quarter results for the period ending September 30th, 2024. For the quarter, revenue fell 1.5% to $4.57 billion, which was $90 million less than expected.
The company generates annual revenue of about $18.2 billion.
Source: Investor Presentation
Adjusted net income of $500 million, or $2.13 per share, compared favorably to adjusted net income of $493 million, or $2.07 per share, in the prior year. Adjusted earnings-per-share was $0.02 below estimates.
Third quarter organic revenue growth was once again flat compared to the prior year. Performance Coatings revenue of $2.921 billion was up 1% from the same period of 2023.
Higher volumes (+2%) and selling prices (+1%) were partially offset by divestitures (-1%) and a headwind from foreign currency exchange (-1%).
Click here to download our most recent Sure Analysis report on PPG (preview of page 1 of 3 shown below):
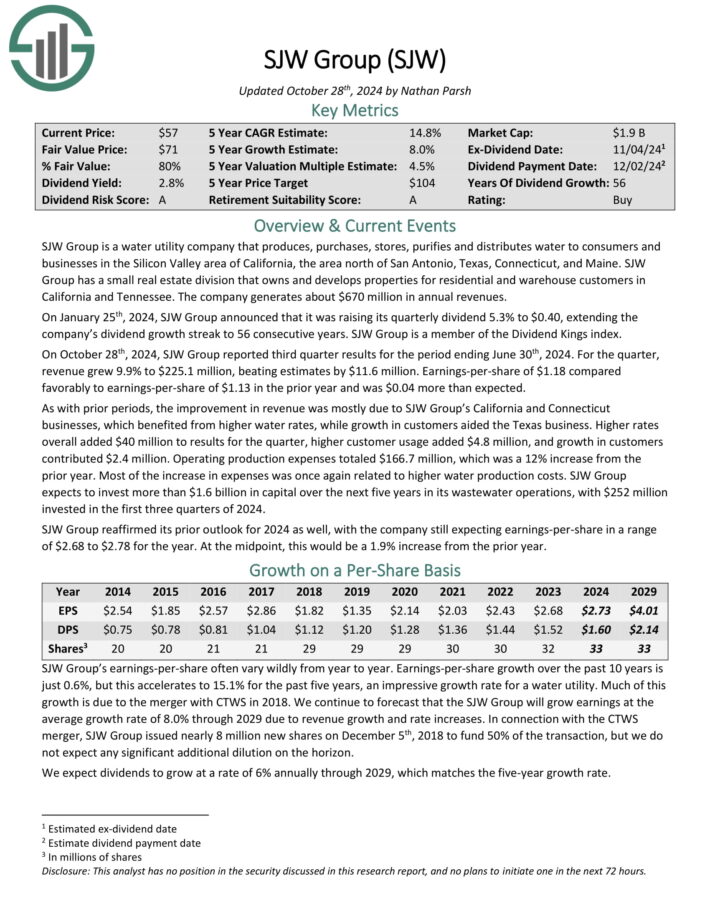
SJW Group (SJW)
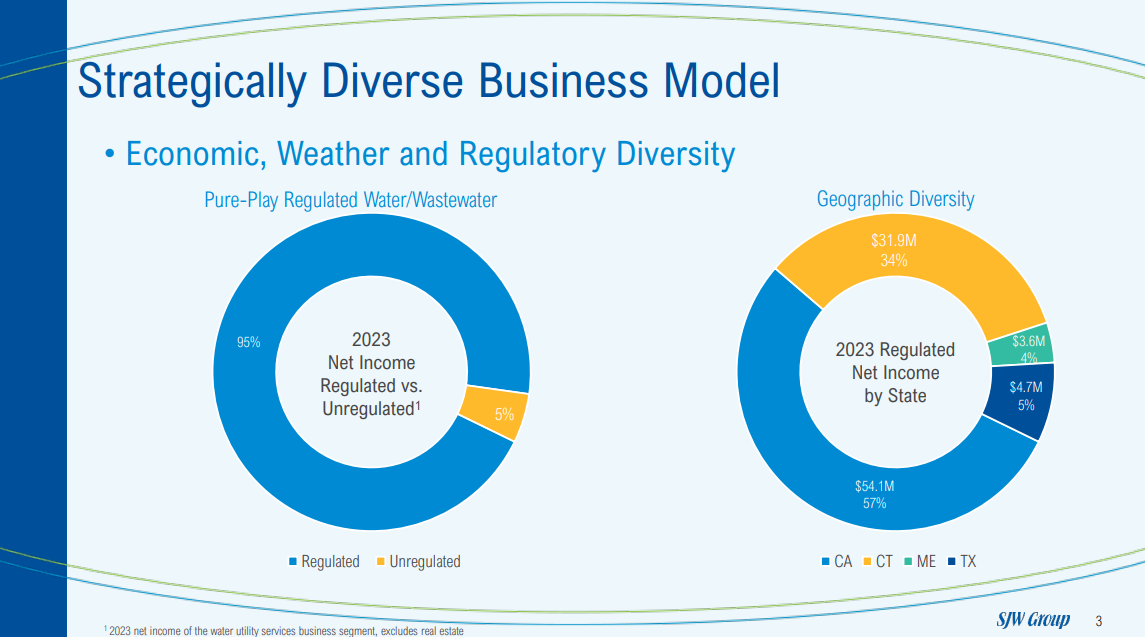
SJW Group is a water utility company that produces, purchases, stores, purifies and distributes water to consumers and businesses in the Silicon Valley area of California, the area north of San Antonio, Texas, Connecticut, and Maine.
SJW Group has a small real estate division that owns and develops properties for residential and warehouse customers in California and Tennessee. The company generates about $670 million in annual revenues.
Source: Investor Presentation
On October 28th, 2024, SJW Group reported third quarter results for the period ending June 30th, 2024. For the quarter, revenue grew 9.9% to $225.1 million, beating estimates by $11.6 million. Earnings-per-share of $1.18 compared favorably to earnings-per-share of $1.13 in the prior year and was $0.04 more than expected.
As with prior periods, the improvement in revenue was mostly due to SJW Group’s California and Connecticut businesses, which benefited from higher water rates, while growth in customers aided the Texas business.
Higher rates overall added $40 million to results for the quarter, higher customer usage added $4.8 million, and growth in customers contributed $2.4 million. Operating production expenses totaled $166.7 million, which was a 12% increase from the prior year.
Click here to download our most recent Sure Analysis report on SJW (preview of page 1 of 3 shown below):
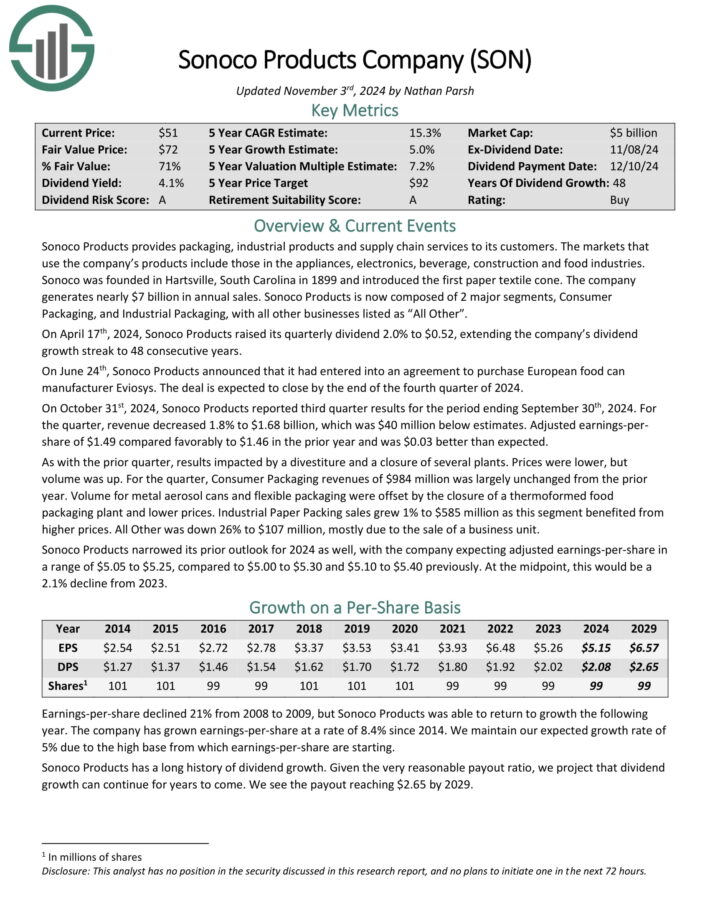
Sonoco Products Company (SON)
Sonoco Products provides packaging, industrial products and supply chain services to its customers. The markets that use the company’s products include those in the appliances, electronics, beverage, construction and food industries.
The company generates nearly $7 billion in annual sales. Sonoco Products is now composed of 2 major segments, Consumer Packaging, and Industrial Packaging, with all other businesses listed as “All Other”.
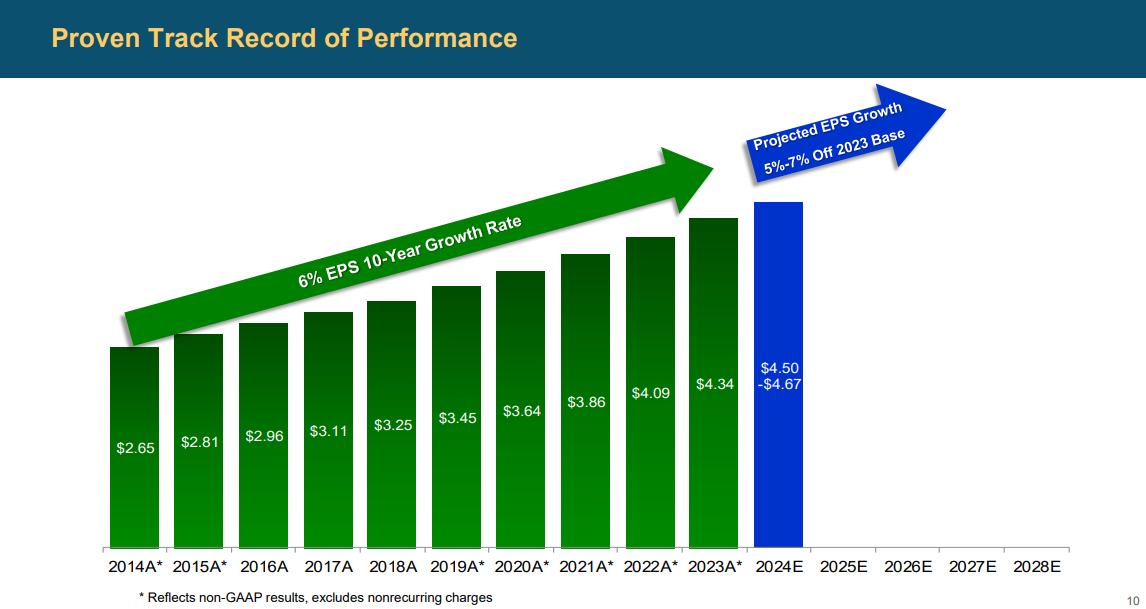
Source: Investor Presentation
On October 31st, 2024, Sonoco Products reported third quarter results for the period ending September 30th, 2024. For the quarter, revenue decreased 1.8% to $1.68 billion, which was $40 million below estimates.
Adjusted earnings-per share of $1.49 compared favorably to $1.46 in the prior year and was $0.03 better than expected.
As with the prior quarter, results impacted by a divestiture and a closure of several plants. Prices were lower, but volume was up.
For the quarter, Consumer Packaging revenues of $984 million was largely unchanged from the prior year.
Click here to download our most recent Sure Analysis report on Sonoco (SON) (preview of page 1 of 3 shown below):
Eversource Energy (ES)
Eversource Energy is a diversified holding company with subsidiaries that provide regulated electric, gas, and water distribution service in the Northeast U.S.
The company’s utilities serve more than 4 million customers after acquiring NStar’s Massachusetts utilities in 2012, Aquarion in 2017, and Columbia Gas in 2020.
Eversource has delivered steady growth to shareholders for many years.
Source: Investor Presentation
On November 4th, 2024, Eversource Energy released its third-quarter 2024 results for the period ending September 30th, 2024.
For the quarter, the company reported a net loss of $(118.1) million, a sharp decline from earnings of $339.7 million in the same quarter of last year, which reflects the impact of the company’s exit from offshore wind investments.
The company reported a loss per share of $(0.33), compared with earnings-per-share of $0.97 in the prior year. Earnings from the Electric Transmission segment increased to $174.9 million, up from $160.3 million in the prior year, primarily due to a higher level of investment in Eversource’s electric transmission system.
Click here to download our most recent Sure Analysis report on ES (preview of page 1 of 3 shown below):
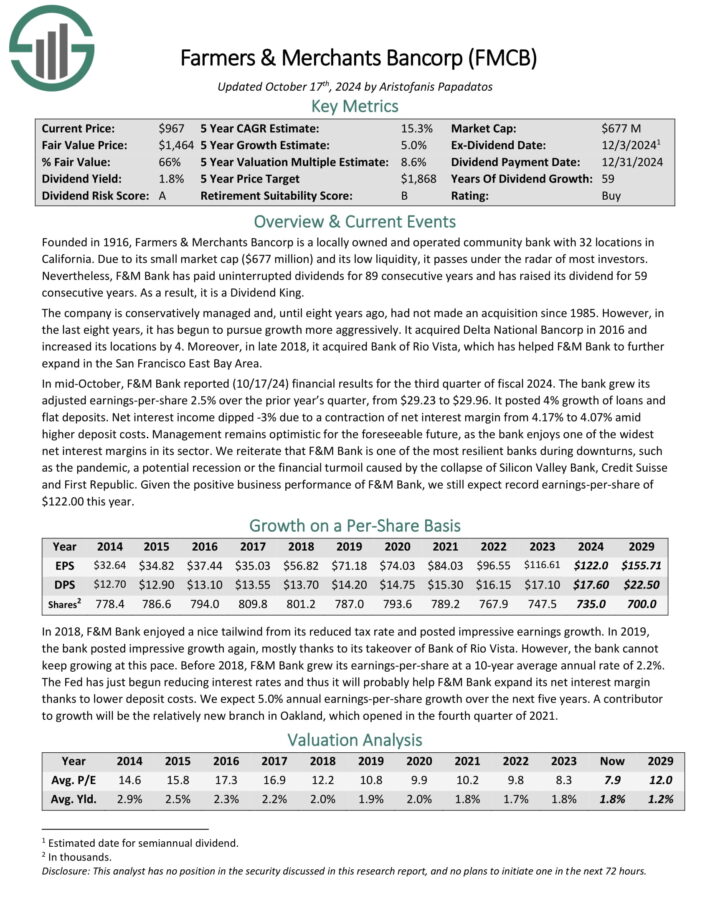
Farmers & Merchants Bancorp (FMCB)
Farmers & Merchants Bancorp is a locally owned and operated community bank with 32 locations in California. Due to its small market cap and its low liquidity, it passes under the radar of most investors.
F&M Bank has paid uninterrupted dividends for 88 consecutive years and has raised its dividend for 59 consecutive years.
In mid-October, F&M Bank reported (10/17/24) financial results for the third quarter of fiscal 2024. The bank grew its adjusted earnings-per-share 2.5% over the prior year’s quarter, from $29.23 to $29.96.
It posted 4% growth of loans and flat deposits. Net interest income dipped -3% due to a contraction of net interest margin from 4.17% to 4.07% amid higher deposit costs.
F&M Bank is a prudently managed bank, which has always targeted a conservative capital ratio. The bank currently has a total capital ratio of 14.95%, which results in the highest regulatory classification of “well capitalized.”
Moreover, its credit quality remains exceptionally strong, as there are extremely few non-performing loans and leases in its portfolio.
Click here to download our most recent Sure Analysis report on FMCB (preview of page 1 of 3 shown below):
Final Thoughts
Investors seeking consistent monthly cash flows can construct a portfolio of high-quality names with long histories of raising dividends.
The stocks created to create this diversified model portfolio yield twice as much as the S&P 500 Index. These names also have at least 25 years of consecutive dividend increases.
Investors can scale this portfolio to meet their needs, and future income will surely increase due to the regular dividend increases that most, if not all, of these companies will provide.
This can provide the investor in retirement with stable cash flows that can be used to meet their needs.
If you are interested in finding more high-quality dividend growth stocks suitable for long-term investment, the following Sure Dividend databases will be useful:
- The 20 Highest Yielding Dividend Aristocrats
- The Dividend Kings List is even more exclusive than the Dividend Aristocrats. It is comprised of 53 stocks with 50+ years of consecutive dividend increases.
- The 20 Highest Yielding Dividend Kings
- The Dividend Achievers List: a group of stocks with 10+ years of consecutive dividend increases.
- The Dividend Champions List: stocks that have increased their dividends for 25+ consecutive years.
Note: Not all Dividend Champions are Dividend Aristocrats because Dividend Aristocrats have additional requirements like being in The S&P 500. - The Dividend Contenders List: 10-24 consecutive years of dividend increases.
- The Dividend Challengers List: 5-9 consecutive years of dividend increases.
- The Monthly Dividend Stocks List: contains stocks that pay dividends each month, for 12 payments per year.
- The 20 Highest Yielding Monthly Dividend Stocks
The major domestic stock market indices are another solid resource for finding investment ideas. Sure Dividend compiles the following stock market databases and updates them regularly:

