Article updated on May 1st, 2024 by Bob Ciura
Spreadsheet data updated daily
The Dividend Aristocrats are a select group of 68 S&P 500 stocks with 25+ years of consecutive dividend increases.
They are the ‘best of the best’ dividend growth stocks. The Dividend Aristocrats have a long history of outperforming the market.
The requirements to be a Dividend Aristocrat are:
- Be in the S&P 500
- Have 25+ consecutive years of dividend increases
- Meet certain minimum size & liquidity requirements
There are currently 68 Dividend Aristocrats. You can download an Excel spreadsheet of all 68 (with metrics that matter such as dividend yields and price-to-earnings ratios) by clicking the link below:
Disclaimer: Sure Dividend is not affiliated with S&P Global in any way. S&P Global owns and maintains The Dividend Aristocrats Index. The information in this article and downloadable spreadsheet is based on Sure Dividend’s own review, summary, and analysis of the S&P 500 Dividend Aristocrats ETF (NOBL) and other sources, and is meant to help individual investors better understand this ETF and the index upon which it is based. None of the information in this article or spreadsheet is official data from S&P Global. Consult S&P Global for official information.
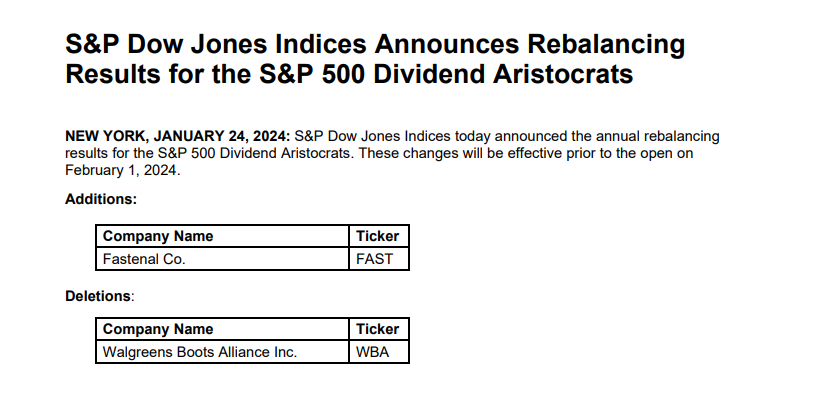
Note 1: On January 24th, 2024, Fastenal (FAST) was added to the list while Walgreens Boots Alliance (WBA), leaving 68 Dividend Aristocrats.
Source: S&P News Releases.
You can see detailed analysis on all 68 further below in this article, in our Dividend Aristocrats In Focus Series. Analysis includes valuation, growth, and competitive advantage(s).
Table of Contents
- How To Use The Dividend Aristocrats List To Find Dividend Investment Ideas
- Performance of the Dividend Aristocrats
- Sector Overview
- The 10 Best Dividend Aristocrats Now
- Dividend Aristocrats Analysis (The Dividend Aristocrats In Focus Series)
- Historical Dividend Aristocrats List (1989 – 2024)
- Frequently Asked Questions
- Final Thoughts
How to Use The Dividend Aristocrats List To Find Dividend Investment Ideas
The downloadable Dividend Aristocrats Excel Spreadsheet List above contains the following for each stock in the index:
- Price-to-earnings ratio
- Dividend yield
- Market capitalization
All Dividend Aristocrats are high-quality businesses based on their long dividend histories. A company cannot pay rising dividends for 25+ years without having a strong and durable competitive advantage.
But not all Dividend Aristocrats make equally good investments today. That’s where the spreadsheet in this article comes into play. You can use the Dividend Aristocrats spreadsheet to quickly find quality dividend investment ideas.
The list of all 68 Dividend Aristocrats is valuable because it gives you a concise list of all S&P 500 stocks with 25+ consecutive years of dividend increases (that also meet certain minimum size and liquidity requirements).
These are businesses that have both the desire and ability to pay shareholders rising dividends year-after-year. This is a rare combination.
Together, these two criteria are powerful – but they are not enough. Value must be considered as well.
The spreadsheet above allows you to sort by trailing price-to-earnings ratio so you can quickly find undervalued, high-quality dividend stocks.
Here’s how to use the Dividend Aristocrats list to quickly find high-quality dividend growth stocks potentially trading at a discount:
- Download the list
- Sort by ‘Trailing PE Ratio,’ smallest to largest
- Research the top stocks further
Here’s how to do this quickly in the spreadsheet:
Step 1: Download the list, and open it.
Step 2: Apply a filter function to each column in the spreadsheet.
Step 3: Click on the small gray down arrow next to ‘Trailing P/E Ratio’, and then sort smallest to largest.
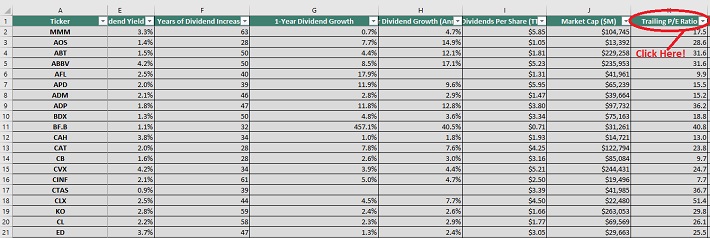
Step 4: Review the highest ranked Dividend Aristocrats before investing. You can see detailed analysis on every Dividend Aristocrat found below in this article.
That’s it; you can follow the same procedure to sort by any other metric in the spreadsheet.
Performance Of The Dividend Aristocrats
In April 2024, the Dividend Aristocrats, as measured by the Dividend Aristocrats ETF (NOBL), registered a negative return of -4.0%. It under-performed the SPDR S&P 500 ETF (SPY) for the month.
- NOBL generated returns of -4.0% in April 2024
- SPY generated returns of -3.9% in April 2024
Short-term performance is mostly noise. Performance should be measured over a minimum of 3 years, and preferably longer periods of time.
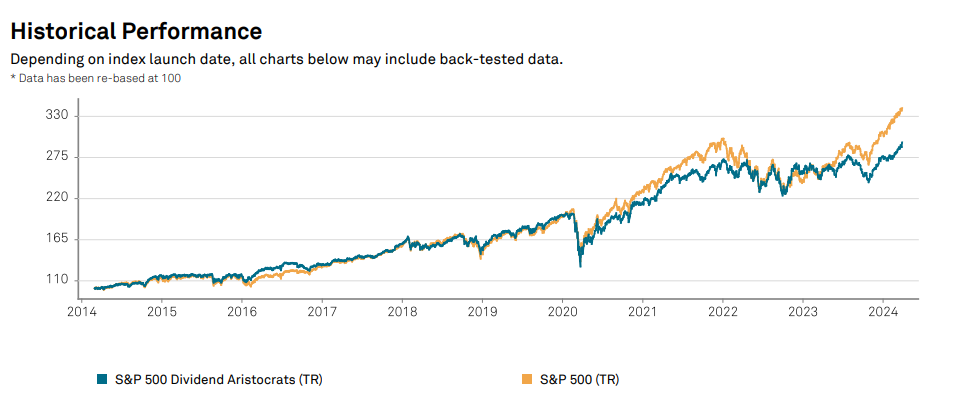
The Dividend Aristocrats Index has slightly under-performed the broader market index over the last decade, with a 10.24% total annual return for the Dividend Aristocrats and a 12.31% total annual return for the S&P 500 Index.
But the Dividend Aristocrats have exhibited lower risk than the benchmark, as measured by standard deviation.
Source: S&P Fact Sheet
Higher total returns with lower volatility is the ‘holy grail’ of investing. It is worth exploring the characteristics of the Dividend Aristocrats in detail to determine why they have performed so well.
Note that a good portion of the outperformance relative to the S&P 500 comes during recessions (2000 – 2002, 2008). Dividend Aristocrats have historically seen smaller drawdowns during recessions versus the S&P 500. This makes holding through recessions that much easier. Case-in-point: In 2008 the Dividend Aristocrats Index declined 22%. That same year, the S&P 500 declined 38%.
Great businesses with strong competitive advantages tend to be able to generate stronger cash flows during recessions. This allows them to gain market share while weaker businesses fight to stay alive.
The Dividend Aristocrats Index has beaten the market over the last 28 years…
We believe dividend paying stocks outperform non-dividend paying stocks for three reasons:
- A company that pays dividends is likely to be generating earnings or cash flows so that it can pay dividends to shareholders. This excludes ‘pre-earnings’ start-ups and failing businesses. In short, it excludes the riskiest stocks.
- A business that pays consistent dividends must be more selective with the growth projects it takes on because a portion of its cash flows are being paid out as dividends. Scrutinizing over capital allocation decisions likely adds to shareholder value.
- Stocks that pay dividends are willing to reward shareholders with cash payments. This is a sign that management is shareholder friendly.
In our view, Dividend Aristocrats have historically outperformed the market and other dividend paying stocks because they are, on average, higher-quality businesses.
A high-quality business should outperform a mediocre business over a long period of time, all other things being equal.
For a business to increase its dividends for 25+ consecutive years, it must have or at least had in the very recent past a strong competitive advantage.
Sector Overview
A sector breakdown of the Dividend Aristocrats Index is shown below:
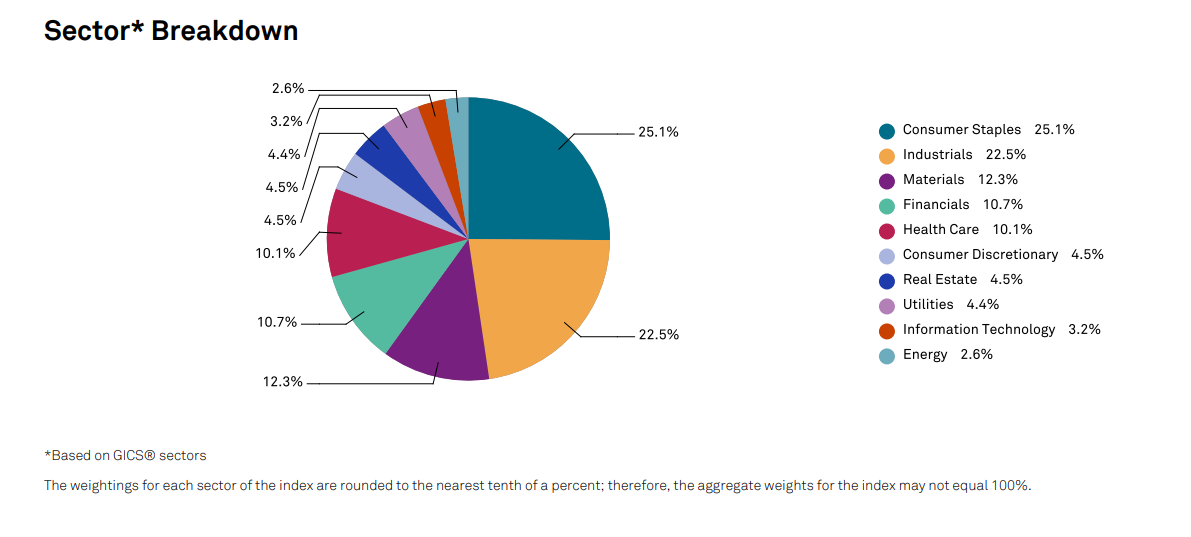
The top 2 sectors by weight in the Dividend Aristocrats are Industrials and Consumer Staples. The Dividend Aristocrats Index is tilted toward Consumer Staples and Industrials relative to the S&P 500.
These 2 sectors make up over 40% of the Dividend Aristocrats Index, but less than 20% of the S&P 500.
The Dividend Aristocrats Index is also significantly underweight the Information Technology sector, with a ~3% allocation compared with over 20% allocation within the S&P 500.
The Dividend Aristocrat Index is filled with stable ‘old economy’ blue chip consumer products businesses and manufacturers; the 3M’s (MMM), Coca-Cola’s (KO), and Johnson & Johnson’s (JNJ) of the investing world.
These ‘boring’ businesses aren’t likely to generate 20%+ earnings-per-share growth, but they also are very unlikely to see large earnings drawdowns as well.
The 10 Best Dividend Aristocrats Now
This research report examines the 10 best Dividend Aristocrats from our Sure Analysis Research Database with the highest 5-year forward expected total returns.
Dividend Aristocrat #10: Brown & Brown (BRO)
- 5-year Expected Annual Returns: 10.7%
Brown & Brown Inc. is a leading insurance brokerage firm that provides risk management solutions to both individuals and businesses, with a focus on property & casualty insurance. Brown & Brown has a notably high level of insider ownership.
Brown & Brown released first quarter earnings on April 22nd, 2024, and results were better than expected on both the top and bottom lines. The company saw $1.14 in adjusted earnings per-share, which was seven cents ahead of expectations. Revenue was up 12.7% year-over-year to $1.26 billion, which was $40 million ahead of estimates.
Commissions and fees were up 11.6% year-over-year, and organic revenue was up 8.6%, which excludes acquisitions and divestitures. Income before taxes came to $364 million, which was almost 24% higher than the year-ago period.
Click here to download our most recent Sure Analysis report on BRO (preview of page 1 of 3 shown below):

Dividend Aristocrat #9: Lowe’s Companies (LOW)
- 5-year Expected Annual Returns: 11.0%
Lowe’s Companies is the second-largest home improvement retailer in the US (after Home Depot). The company was founded in 1946 and is headquartered in Mooresville, NC. Lowe’s operates or services more than 1,700 home improvement and hardware stores in the U.S.
Lowe’s reported fourth quarter 2023 results on February 27th, 2024. Total sales came in at $18.6 billion compared to $22.4 billion in the same quarter a year ago. Comparable sales decreased by 6.2%, while net earnings-per-share of $1.77 compared to $1.58 in fourth quarter 2022.
However, adjusted EPS in the year-ago period was $2.28 when excluding the transaction costs related to the sale of the Canadian retail business in the prior year. The company continues to be negatively impacted from a reduction in DIY discretionary spending.
Click here to download our most recent Sure Analysis report on LOW (preview of page 1 of 3 shown below):

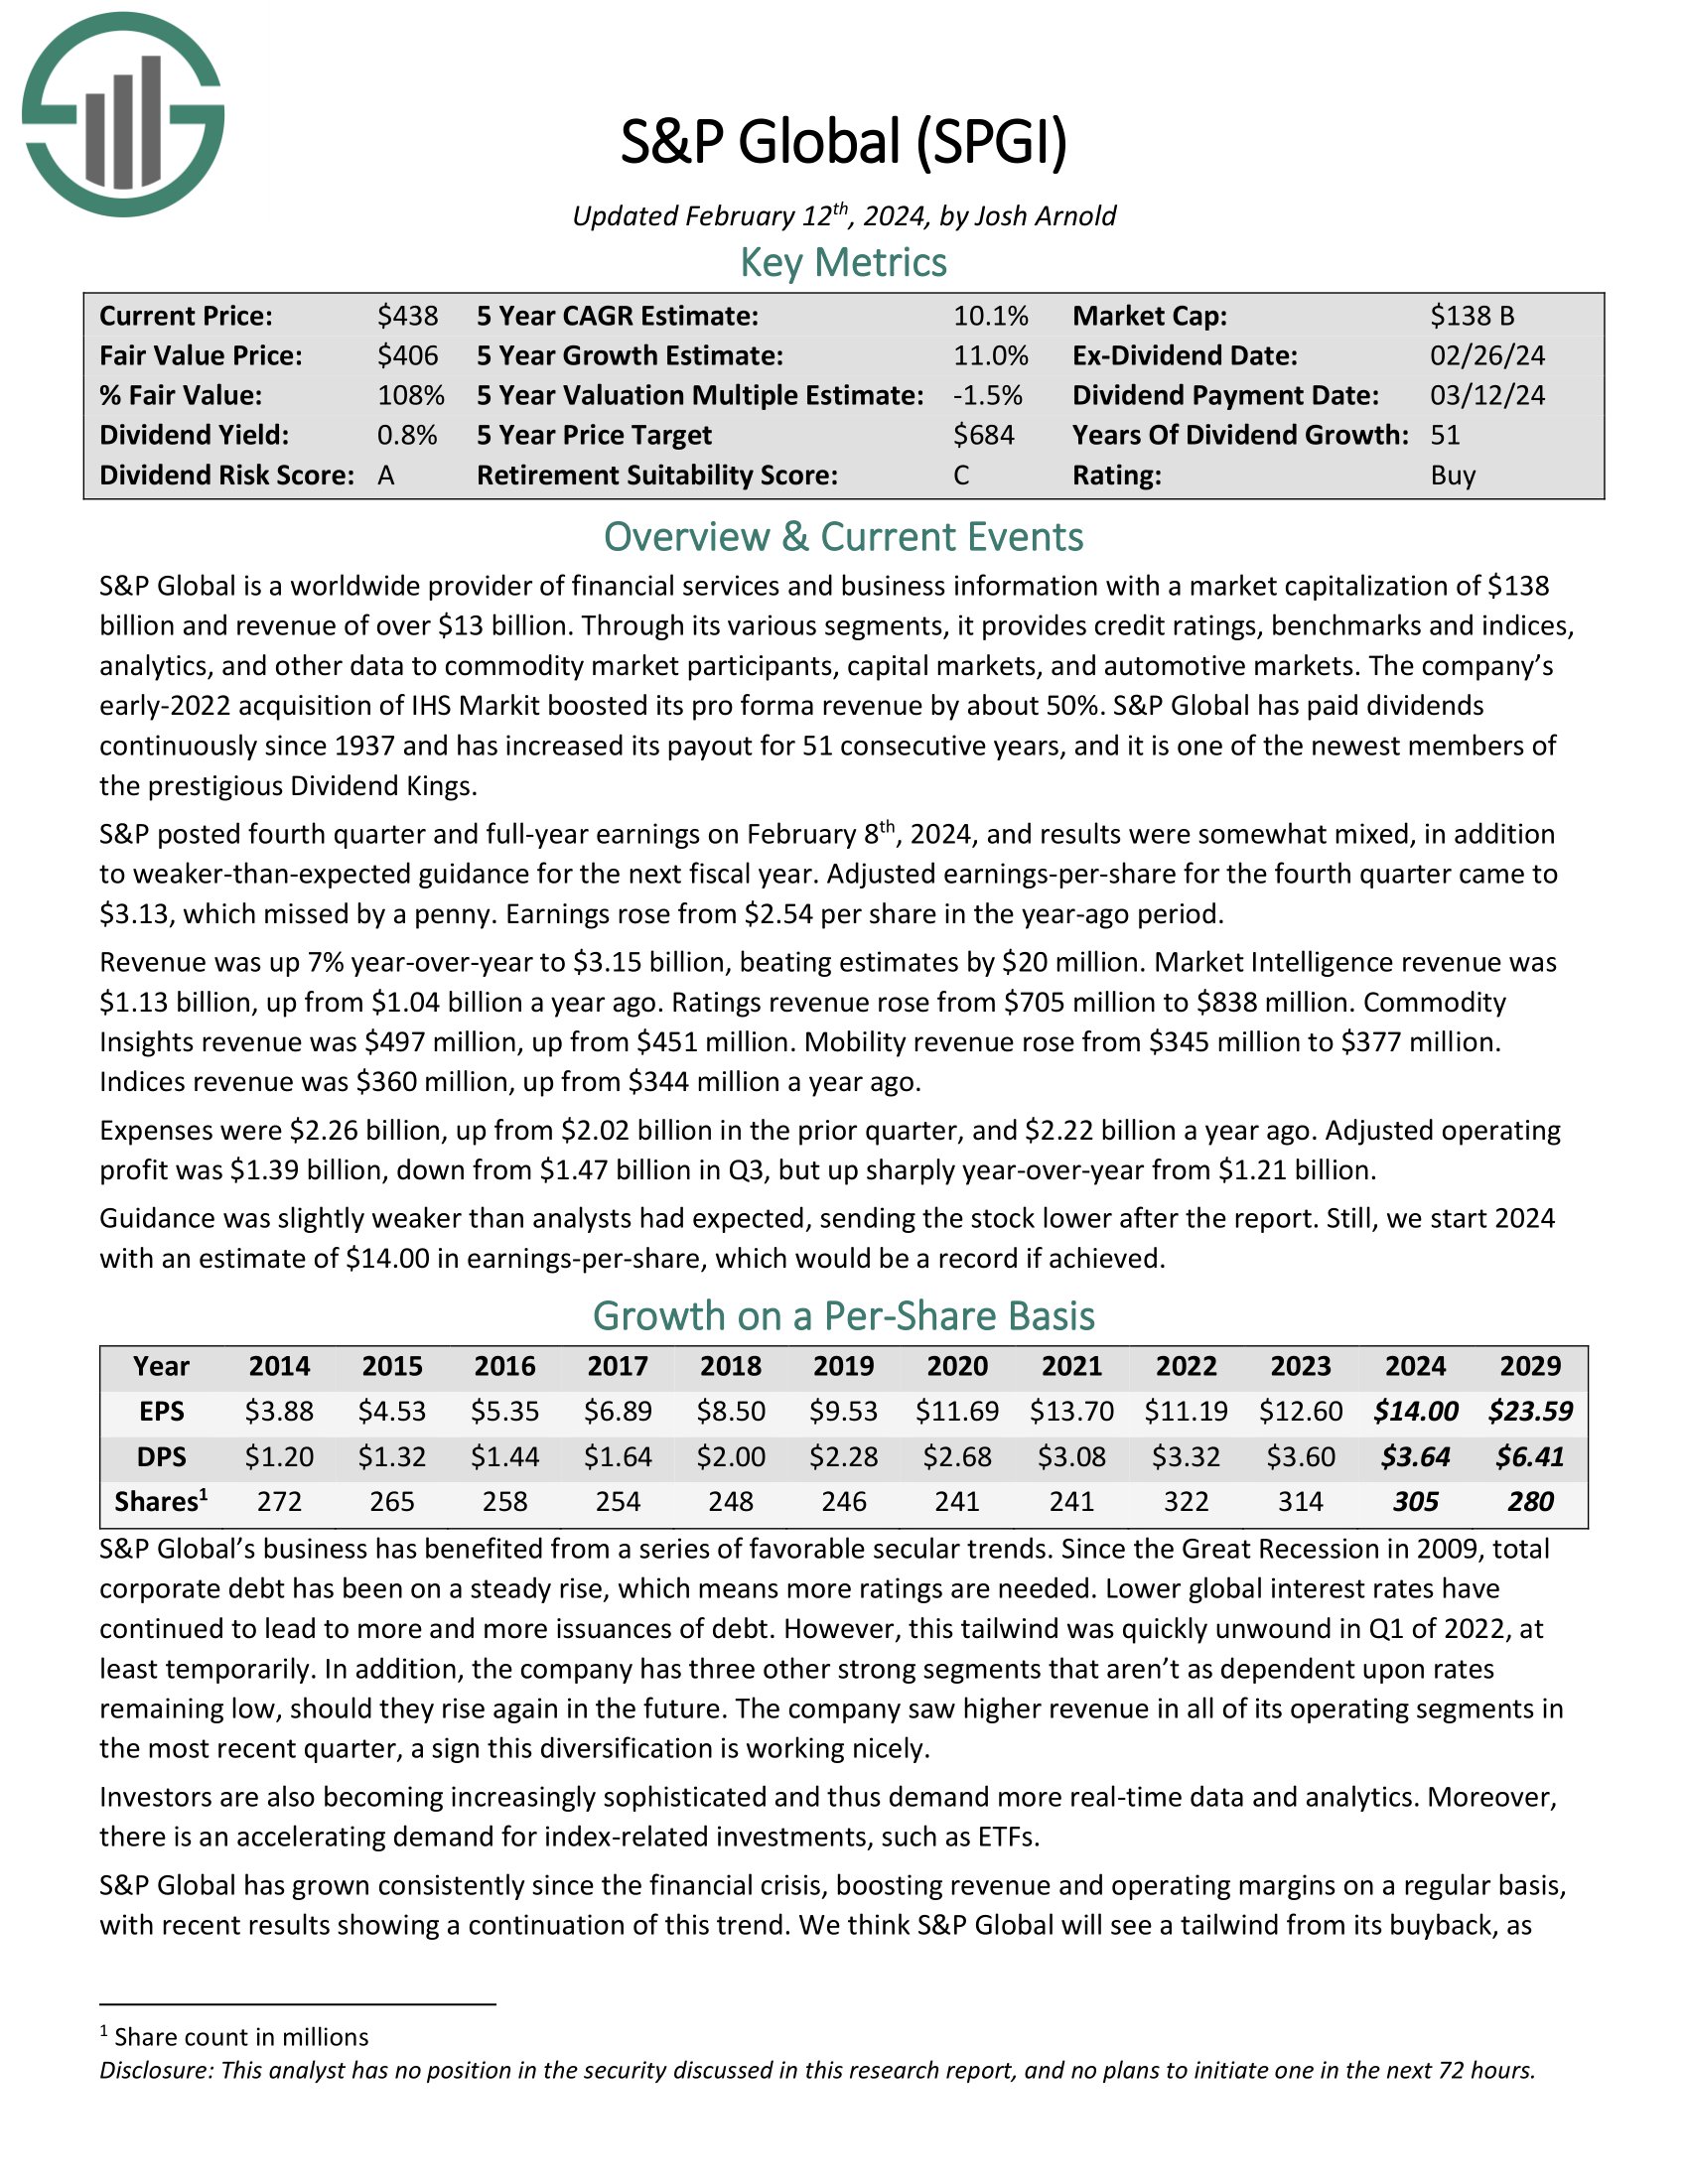
Dividend Aristocrat #8: S&P Global (SPGI)
- 5-year Expected Annual Returns: 11.3%
S&P Global is a worldwide provider of financial services and business information. The company has generated strong growth over the past several years. It has increased its dividend for 50 consecutive years. It operates in the highly concentrated financial ratings industry where the three well-known rating agencies control over 90% of global financial debt ratings.
S&P posted fourth quarter and full-year earnings on February 8th, 2024, and results were somewhat mixed. Adjusted earnings-per-share for the fourth quarter came to $3.13, which missed by a penny. Earnings rose from $2.54 per share in the year-ago period. Revenue was up 7% year-over-year to $3.15 billion, beating estimates by $20 million.
Market Intelligence revenue was $1.13 billion, up from $1.04 billion a year ago. Ratings revenue rose from $705 million to $838 million. Commodity Insights revenue was $497 million, up from $451 million. Mobility revenue rose from $345 million to $377 million. Indices revenue was $360 million, up from $344 million a year ago.
Click here to download our most recent Sure Analysis report on SPGI (preview of page 1 of 3 shown below):
Dividend Aristocrat #7: Target Corporation (TGT)
- 5-year Expected Annual Returns: 11.8%
Target was founded in 1902 and now operates about 1,850 big box stores, which offer general merchandise and food, as well as serving as distribution points for the company’s e-commerce business.
Target posted fourth quarter and full-year earnings on March 5th, 2024, and results were quite strong. Adjusted earnings-per-share came to $2.98, which was a staggering 56 cents ahead of estimates. Total revenue was $31.9 billion, which was 1.7% higher year-over-year, driven mostly by an additional week in fiscal 2023 compared to 2022. Revenue estimates, however, did miss estimates by $400 million.
Comparable sales were down 4.4%, which was 20 basis points better than consensus. Same-day services were more than 10% of total sales, and were up 13.6%, which was led by the company’s very popular Drive Up program.
Click here to download our most recent Sure Analysis report on TGT (preview of page 1 of 3 shown below):

Dividend Aristocrat #6: Medtronic plc (MDT)
- 5-year Expected Annual Returns: 11.9%
Medtronic is the largest manufacturer of biomedical devices and implantable technologies in the world. It serves physicians, hospitals, and patients in more than 150 countries and has over 90,000 employees.
Medtronic has four operating segments: Cardiovascular, Medical Surgical, Neuroscience and Diabetes. Medtronic has raised its dividend for 46 consecutive years.
In mid-February, Medtronic reported (2/20/24) financial results for the third quarter of fiscal year 2024. Organic revenue grew 5% over the prior year’s quarter thanks to broad-based growth in all the four segments. Earnings-per-share remained flat at $1.30 due to an -8% currency headwind but exceeded the analysts’ consensus by $0.04.
Click here to download our most recent Sure Analysis report on MDT (preview of page 1 of 3 shown below):

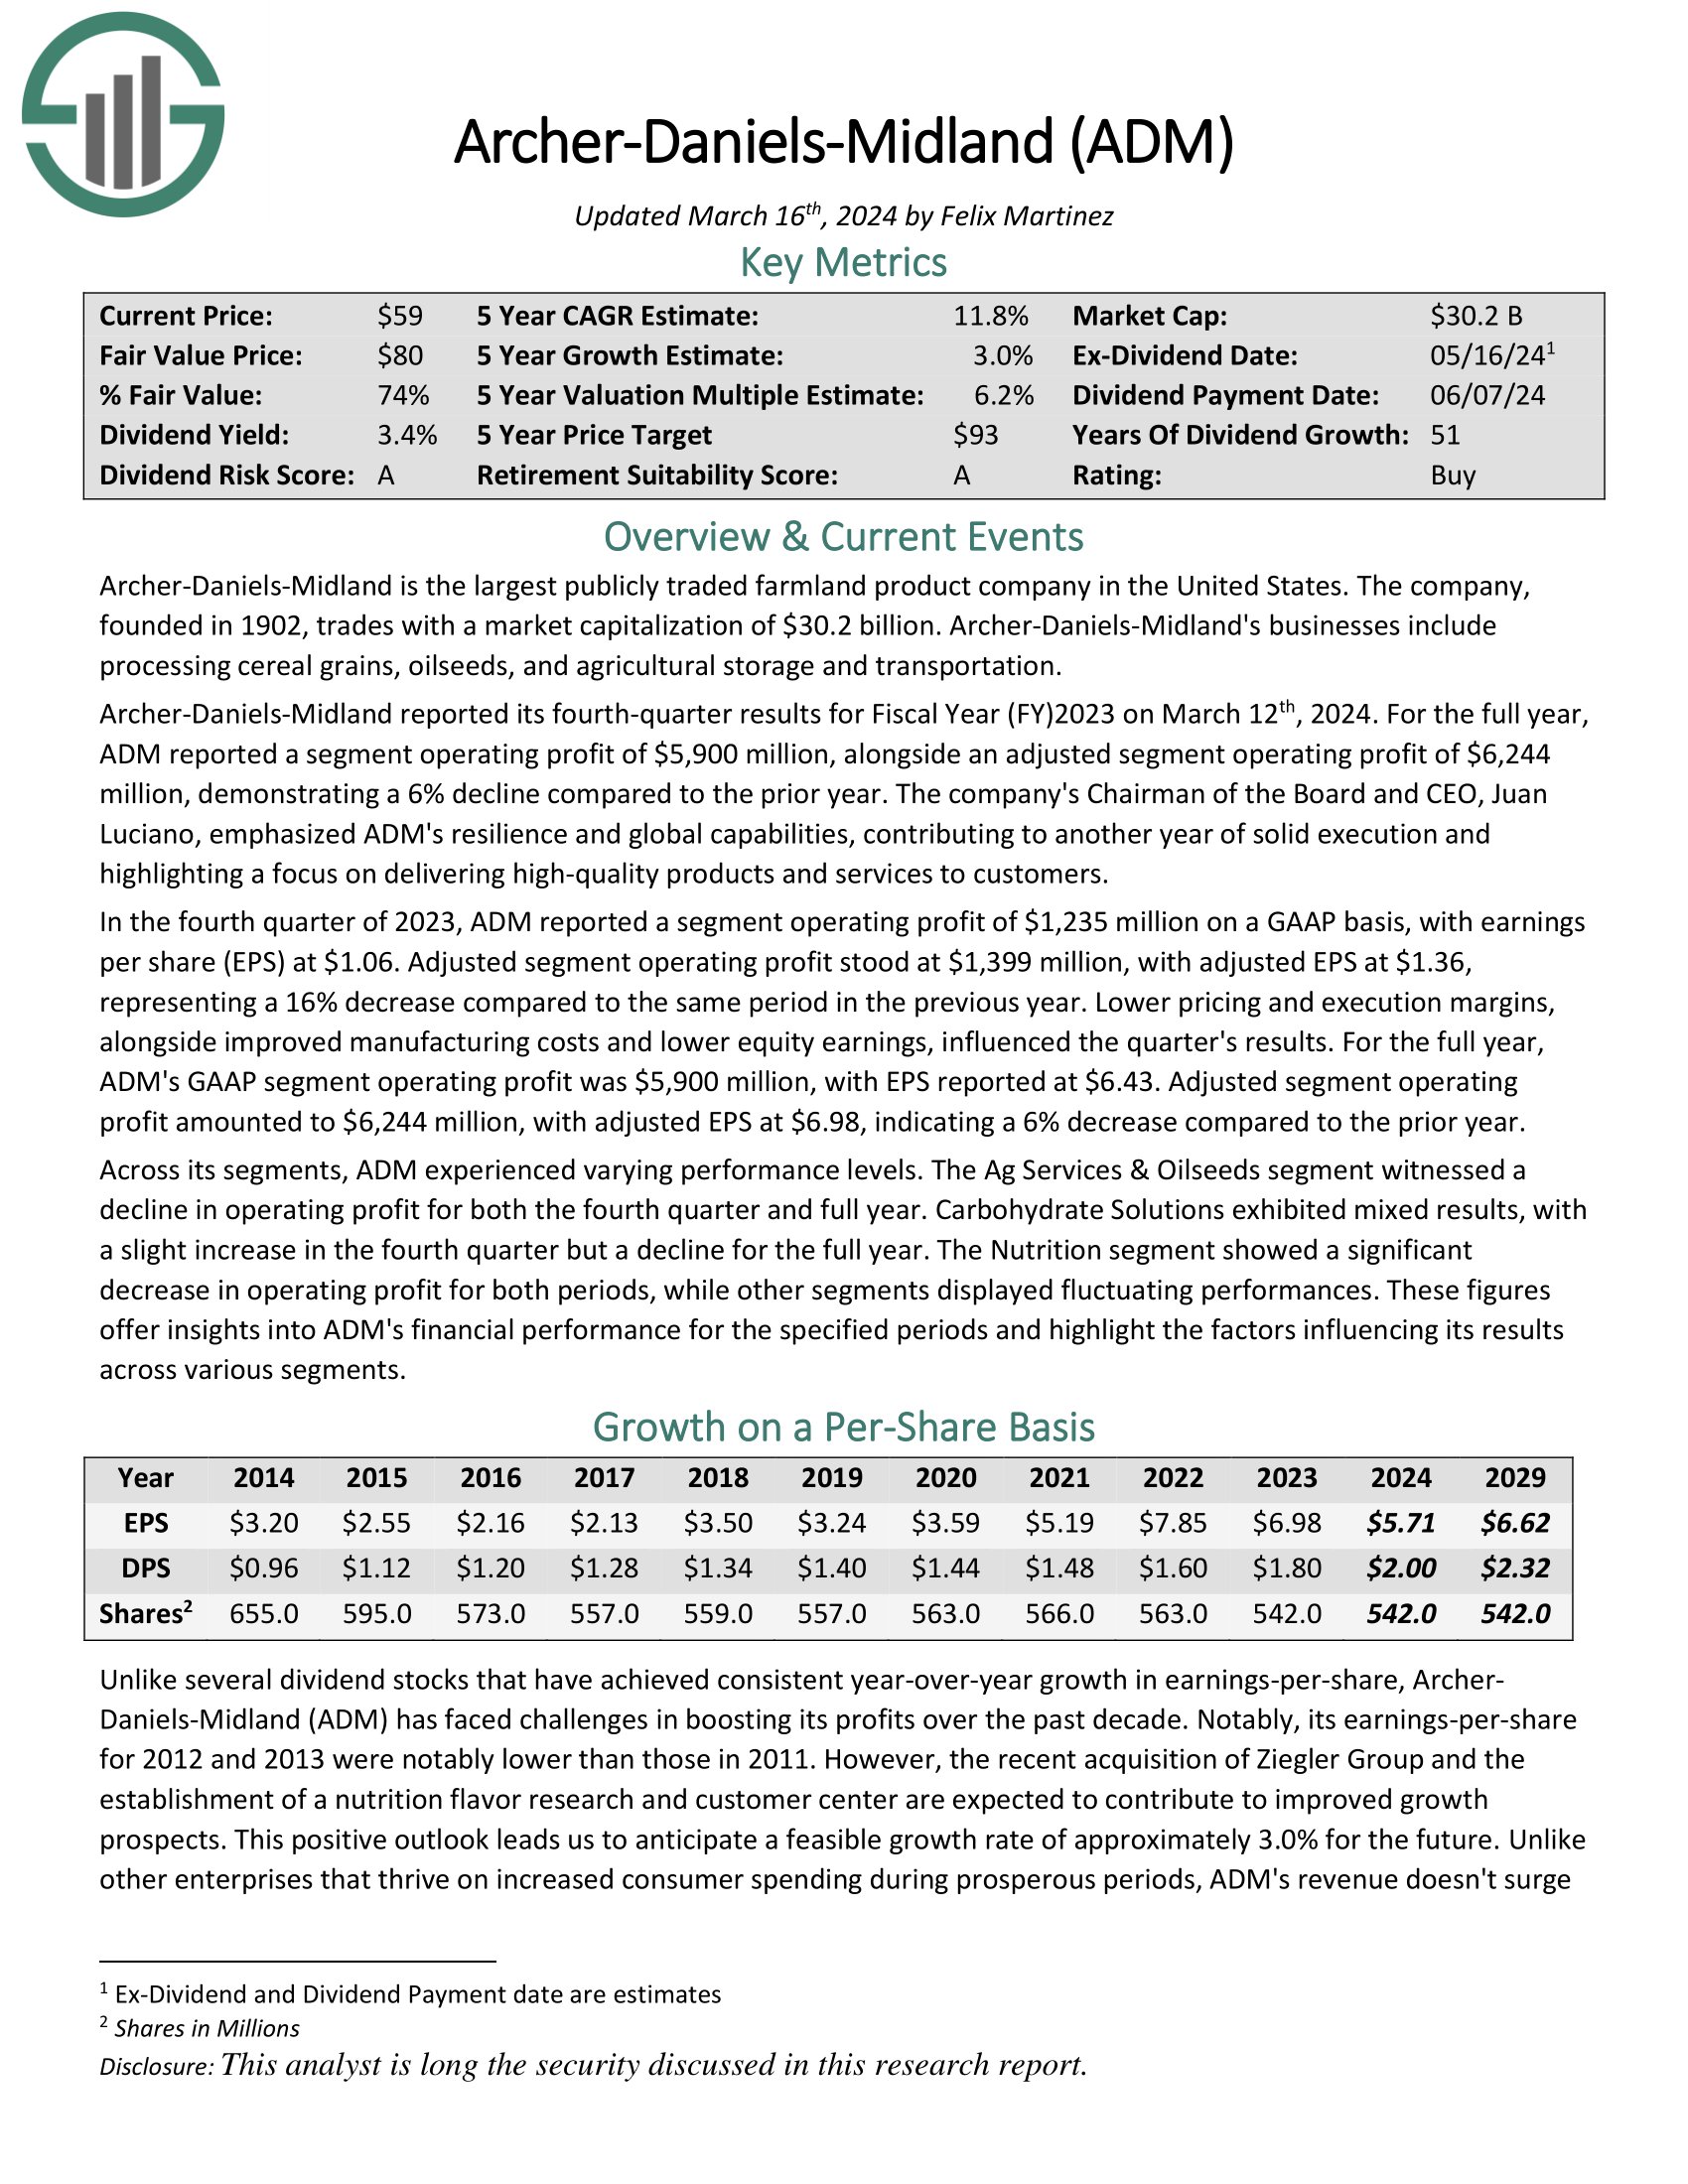
Dividend Aristocrat #5: Archer Daniels Midland (ADM)
- 5-year Expected Annual Returns: 12.1%
Archer-Daniels-Midland is the largest publicly traded farmland product company in the United States. Archer-Daniels-Midland’s businesses include processing cereal grains, oilseeds, and agricultural storage and transportation.
Archer-Daniels-Midland reported its fourth-quarter results on March 12th, 2024. For the full year, ADM reported an adjusted segment operating profit of $6,244 million, demonstrating a 6% decline compared to the prior year. The company’s Chairman of the Board and CEO, Juan Luciano, emphasized ADM’s resilience and global capabilities, contributing to another year of solid execution and highlighting a focus on delivering high-quality products and services to customers.
In the fourth quarter of 2023, ADM reported adjusted EPS at $1.36, representing a 16% decrease compared to the same period in the previous year.
Click here to download our most recent Sure Analysis report on ADM (preview of page 1 of 3 shown below):
Dividend Aristocrat #4: Sysco Corporation (SYY)
- 5-year Expected Annual Returns: 12.3%
Sysco Corporation is the largest wholesale food distributor in the United States. The company serves 600,000 locations with food delivery, including restaurants, hospitals, schools, hotels, and other facilities.
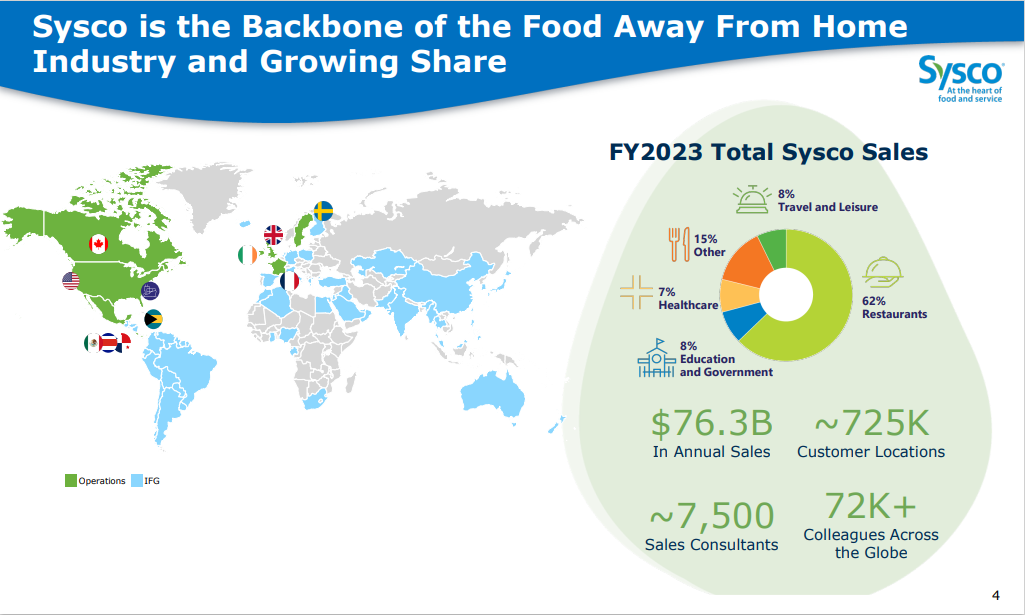
Source: Investor Presentation
On January 30th, 2024, Sysco reported second-quarter results for Fiscal Year (FY) 2024. In this period of fiscal year 2024, key metrics demonstrated positive growth compared to the same quarter in the previous fiscal year. Sales increased by 3.7%, driven by a 3.4% rise in U.S. Foodservice volume and a 2.9% increase in U.S. local volumes.
Adjusted EBITDA showed a remarkable 82.7% increase, reaching $914.3 million. Earnings per share (EPS) surged by 192.9% to $0.82, with adjusted EPS growing by 11.3% to $0.89.
Click here to download our most recent Sure Analysis report on SYY (preview of page 1 of 3 shown below):

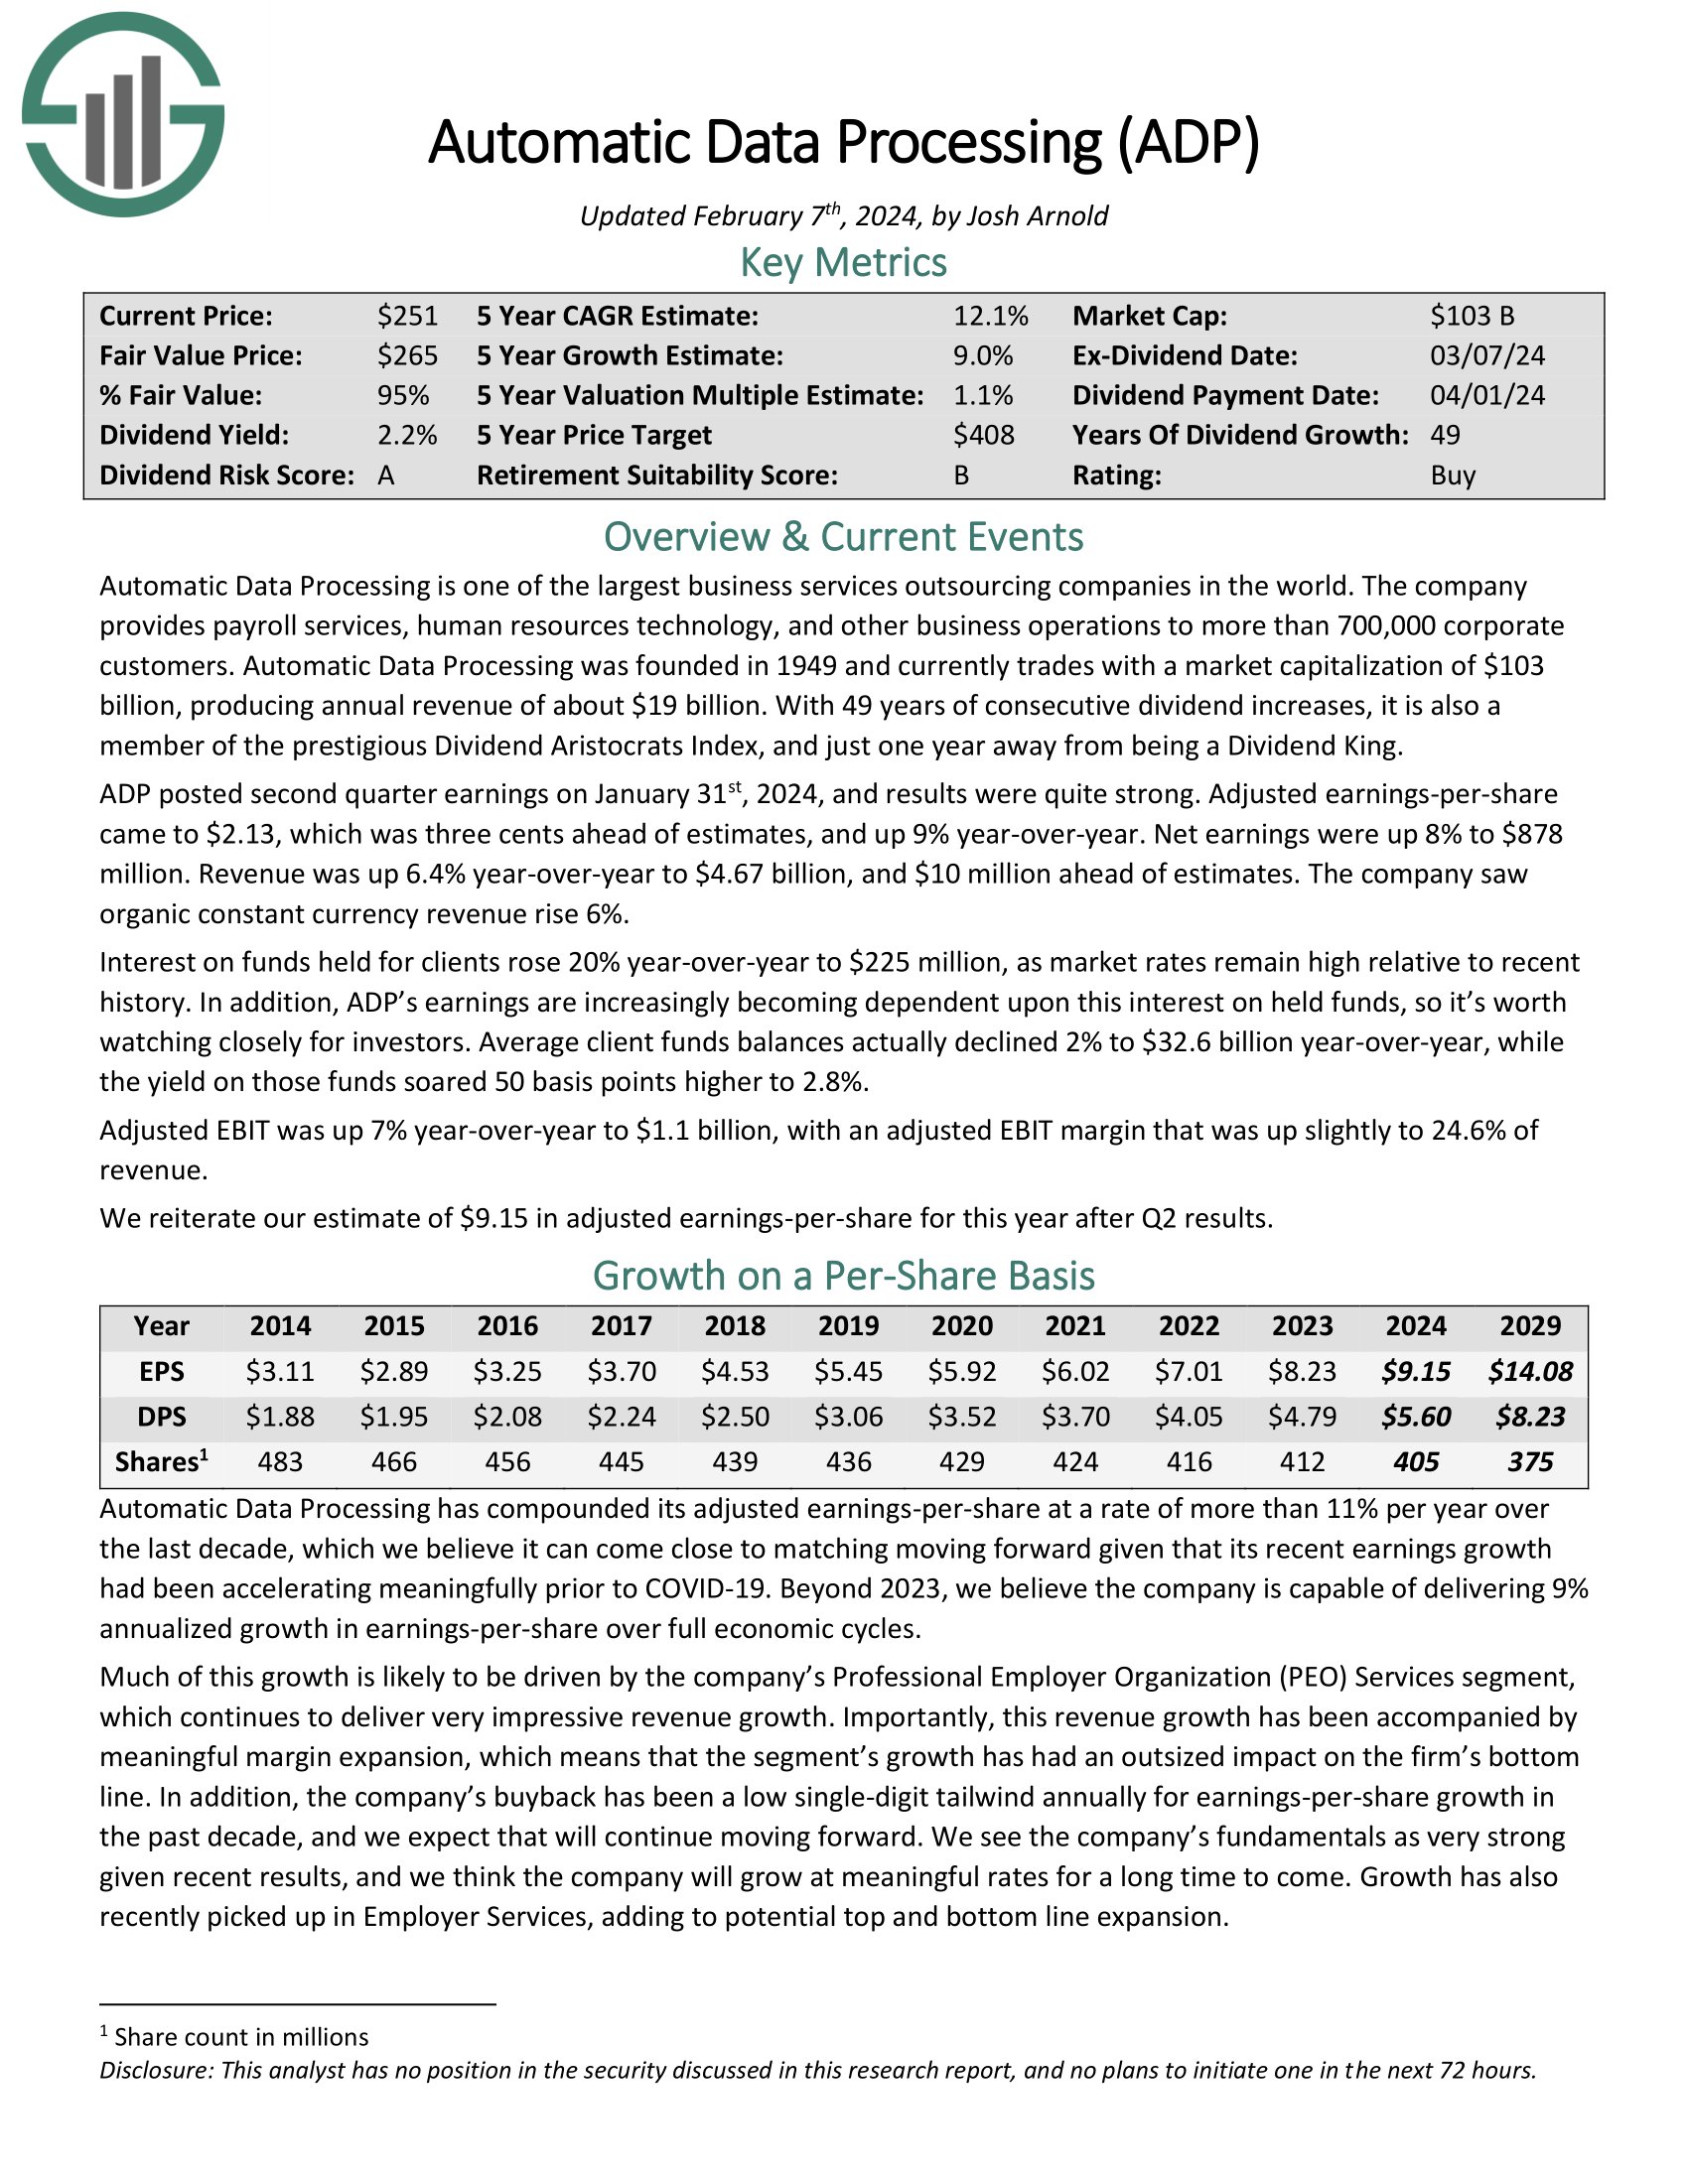
Dividend Aristocrat #3: Automatic Data Processing (ADP)
- 5-year Expected Annual Returns: 12.9%
Automatic Data Processing is one of the largest business services outsourcing companies in the world. The company provides payroll services, human resources technology, and other business operations to more than 700,000 corporate customers.
ADP posted second quarter earnings on January 31st, 2024, and results were quite strong. Adjusted earnings-per-share came to $2.13, which was three cents ahead of estimates, and up 9% year-over-year. Net earnings were up 8% to $878 million. Revenue was up 6.4% year-over-year to $4.67 billion, and $10 million ahead of estimates. The company saw organic constant currency revenue rise 6%.
Beyond 2023, we believe the company is capable of delivering 9% annualized growth in earnings-per-share over full economic cycles. Much of this growth is likely to be driven by the company’s Professional Employer Organization (PEO) Services segment, which continues to deliver very impressive revenue growth.
Click here to download our most recent Sure Analysis report on ADP (preview of page 1 of 3 shown below):
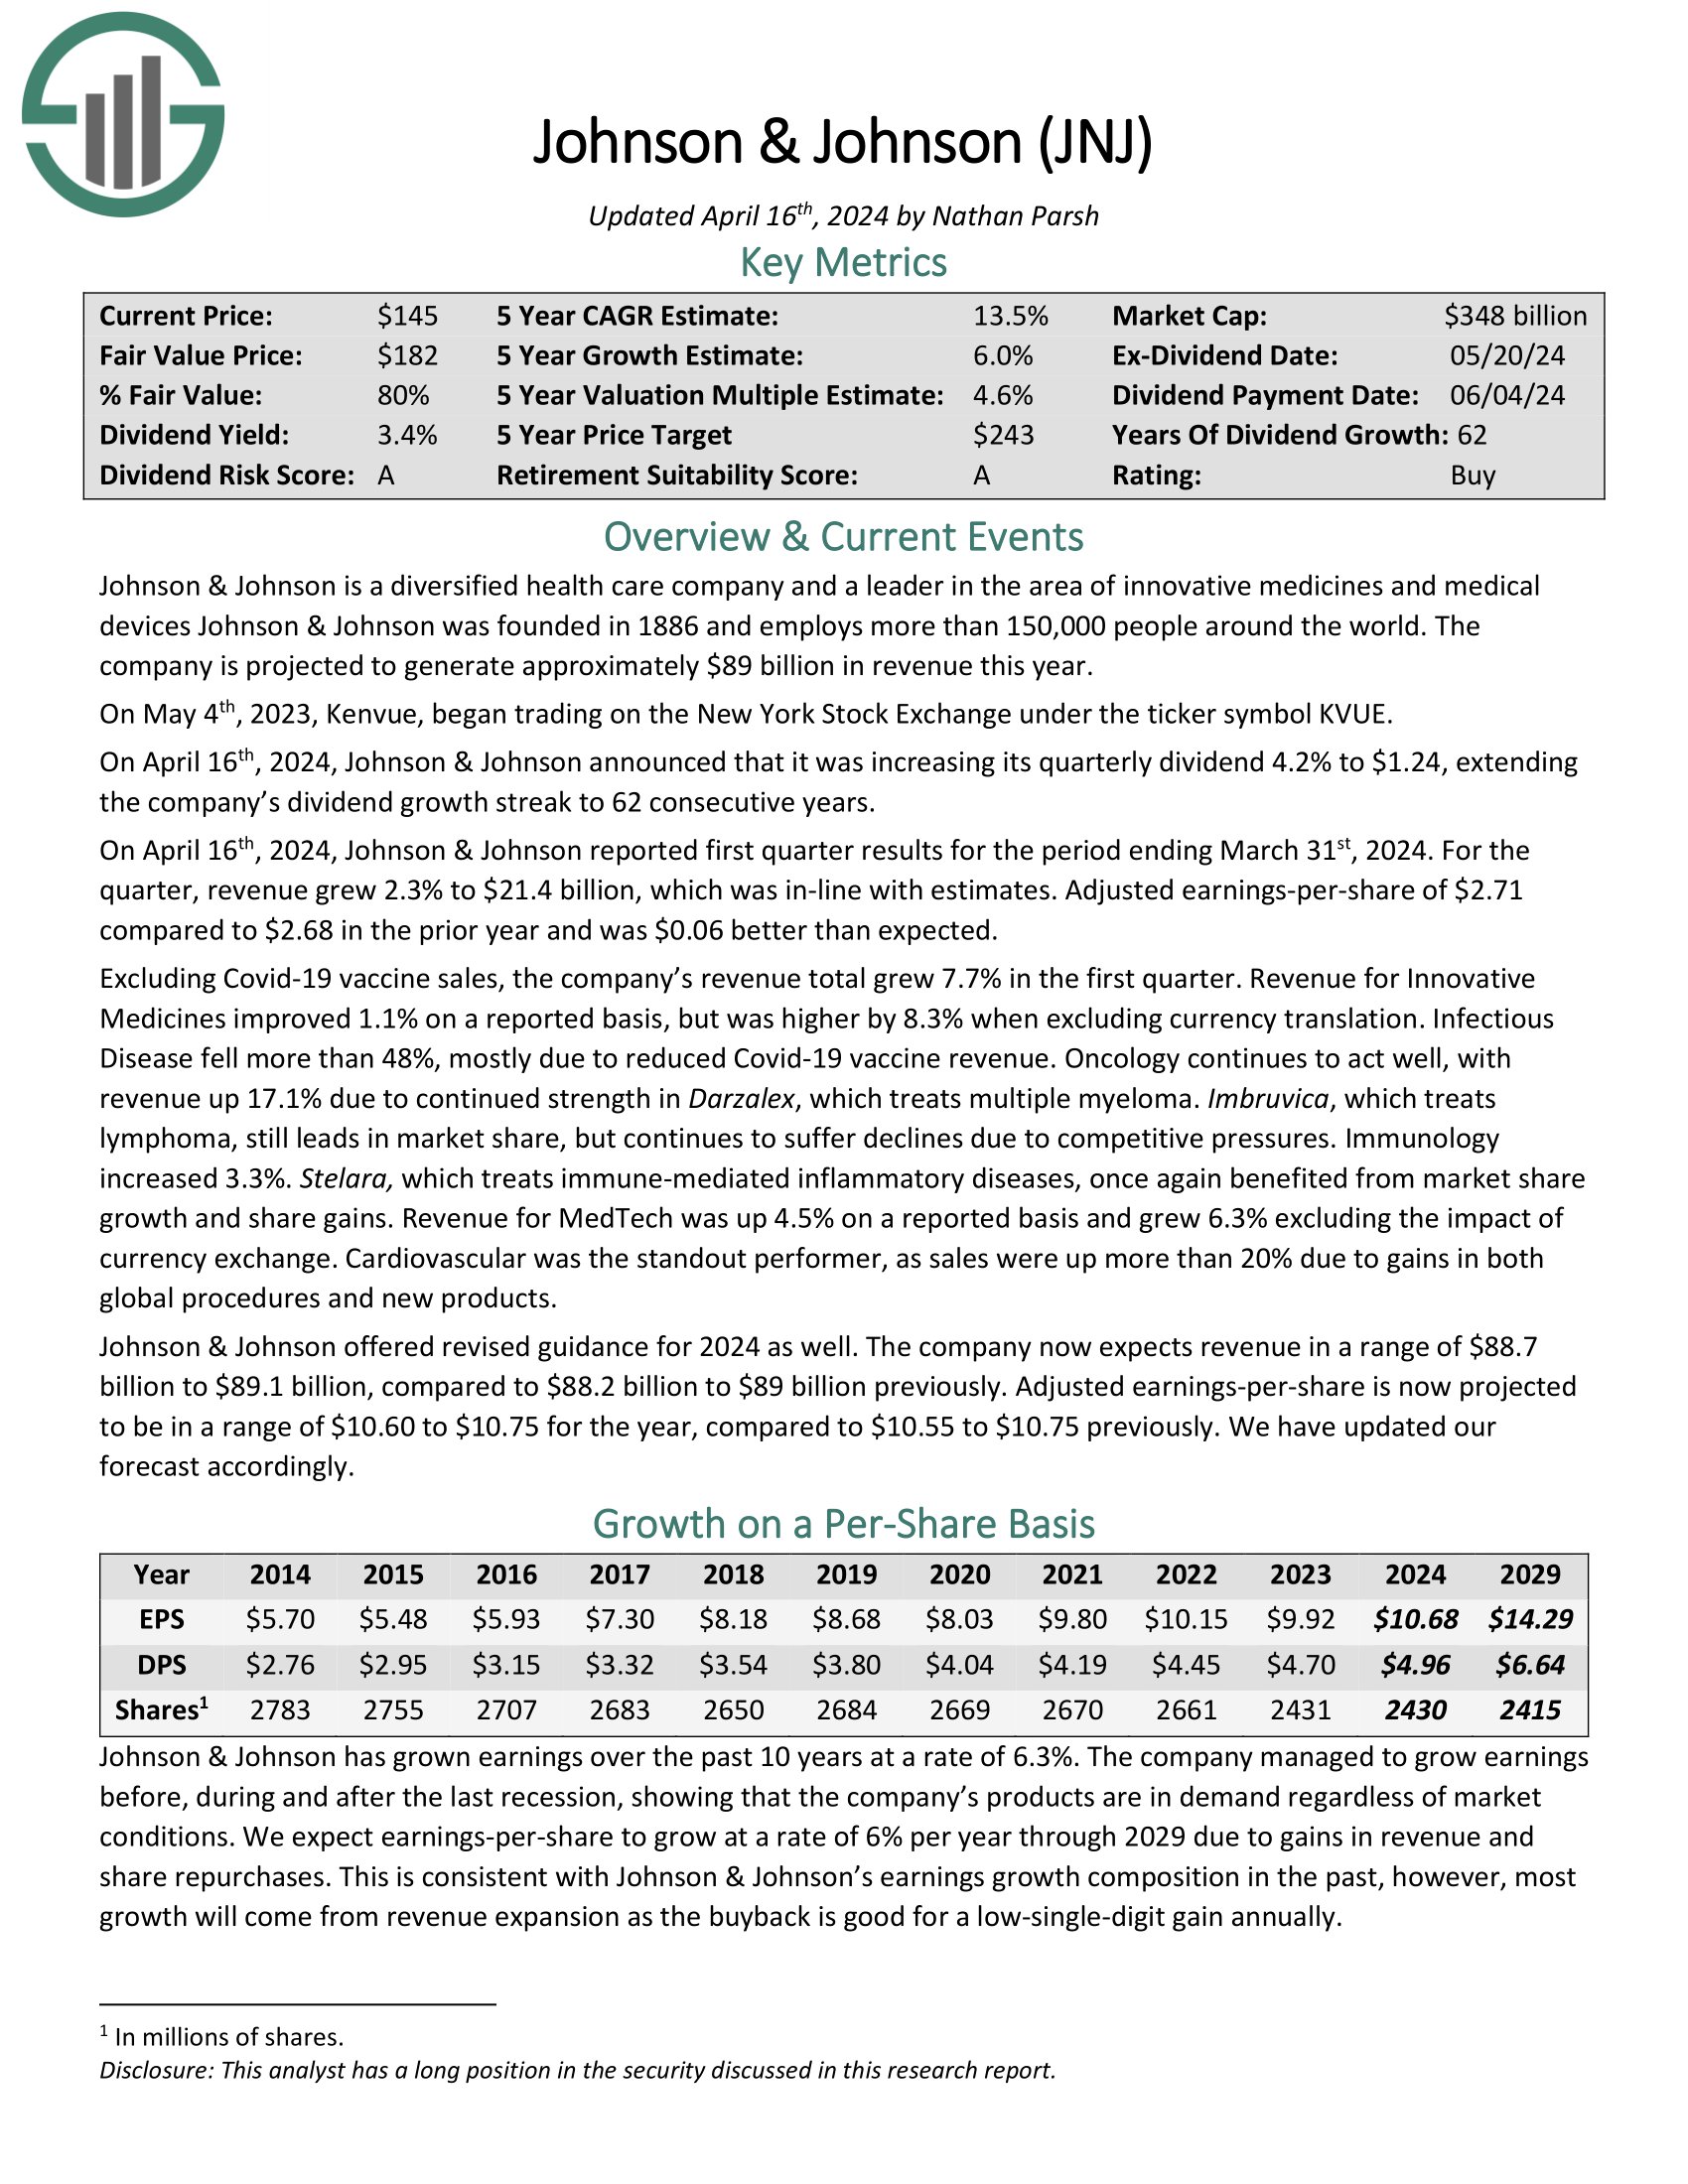
Dividend Aristocrat #2: Johnson & Johnson (JNJ)
- 5-year Expected Annual Returns: 13.6%
Johnson & Johnson is a diversified health care company and a leader in the area of pharmaceuticals (~49% of sales), medical devices (~34% of sales) and consumer products (~17% of sales). The company has annual sales in excess of $93 billion.
On April 16th, 2024, Johnson & Johnson reported first quarter results for the period ending March 31st, 2024. For the quarter, revenue grew 2.3% to $21.4 billion, which was in-line with estimates. Adjusted earnings-per-share of $2.71 compared to $2.68 in the prior year and was $0.06 better than expected.
The company has increased its dividend for 60 consecutive years, making it a Dividend King. The stock is owned by many well-known money managers. For example, J&J is a Kevin O’Leary dividend stock.
Click here to download our most recent Sure Analysis report on JNJ (preview of page 1 of 3 shown below):
Dividend Aristocrat #1: PPG Industries (PPG)
- 5-year Expected Annual Returns: 14.4%
PPG Industries is the world’s largest paints and coatings company. Its only competitors of similar size are Sherwin-Williams and Dutch paint company Akzo Nobel. PPG Industries was founded in 1883 as a manufacturer and distributor of glass (its name stands for Pittsburgh Plate Glass) and today has approximately 3,500 technical employees located in more than 70 countries at 100 locations.
On April 18th, 2024, PPG Industries reported first quarter results for the period ending March 31st, 2024. For the quarter, revenue decreased 1.6% to $4.31 billion, which was $120 million less than expected. Adjusted net income of $441 million, or $1.86 per share, compared to adjusted net income of $432 million, or $1.82 per share, in the prior year. Adjusted earnings-per-share were in-line with consensus estimates.
Click here to download our most recent Sure Analysis report on PPG (preview of page 1 of 3 shown below):

The Dividend Aristocrats In Focus Analysis Series
You can see analysis on every single Dividend Aristocrat below. Each is sorted by GICS sectors and listed in alphabetical order by name. The newest Sure Analysis Research Database report for each security is included as well.
Consumer Staples
- Archer-Daniels-Midland (ADM) | [See newest Sure Analysis report]
- Amcor (AMCR) | [See newest Sure Analysis report]
- Brown-Forman (BF-B) | [See newest Sure Analysis report]
- Colgate-Palmolive (CL) | [See newest Sure Analysis report]
- Church & Dwight (CHD) | [See newest Sure Analysis report]
- Clorox (CLX) | [See newest Sure Analysis report]
- Coca-Cola (KO) | [See newest Sure Analysis report]
- Hormel Foods (HRL) | [See newest Sure Analysis report]
- J.M. Smucker (SJM) | [See newest Sure Analysis report]
- Kimberly-Clark (KMB) | [See newest Sure Analysis report]
- McCormick & Company (MKC) | [See newest Sure Analysis report]
- PepsiCo (PEP) | [See newest Sure Analysis report]
- Procter & Gamble (PG) [See newest Sure Analysis report]
- Sysco Corporation (SYY) [See newest Sure Analysis report]
- Walmart (WMT) | [See newest Sure Analysis report]
Industrials
- A.O. Smith (AOS) | [See newest Sure Analysis report]
- C.H. Robinson Worldwide (CHRW) | [See newest Sure Analysis report]
- Cintas (CTAS) | [See newest Sure Analysis report]
- Dover (DOV) | [See newest Sure Analysis report]
- Emerson Electric (EMR) | [See newest Sure Analysis report]
- Expeditors International (EXPD) | [See newest Sure Analysis report]
- Fastenal Co. (FAST) | [See newest Sure Analysis report]
- Illinois Tool Works (ITW) | [See newest Sure Analysis report]
- 3M (MMM) | [See newest Sure Analysis report]
- Nordson Corporation (NDSN) | [See newest Sure Analysis report]
- Pentair (PNR) | [See newest Sure Analysis report]
- Roper Technologies (ROP) | [See newest Sure Analysis report]
- Stanley Black & Decker (SWK) | [See newest Sure Analysis report]
- W.W. Grainger (GWW) | [See newest Sure Analysis report]
- General Dynamics (GD) | [See newest Sure Analysis report]
- Caterpillar (CAT) | [See newest Sure Analysis report]
Health Care
- Abbott Laboratories (ABT) | [See newest Sure Analysis report]
- AbbVie (ABBV) | [See newest Sure Analysis report]
- Becton, Dickinson & Company (BDX) | [See newest Sure Analysis report]
- Cardinal Health (CAH) | [See newest Sure Analysis report]
- Johnson & Johnson (JNJ) | [See newest Sure Analysis report]
- Kenvue Inc. (KVUE) | [See newest Sure Analysis report]
- Medtronic (MDT) | [See newest Sure Analysis report]
- West Pharmaceutical Services (WST) | [See newest Sure Analysis report]
Consumer Discretionary
- Genuine Parts Company (GPC) | [See newest Sure Analysis report]
- Leggett & Platt (LEG) | [See newest Sure Analysis report]
- Lowe’s Companies (LOW) | [See newest Sure Analysis report]
- McDonald’s (MCD) | [See newest Sure Analysis report]
- Target (TGT) | [See newest Sure Analysis report]
Financials
- Aflac (AFL) | [See newest Sure Analysis report]
- Brown & Brown (BRO) | [See newest Sure Analysis report]
- Cincinnati Financial (CINF) | [See newest Sure Analysis report]
- Franklin Resources (BEN) | [See newest Sure Analysis report]
- S&P Global (SPGI) | [See newest Sure Analysis report]
- T. Rowe Price Group (TROW) | [See newest Sure Analysis report]
- Chubb (CB) | [See newest Sure Analysis report]
Materials
- Air Products and Chemicals (APD) | [See newest Sure Analysis report]
- Albemarle (ALB) | [See newest Sure Analysis report]
- Ecolab (ECL) | [See newest Sure Analysis report]
- PPG Industries (PPG) | [See newest Sure Analysis report]
- Sherwin-Williams (SHW) | [See newest Sure Analysis report]
- Nucor (NUE) | [See newest Sure Analysis report]
- Linde (LIN) | [See newest Sure Analysis report]
Energy
- Chevron (CVX) | [See newest Sure Analysis report]
- Exxon Mobil (XOM) | [See newest Sure Analysis report]
Information Technology
- Automatic Data Processing (ADP) | [See newest Sure Analysis report]
- International Business Machines (IBM) | [See newest Sure Analysis report]
Real Estate
- Essex Property Trust (ESS) | [See newest Sure Analysis report]
- Federal Realty Investment Trust (FRT) | [See newest Sure Analysis report]
- Realty Income (O) | [See newest Sure Analysis report]
Utilities
- Atmos Energy (ATO) | [See newest Sure Analysis report]
- Consolidated Edison (ED) | [See newest Sure Analysis report]
- NextEra Energy (NEE) | [See newest Sure Analysis report]
Historical Dividend Aristocrats List
(1989 – 2024)
The image below shows the history of the Dividend Aristocrats Index from 1989 through 2023:
Note: CL, GPC, and NUE were all removed and re-added to the Dividend Aristocrats Index through the historical period analyzed above. We are unsure as to why. Companies created via a spin-off (like AbbVie) can be Dividend Aristocrats with less than 25 years of rising dividends if the parent company was a Dividend Aristocrat.
Disclaimer: Sure Dividend is not affiliated with S&P Global in any way. S&P Global owns and maintains The Dividend Aristocrats Index. The information in this article and downloadable spreadsheet and image below is based on Sure Dividend’s own review, summary, and analysis of the S&P 500 Dividend Aristocrats ETF (NOBL) and other sources, and is meant to help individual investors better understand this ETF and the index upon which it is based. None of the information in this article or spreadsheet is official data from S&P Global. Consult S&P Global for official information.

This information was compiled from the following sources:
- 1989 – 1991: Dividend Growth Investor
- 1992 – 2015: NOBL Index Historical Constituents
- 2016: Sure Dividend update
- 2017 – 2024: Data from S&P press releases
Frequently Asked Questions
This section will address some of most common questions investors have regarding the Dividend Aristocrats.
1. What is the highest-paying Dividend Aristocrat?
Answer: Realty Income (O) currently yields 5.8%.
2. What is the difference between the Dividend Aristocrats and the Dividend Kings?
Answer: The Dividend Aristocrats must be constituents of the S&P 500 Index, have raised their dividends for at least 25 consecutive years, and satisfy a number of liquidity requirements. The Dividend Kings only need to have raised their dividends for at least 50 consecutive years.
3. Is there an ETF that tracks the Dividend Aristocrats?
Answer: Yes, the Dividend Aristocrats ETF (NOBL) is an exchange-traded fund that specifically holds the Dividend Aristocrats.
4. What is the difference between the Dividend Aristocrats and the Dividend Champions?
Answer: The Dividend Aristocrats and Dividend Champions share one requirement, which is that a company must have raised its dividend for at least 25 consecutive years.
But like the Dividend Kings, the Dividend Champions do not need to be in the S&P 500 Index, nor satisfy the various liquidity requirements.
5. Which Dividend Aristocrat has the longest active streak of annual dividend increases?
Currently, there are 3 Dividend Aristocrats tied at 67 years: Procter & Gamble, Genuine Parts, and Dover Corporation.
6. What is the average dividend yield of the Dividend Aristocrats?
Right now, the average dividend yield of the Dividend Aristocrats is 2.6%.
7. Are the Dividend Aristocrats safe investments?
While there are never any guarantees when it comes to the stock market, we believe the Dividend Aristocrats are among the safest dividend stocks when it comes to the sustainability of their dividend payouts.
The Dividend Aristocrats have durable competitive advantages that allow them to raise their dividends each year, even during a recession.
Other Dividend Lists & Final Thoughts
The Dividend Aristocrats list is not the only way to quickly screen for stocks that regularly pay rising dividends.
- The Dividend Kings List is even more exclusive than the Dividend Aristocrats. It is comprised of 56 stocks with 50+ years of consecutive dividend increases.
- The Blue Chip Stocks List: stocks that qualify as Dividend Achievers, Dividend Aristocrats, and/or Dividend Kings
- The High Dividend Stocks List: stocks that appeal to investors interested in the highest yields of 5% or more.
- The Monthly Dividend Stocks List: stocks that pay dividends every month, for 12 dividend payments per year.
There is nothing magical about the Dividend Aristocrats. They are ‘just’ a collection of high-quality shareholder friendly stocks that have strong competitive advantages.
Purchasing these types of stocks at fair or better prices and holding for the long-run will likely result in favorable long-term performance.