Updated on April 26th, 2024 by Bob Ciura
Essex Property Trust (ESS) isn’t necessarily a household name when it comes to dividend stocks, but the real estate investment trust, or REIT, has produced very impressive growth in the past two decades.
The trust has managed to produce increasing dividends since its IPO in 1994. In all, Essex has increased its dividend for 30 consecutive years.
It is now a member of the Dividend Aristocrats, a group of S&P 500 stocks with at least 25 consecutive years of dividend increases.
That list is now up to 68 companies that have proven to investors they can pay – and increase – their dividends in any economic climate.
You can download an Excel spreadsheet of all 68 Dividend Aristocrats, including important financial metrics such as P/E ratios and dividend yields, by clicking the link below:
Disclaimer: Sure Dividend is not affiliated with S&P Global in any way. S&P Global owns and maintains The Dividend Aristocrats Index. The information in this article and downloadable spreadsheet is based on Sure Dividend’s own review, summary, and analysis of the S&P 500 Dividend Aristocrats ETF (NOBL) and other sources, and is meant to help individual investors better understand this ETF and the index upon which it is based. None of the information in this article or spreadsheet is official data from S&P Global. Consult S&P Global for official information.
Essex faced some headwinds during the coronavirus pandemic of 2020, but the company has made big strides in its ongoing recovery.
Meanwhile, the stock has a 4.0% yield, a leadership position in its core markets, and potential for growth up ahead.
Business Overview
Essex is a Real Estate Investment Trust, or REIT. It started in 1971 as a small real estate company and eventually went public in 1994.
At that time, Essex had grown to 16 multifamily communities as a fully integrated REIT that acquires, develops, redevelops, and manages multifamily apartment communities located in supply-constrained markets.
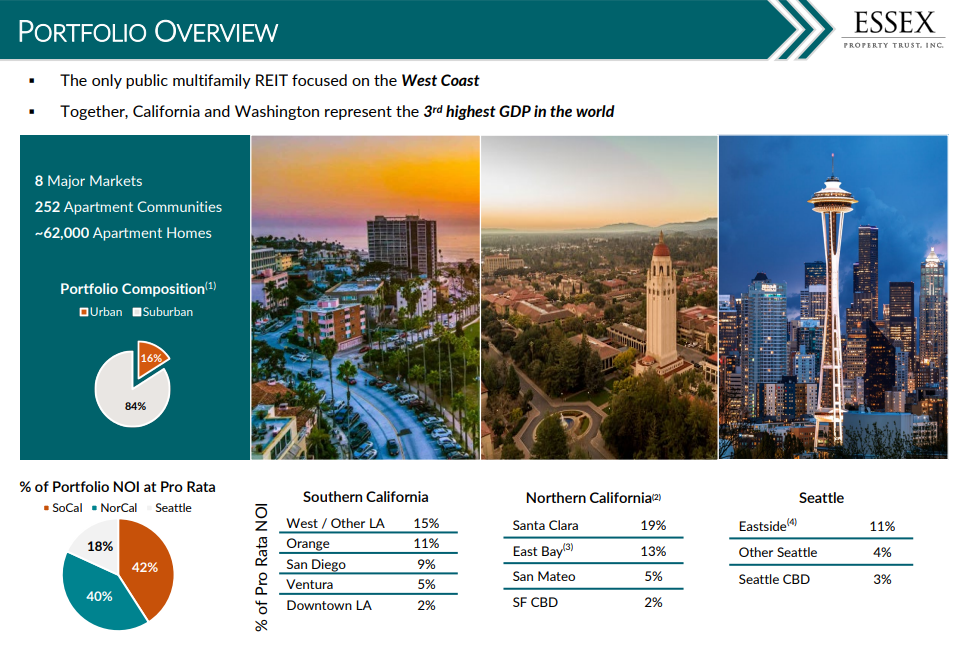
Today, Essex is concentrated on the West Coast of the U.S., including cities like Seattle and San Francisco.
Source: Investor Presentation
The company reported its earnings results for the fourth quarter of 2023 on February 6th. Essex ended 2023 with solid Q4 results, showcasing stable performance in a challenging real estate market.
Core FFO (Funds From Operations), a key metric for REITs, came in at $3.83 per share, exceeding analysts’ expectations.
Strong same-property revenue growth, driven by healthy rent increases, contributed to this result. While same-property expenses also increased, Essex focused on operational efficiency by controlling those costs. The company maintained its high occupancy rate of 96.1%.
Growth Prospects
We see Essex producing 4.7% annual FFO-per-share growth in the next five years. Essex has reached the point where it is a huge player in the markets where it is present, so growth could be more difficult to come by.
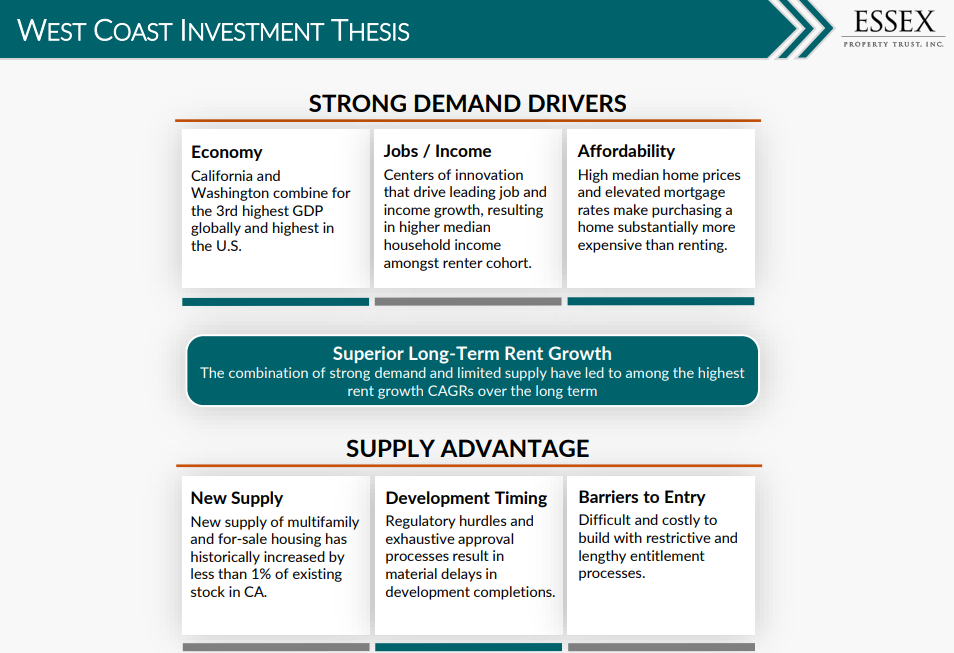
Essex concentrates on the markets on the West Coast because of favorable long-term rental prospects. That area has very high economic productivity and strong rates of job growth, both of which fuel the demand for housing supply.
In addition, single-family residences are very expensive in these markets, making renting more attractive.
Source: Investor Presentation
These markets have strong demand for rental units but also limited new supply as undeveloped land is limited, and construction is lengthy and expensive.
Essex is present in two markets with chronic housing shortage problems, which drives demand for its rental units over time. We think this tailwind will be modest but steady, adding to the trust’s FFO-per-share in the years to come via higher same-property revenue and NOI growth.
Competitive Advantages & Recession Performance
Competitive advantages are difficult to come by for a REIT, given that so many competitors employ essentially identical business models.
However, Essex has scale and size, unlike other apartment REITs, and a management team that is highly skilled in creating shareholder value through various methods.
The company also has a strong financial position, providing it a competitive advantage over its peers, who may be in worse financial shape. Essex has a solid BBB+ credit rating from Standard & Poor’s.
At the same time, net debt to adjusted EBITDA has been coming down since 2020.
Interestingly, Essex performed very well during and after the Great Recession:
- 2007 FFO-per-share: $5.57
- 2008 FFO-per-share: $6.14
- 2009 FFO-per-share: $6.74
- 2010 FFO-per-share: $5.02
This speaks to the resilience of the markets where it is present, as 2020 and 2021 were the only years in the past decade where FFO-per-share declined. We see this recession resilience as highly favorable and adds to the stock’s attractiveness.
Valuation & Expected Returns
At roughly the midpoint of 2024 FFO-per-share guidance ($15.22 per share), Essex is trading for a multiple of 16. We see fair value at 16 times FFO-per-share, which means shares are trading exactly at our fair value estimate. As such, Essex is fairly valued at present.
Therefore, future returns at this price will be derived from FFO growth and dividends. Along with the current dividend yield of 4%, and 4.7% forecasted FFO-per-share growth, we have total projected annual returns to shareholders of 8.7%.
Essex has paid increasing dividends for 30 consecutive years. Dividend growth investors likely find this an attractive quality, and we expect Essex to continue to raise the payout each year for the foreseeable future.
Final Thoughts
Essex has undoubtedly been a world-class REIT since it went public and began paying dividends over a quarter-century ago. The trust has favorable long-term demographics working in its favor and a management team keen to unlock shareholder value.
ESS stock is appealing to investors looking for dividend safety and steady dividend growth over time. With total returns expected at 8.7% annually, we rate ESS stock a hold.
If you are interested in finding more high-quality dividend growth stocks suitable for long-term investment, the following Sure Dividend databases will be useful:
- The 20 Highest Yielding Dividend Aristocrats
- The Dividend Kings List is even more exclusive than the Dividend Aristocrats. It is comprised of 54 stocks with 50+ years of consecutive dividend increases.
- The 20 Highest Yielding Dividend Kings
- The Dividend Achievers List: a group of stocks with 10+ years of consecutive dividend increases.
- The Dividend Champions List: stocks that have increased their dividends for 25+ consecutive years.
Note: Not all Dividend Champions are Dividend Aristocrats because Dividend Aristocrats have additional requirements like being in The S&P 500. - The Dividend Contenders List: 10-24 consecutive years of dividend increases.
- The Dividend Challengers List: 5-9 consecutive years of dividend increases.
- The Monthly Dividend Stocks List: contains stocks that pay dividends each month, for 12 payments per year.
- The 20 Highest Yielding Monthly Dividend Stocks
- The High Dividend Stocks List: high dividend stocks are suited for investors that need income now (as opposed to growth later) by listing stocks with 5%+ dividend yields.
The major domestic stock market indices are another solid resource for finding investment ideas. Sure Dividend compiles the following stock market databases and updates them monthly:


