Updated on September 20th, 2023 by Nate Parsh
Nordson Corporation (NDSN) has a dividend track record that few companies can rival. The company has increased its cash dividend for 60 consecutive years, ranking it as one of the longest dividend growth streaks in the entire market place.
That puts Nordson among the elite Dividend Kings, a small group of stocks that have increased their payouts for at least 50 consecutive years. You can see the full list of all 50 Dividend Kings here.
Additionally, we created a list of all 50 Dividend Kings along with important financial metrics such as P/E ratios and current dividend yields. You can access your copy of the Dividend Kings sheet by clicking on the link below:
Dividend Kings have the longest track records when it comes to rewarding shareholders with cash, and Nordson is no different. Nordson does not have a household name, and may not be well-known among investors. But the company certainly has a long and successful history of raising its dividend.
Nordson has been a high-growth company for many years. In this article we’ll examine the business, as well as its prospects for investment.
Business Overview
Nordson was founded in 1954 in Amherst, Ohio, but the company can trace its roots much further back to 1909 as the U.S. Automatic Company. That enterprise specialized in making screw machine parts for the fledgling automotive industry but in the 1930’s, the company shifted to making more high-precision parts you’d probably associate with the Nordson of today.
Then in 1954, Nordson was started as a division of the US Automatic Company via the acquisition of patents covering the “hot airless” method of spraying paint and other coating materials. The rest, as they say, is history as Nordson has grown to about $2.6 billion in annual revenue, and trades with a market cap of just over $13 billion.
Nordson engineers, manufactures and markets unique products used to dispense, apply and control adhesives, sealants, polymers, coatings and other fluids to test for quality as well as to treat and cure surfaces. The company’s products are found all over the world – sold primarily by a direct, global sales force – and offer custom solutions to their customers’ engineering problems. Nordson has built a reputation over the past five decades of quality and value with its wide range of solutions.
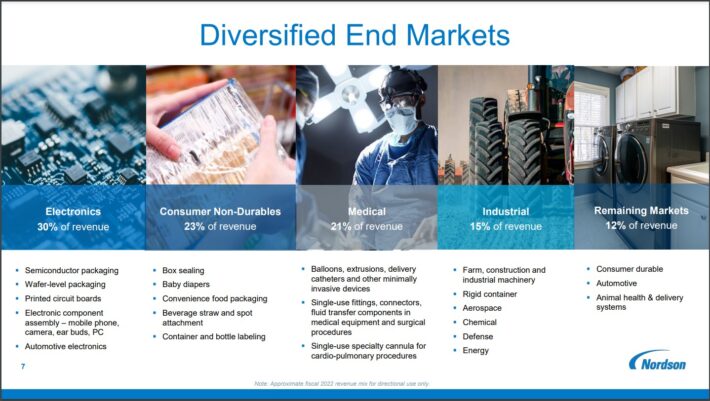
The company has a highly diverse customer base:
Source: Investor Presentation
Nordson is split into three business segments: Industrial Precision Solutions, Medical and Fluid Solutions, and Advanced Technology Solutions. The first segment is made up of adhesives, coatings, paints, finishes, and sealants. Medical and Fluid Solutions segment contains products such as plastic tubing, balloons, catheters, fluid connection components, and syringes. The Advanced Technology Solutions segment is comprised of electronic processing systems.
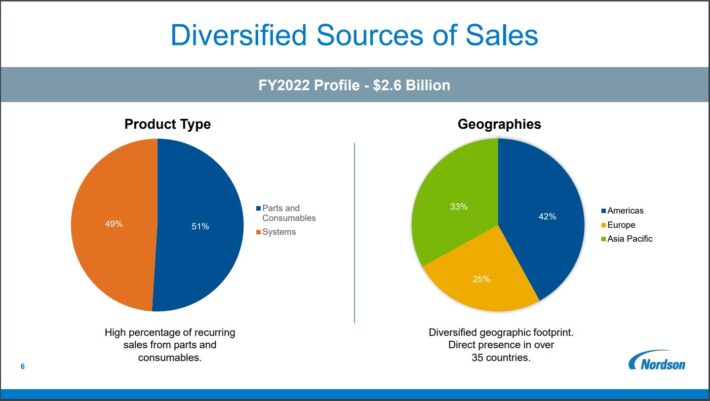
Nordson’s revenue mix is highly diversified as approximately 42% of it comes from the U.S. The remainder is from a wide variety of global customers, offering Nordson not only a diverse customer base, but also diversity when it comes to currencies. We note that this opens the company’s results up to currency volatility, such as what markets experienced in recent years.
The U.S. is Nordson’s largest in terms of geographic presence, but Asia-Pacific and Europe aren’t far behind. Nordson is a truly global company.
Source: Investor Presentation
In terms of product type, Nordson generates about 51% of its sales from parts and consumables, which is a relatively attractive area of focus because much of this revenue is recurring in nature. Separately, Nordson generates the balance of its sales from systems.
Growth Prospects
From 2010-2019, Nordson more than doubled its revenue and grew its earnings per share at an 11.3% average annual rate. The company stumbled in 2020, with a 6.6% decline in earnings-per-share. Management attributed the lackluster performance to the challenging global economic environment amid the coronavirus pandemic.
However, the company remained highly profitable even during the worst of the pandemic, and only experienced a mild decline in EPS for 2020. Nordson was back to growth in 2021, with an extremely impressive 41% increase in earnings-per-share for 2021. The company followed this up with a 22% improvement in 2022.
The company reported third quarter earnings on August 21st, 2023, and results were mixed, with the company beating bottom-line estimates, but missing on revenue.
The company reported sales of $649 million, which was a 2% decline year-over-year. Organic volume was down slightly for the period. In terms of segments, Advanced Technology Solutions revenue was down 3%, Medical and Fluid Solutions fell 4%, and Industrial Precision Solutions saw a 1% decline.
Earnings-per-share came to $2.35 on an adjusted basis, down about 6% year-over-year. The company narrowed guidance and now expects adjusted earnings-per-share in a range of $8.90 to $9.05, compared to a prior range of $8.90 to $9.30. We now expect adjusted earnings-per-share of $8.98 as a result.
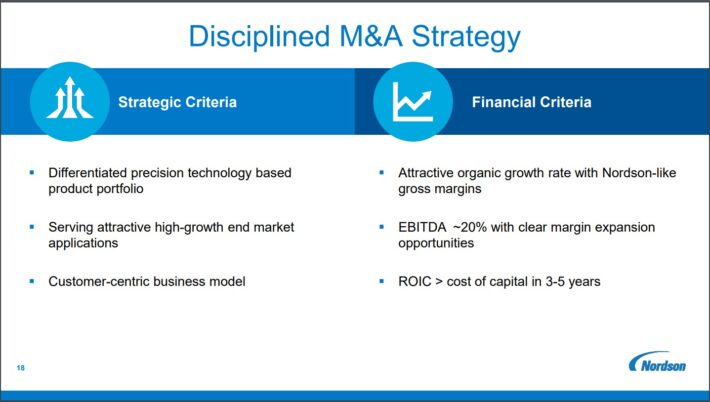
We believe that the long-term growth prospects of Nordson should remain intact. There are many levers for Nordson’s long-term growth. Nordson is a serial acquirer and has been basically from the beginning when it was started with the acquisition of patents covering the hot airless method of spraying.
Nordson’s track record when it comes to acquisitions is a good one as the company looks for takeover targets that give it some sort of competitive advantage it does not already possess, with high percentages of recurring revenue and expense synergies.
Growth-by-acquisition is a difficult endeavor for long-term success but Nordson has proven its ability to do so over the long term. This is a key differentiator for Nordson and should not be overlooked by investors. Nordson has generated strong growth for many years, consisting of both internal initiatives as well as acquisitions.
Source: Investor Presentation
The combination of acquisitions, organic growth and focus on continuous improvement drives, not only top line expansion, but margin gains as well. Organic revenue growth is driven by continually introducing new products and technology. This steady stream of new ideas turns into new products and drives organic revenue growth.
In addition, Nordson’s focus on emerging markets has been a significant growth driver and will continue to contribute to growth in the future. The company’s emerging markets have produced low double-digit revenue growth on average in the past decade, outpacing Nordson’s core markets of the U.S. and Europe.
The growing middle classes of these emerging markets should allow Nordson to continue to see impressive rates of organic revenue growth as well as opening up the opportunity for continued, targeted acquisitions in those markets.
Nordson has also been in the process of improving its efficiency through what it calls the Nordson Business System. This is essentially a set of tools and best practices Nordson has collected over the years that is rooted in Lean Six Sigma principles and is applied throughout the company in all business units. Nordson closely monitors and measures results against benchmarks and this focus on efficiency is a growth driver via margins.
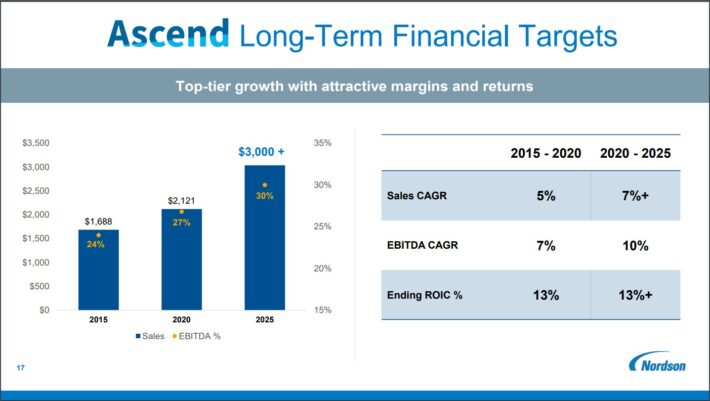
Nordson has managed to grow its EBITDA margin alongside its revenue over the last five years, and the company expects continued growth and margin expansion through 2025.
Source: Investor Presentation
Thanks to all the above growth drivers, we expect Nordson to grow its earnings per share at a 8.0% average annual rate over the next five years.
Competitive Advantages & Recession Performance
Nordson’s competitive advantages are varied and when combined, they paint a pretty rosy picture of the company’s position. First, Nordson has an impressive global infrastructure that puts it in a place of not only having a diverse customer base, but diverse groups of talent as well.
In addition, its facilities are where its customers are in the world (direct presence in 35 countries), and hence Nordson can react more quickly to product needs. This also affords Nordson an advantage when service is needed, as it has people near its customers wherever they are. This is the sort of thing that drives long term relationships, which are Nordson’s bread and butter.
That brings us to our next point, which is Nordson’s R&D and patents. Nordson only spends about 3% of its revenue on R&D but it makes the most of it, filing for dozens of patents each year. In addition, it buys patents and businesses with critical products it can use to supplement its existing lines.
Moreover, Nordson’s large installed customer base means that not only does it have a large amount of recurring revenue, but it is also much more challenging for competitors to take customers away. Switching costs are high for the kinds of things Nordson sells and, thus, the incumbent in any given space has a huge advantage. Nordson’s installed base has many advantages and is a primary reason why the company has remained so successful.
Nordson’s many competitive advantages allow it to hold up fairly well in recessionary environments; the company’s earnings-per-share during and after the Great Recession are below:
- 2007 earnings-per-share of $1.33
- 2008 earnings-per-share of $1.77 (increase of 33%)
- 2009 earnings-per-share of $1.20 (decrease of 32%)
- 2010 earnings-per-share of $2.24 (increase of 87%)
Earnings were volatile during the recession, but overall, Nordson performed very well. There are not many companies with EPS figures that look like this during and after the Great Recession and in particular, ones that manufacture for a living. Keep in mind that many products of Nordson require capital expenses from its customers, whose budgets tend to be slashed during recessions.
However, Nordson also sells things that are absolutely vital to many businesses and thus, when the dust settles, those orders tend to materialize. Indeed, Nordson’s recession-resistance is surprisingly good. We saw the company’s resilience to weak economic conditions during the pandemic-impacted period of 2020 and 2021 once again. Among industrial companies in particular, Nordson is quite resilient to weak economic conditions.
Valuation & Expected Returns
We expect Nordson to generate earnings-per-share of $8.98 this year. As a result, the stock is trading at a forward price-to-earnings ratio of 25.7.
We consider a price-to-earnings ratio of 23 to be fair for Nordson. With shares slightly higher than that today, we see a 2.2% headwind annually from the valuation.
We also expect 8.0% annual EPS growth over the next five years while the stock is also offering a 1.2% dividend yield. Both of these items will add positively to shareholder returns. However, with the yield and valuation headwind largely offsetting each other, we see 6.8% total annual returns in the years ahead.
Nordson’s strong free cash flow and disciplined approach to acquisitions mean that the dividend is very well covered. It also happens to grow quickly. Nordson has raised its dividend every year for 60 years. The 2021 and 2022 dividend raises were 31% and 27%, respectively, so aggressive dividend growth is always possible from the company. However, we note that the most recent increase was for just 4.6%. Still, the longevity of Nordson’s dividend growth streak is outstanding.
A low payout ratio helps the company grow its dividend. With a projected payout ratio of 30% this year, the dividend is well-covered with room for continued increases.
Nordson’s approach to spending its cash is a bit different from other companies in that, depending upon the year, it may buy back stock, make acquisitions, pay down debt or any number of other things. Since 2012, Nordson has spent its cash in different ways from one year to the next, including more than half of it over this time frame on acquisitions. There have been years of high levels of buybacks, and years with none.
Overall, Nordson’s results can be lumpy but the company is tremendously successful in generating growth over the long term.
Final Thoughts
Nordson is a high-quality business with an impressive dividend growth streak. Nordson isn’t a strong stock for high income. This is somewhat surprising, given that it is a very rare Dividend King, but the low payout ratio shows that a generous dividend is not a priority for management.
The priority is growing the business and this company has done that exceedingly well, producing sector-leading total returns for shareholders. The dividend will rise for many more years because Nordson has made it clear over the past 60 years that it intends to continue doing so for the foreseeable future.
We see Nordson as a hold at the moment given expected total returns of less than 7% annually.
The following databases of stocks contain stocks with very long dividend or corporate histories, ripe for selection for dividend growth investors.
- The Dividend Aristocrats List: S&P 500 stocks with 25+ years of dividend increases.
- The High Yield Dividend Aristocrats List is comprised of the 20 Dividend Aristocrats with the highest current yields.
- The Dividend Achievers List is comprised of ~400 stocks with 10+ years of consecutive dividend increases.
- The High Yield Dividend Kings List is comprised of the 20 Dividend Kings with the highest current yields.
- The Blue Chip Stocks List: stocks that qualify as Dividend Achievers, Dividend Aristocrats, and/or Dividend Kings
- The High Dividend Stocks List: stocks that appeal to investors interested in the highest yields of 5% or more.
- The Monthly Dividend Stocks List: stocks that pay dividends every month, for 12 dividend payments per year.
- The Dividend Champions List: stocks that have increased their dividends for 25+ consecutive years.
Note: Not all Dividend Champions are Dividend Aristocrats because Dividend Aristocrats have additional requirements like being in The S&P 500. - The Dividend Contenders List: 10-24 consecutive years of dividend increases.
- The Dividend Challengers List: 5-9 consecutive years of dividend increases.
- The Best DRIP Stocks: The top 15 Dividend Aristocrats with no-fee dividend reinvestment plans.
- The High ROIC Stocks List: The top 10 stocks with high returns on invested capital.
- The High Beta Stocks List: The 100 stocks in the S&P 500 Index with the highest beta.
- The Low Beta Stocks List: The 100 stocks in the S&P 500 Index with the lowest beta.
- The Complete List of Russell 2000 Stocks
- The Complete List of NASDAQ-100 Stocks


